Download presentation
Presentation is loading. Please wait.

1
Measuring Global Burden of Disease Ashwini Kalantri Moderator: Dr Pradeep Deshmukh

2
Global Burden of Disease Rationale (Why?) –Assess health status over time –Input to health decision-making and planning processes
 –Assess health status over time –Input to health decision-making and planning processes")
3
Global Burden of Disease – How? Morbidity indicators Mortality indicators Disability indicators Nutritional status indicators Health Care delivery indicators Utilization Rates Indicators of Social and Mental Health Environmental Indicators Socio-economic Indicators Health Policy Indicators Indicators of quality of Life

4
Global Burden of Disease Summary measures of population health: measures that combine information on mortality and non-fatal health outcomes to represent the health of a particular population as a single number

5
History 1940s: Concept of “Years of Life Lost”. 1971: Sullivan’s Index 1983: Quality Adjusted Life Expectancy (QALE). 1990: GBD study – DALYs. 1998: HeaLY DALE, HALE, QALY, DFLE followed
. 1990: GBD study – DALYs. 1998: HeaLY DALE, HALE, QALY, DFLE followed.")
6
Applications of SMPH Comparison of health conditions or overall health status. Quantification of health inequalities. Measuring magnitude of different health problems using a common metrics. Cost Effective Analysis of the benefits of health interventions. Information in setting priorities for health planning, public health programs, research and development, and professional training.

7
SMPH - Types Health Expectancy Health expectancies measure years of life gained or years of improved quality of life. – Disability-free life expectancy (DFLE) – Disability-adjusted life expectancy (DALE) – Healthy adjusted life expectancy (HALE) – Quality adjusted life expectancy (QALE) Health Gaps Health gaps measure lost years of full health in comparison with some ‘ideal’ health status or accepted standard. – Potential Years of Life Lost (PYLL) – Quality Adjusted Life Years (QALY), – Disability Adjusted Life Years (DALY)
 – Disability-adjusted life expectancy (DALE) – Healthy adjusted life expectancy (HALE) – Quality adjusted life expectancy (QALE) Health Gaps Health gaps measure lost years of full health in comparison with some ‘ideal’ health status or accepted standard. – Potential Years of Life Lost (PYLL) – Quality Adjusted Life Years (QALY), – Disability Adjusted Life Years (DALY).")
8
Survival Curve A A B B C C Time lived in optimal health Time lived in suboptimal health Time lost due to mortality

9
Life Expectancy Total life expectancy at birth is given by the area under the upper curve Total life expectancy at birth = A + B A A B B C C A = time lived in optimal health B = time lived in suboptimal health

10
Health Expectancy Health expectancies are population indicators that estimate the average time that a person could expect to live in a defined state of health Health Expectancy = A + f (B) A A B B C C A = time lived in optimal health B = time lived in suboptimal health f (B) = function that assigns weights to years lived in suboptimal health (optimal health has a weight of 1)
 A A B B C C A = time lived in optimal health B = time lived in suboptimal health f (B) = function that assigns weights to years lived in suboptimal health (optimal health has a weight of 1)")
11
Health Gaps Health gaps measure the difference between actual population health and some specified standard or goal Health Gap = C + f (B) A A B B C C B = time lived in suboptimal health C = time lost due to mortality f (B) = function that assigns weights to health states lived during time B, but where a weight of 1 equals to time lived in a health state equivalent to death
 A A B B C C B = time lived in suboptimal health C = time lost due to mortality f (B) = function that assigns weights to health states lived during time B, but where a weight of 1 equals to time lived in a health state equivalent to death")
12
DALE Disability Adjusted Life Expectancy DALE integrates data on –Mortality –Long – term institutionalization –Activity limitations Measures Quality and Quantity of life A set of weights is assigned to four states of health –no activity limitations –activity limitations in leisure activities or transportation –activity limitations at work, home and/or school –institutionalization in a health care facility

13
HALE Health Adjusted Life Expectancy Health-adjusted life expectancy is the number of years in full health that an individual can expect to live given the current morbidity and mortality conditions. Health-adjusted life expectancy uses the Health Utility Index (HUI) to weigh years lived in good health higher than years lived in poor health. Measure of quantity and quality of life
 to weigh years lived in good health higher than years lived in poor health. Measure of quantity and quality of life.")
14
HDI Human Development Index Composite statistic of life expectancy, education, and income indices used to rank countries into four tiers of human development. Created by Mahbub ul Haq and Amartya Sen in 1990

15
MPI Multidimensional Poverty Index Index of acute multidimensional poverty. MPI reveals a different pattern of poverty than income poverty, as it illuminates a different set of deprivations. DimensionIndicators HealthChild Mortality Nutrition EducationYears of School Children enrolled Living StandardsCooking fuel Toilet Water Electricity Floor Assets

16
PQLI Physical Quality of Life The Physical Quality of Life Index (PQLI) is an attempt to measure the quality of life or well-being of a country. Basic literacy rate, infant mortality, and life expectancy at age one, all equally weighted on a 0 to 100 scale.

17
QALY Quality Adjusted Life Years Measures both quality and quantity Used for cost-benefit analysis Number of years added due to the intervention

18
DALY Disability Adjusted Life Years DALY is a measure of overall disease burden, expressed as the cumulative number of years lost due to ill-health, disability or early death

19
DALY Objectives Inclusion of non-fatal health outcomes in the debate on international health policy To quantify the burden of disease using a measure that could also be used for cost- effectiveness analysis.

20
DALY Disability Weights The ‘valuation’ of time lived in non-fatal health states Weights are measured as a number on a scale of 0 to 1, where 0 is assigned to a state comparable to death and 1 is assigned to a state of optimal health Because the DALY measures loss of health, the weights are inverted for DALY calculation with 0 representing a state of optimal health (no loss) and 1 representing a state equivalent to death.
 and 1 representing a state equivalent to death.")
21
DALY Disability Weights Weight for paraplegia of 0.57 - does not mean –Half dead –Halfway between life and death –Society values them as a person less than anyone else. A year with blindness (weight 0.43) > a year with paraplegia (weight 0.57) > a year with unremitting unipolar major depression (weight 0.76). A year in good health followed by death > a year with paraplegia followed by death. A person to live three years with paraplegia followed by death > one year of good health followed by death –(3 years x (1-0.57) = 1.3 ‘healthy’ years is greater than 1 year of good health).
 > a year with paraplegia (weight 0.57) > a year with unremitting unipolar major depression (weight 0.76). A year in good health followed by death > a year with paraplegia followed by death. A person to live three years with paraplegia followed by death > one year of good health followed by death –(3 years x (1-0.57) = 1.3 ‘healthy’ years is greater than 1 year of good health)..")
22
DALY Disability Weights DiseaseDisability Weights Tuberculosis0.331 (0.222– 0.450) HIV/AIDS0.547 (0.382–0.715) Major Depression0.655 (0.469–0.816) Moderate Generalized Musculoskeletal Problems 0.292 (0.197–0.410) Iodine-deficiency goitre0.200 (0.134–0.283) Kwashiorkor0.055 (0.033–0.085) Severe wasting0.127 (0.081–0.183)
 HIV/AIDS0.547 (0.382–0.715) Major Depression0.655 (0.469–0.816) Moderate Generalized Musculoskeletal Problems (0.197–0.410) Iodine-deficiency goitre0.200 (0.134–0.283) Kwashiorkor0.055 (0.033–0.085) Severe wasting0.127 (0.081–0.183)")
23
DALY Discounting The GBD applied a 3% time discount rate to years of life lost in the future to estimate the net present value of years of life lost. With this discount rate, a year of healthy life gained in 10 years’ time is worth 24% less than one gained now.

24
DALY Discounting – Why? To be consistent with measurement of health outcomes in cost-effectiveness analyses To prevent giving excessive weight to deaths at younger ages Disease eradication/research paradox

25
DALY Calculations DALY = Years Lived with Disability (YLD) + Years of Life Lost (YLL)
 + Years of Life Lost (YLL)")
26
YLD Years Lived with Disability YLD = I x DW x L I = number of incident cases DW = disability weight L = average duration of the case until remission or death (years)
")
27
YLL Years of Life Lost YLL = N x L N = number of deaths L = standard life expectancy at age of death in yrs

28
DALY Critique Doesn’t help determine the right intervention The true “burden” of disease will depend on the economic, family and social circumstances Multi-pathology is not the same as multi- causality.

29
DALY Critique Discriminates against young and the old Does not assess qualitative difference in outcomes No Male-Female difference in length of life Discounting future health outcomes

30
The Global Burden of Disease Study 2010

31
DALYs / 1,00,000 GBD Study 2010 Cause19902010Change Tuberculosis1155717-37.9% HIV/AIDS3421184246.3% Malaria13041200-8.0% Common Infectious Diseases 102454107-59.9% Maternal Disorder407234-42.6% Mental disorders253926885.9% Endocrine Disorders 1605177710.7% Musculoskeletal Disorders 2198246212% All Causes4720536145-23.4%

32
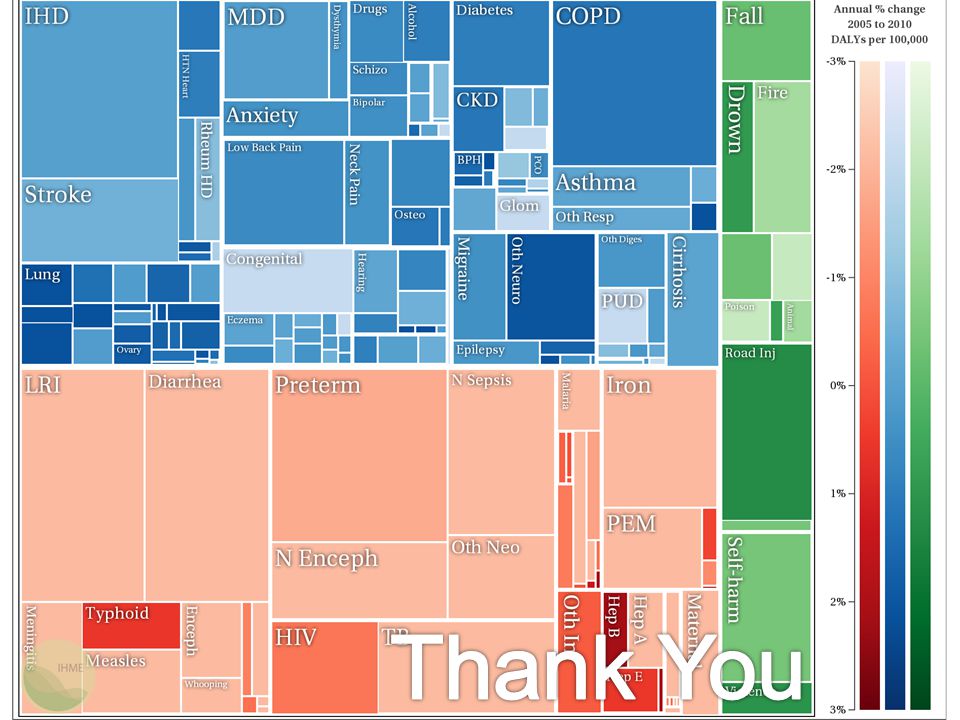
Global DALY Trends

33
India - DALY Trends

35
References 1.Donev D, Zaletel-Kragelj L, Bjegović V, Burazeri G. Measuring the burden of disease: Disability Adjusted Life Years (DALY). Methods and tools in public health. 2010;30:715. 2.Murray CJL, Lopez AD. Global comparative assessments in the health sector: disease burden, expenditures and intervention packages : collected reprints from the Bulletin of the World Health Organization: World Health Organization; 1994. 3.Mathers CD, Vos T, Lopez AD, Salomon J, Ezzati M (ed.) 2001. National Burden of Disease Studies: A Practical Guide. Edition 2.0. Global Program on Evidence for Health Policy. Geneva: World Health Organization. 4.Murray CJL, Vos T, Lozano R, Naghavi M, Flaxman AD, Michaud C, et al. Disability-adjusted life years (DALYs) for 291 diseases and injuries in 21 regions, 1990?2010: a systematic analysis for the Global Burden of Disease Study 2010. The Lancet. 2012;380(9859):2197-223.
. Methods and tools in public health. 2010;30: Murray CJL, Lopez AD. Global comparative assessments in the health sector: disease burden, expenditures and intervention packages : collected reprints from the Bulletin of the World Health Organization: World Health Organization; Mathers CD, Vos T, Lopez AD, Salomon J, Ezzati M (ed.) National Burden of Disease Studies: A Practical Guide. Edition 2.0. Global Program on Evidence for Health Policy. Geneva: World Health Organization. 4.Murray CJL, Vos T, Lozano R, Naghavi M, Flaxman AD, Michaud C, et al. Disability-adjusted life years (DALYs) for 291 diseases and injuries in 21 regions, : a systematic analysis for the Global Burden of Disease Study The Lancet. 2012;380(9859):")
36
References 5.Mathers CD, Fat DM, Boerma JT, Organization WH. The Global Burden of Disease: 2004 Update: World Health Organization; 2008. 6.Murray CJL. Summary measures of population health, 2002: concepts, ethics, measurement and applications: World Health Organization; 2002. 7.Global Burden of Disease. Institute of Health Metrics and Evaluation; 2012 [cited 2013 24 July]; Available from: http://www.healthmetricsandevaluation.org/gbd.. 8.Sayers B, Fliedner T. The critique of DALYs: a counter-reply. Bulletin of the World Health Organization. 1997;75(4):383. 9.Salomon JA, Vos T, Hogan DR, Gagnon M, Naghavi M, Mokdad A, et al. Common values in assessing health outcomes from disease and injury: disability weights measurement study for the Global Burden of Disease Study 2010. The Lancet. 2013;380(9859):2129-43.
: Salomon JA, Vos T, Hogan DR, Gagnon M, Naghavi M, Mokdad A, et al. Common values in assessing health outcomes from disease and injury: disability weights measurement study for the Global Burden of Disease Study The Lancet. 2013;380(9859):")
Similar presentations


 for which the World Health Organization.>")
>")


 and population health in Russia Vladimir Kozlov NRU-Higher school of economics, BSPS Annual Conference, 08/09/11.>")

