Download presentation
Presentation is loading. Please wait.

1
Water Resources

2
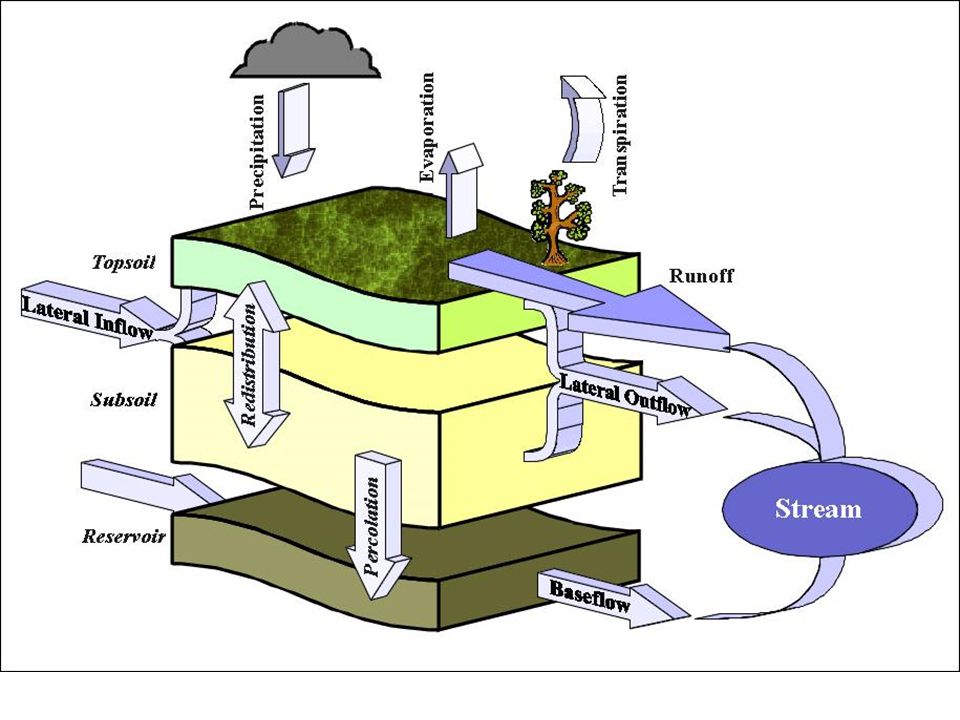
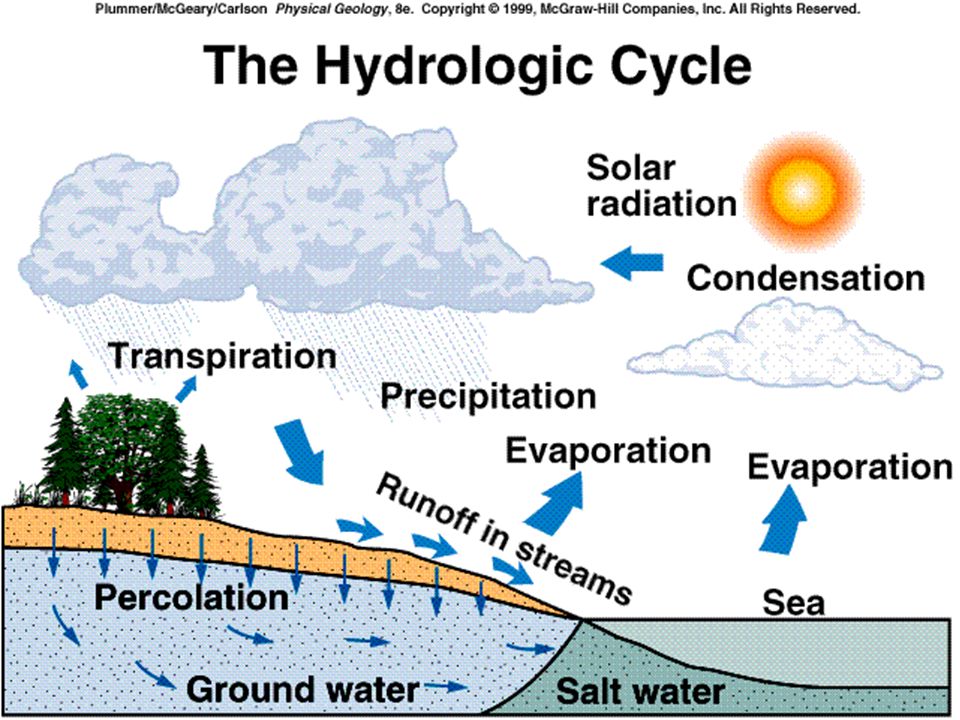
The Hydrologic Cycle Water occurs as a solid, liquid and gas Amount of water is fixed The places where water resides are called Reservoirs Water constantly moves from one reservoir to another

3
The Hydrologic Cycle: Pathways Evaporation Evapotranspiration Condensation Precipitation Runoff Infiltration/Percolation

6
RESERVOIRS Comparison of the amount of water supply held in each of the major reservoirs If the total earth’s water supply was a 55 gallon drum

7
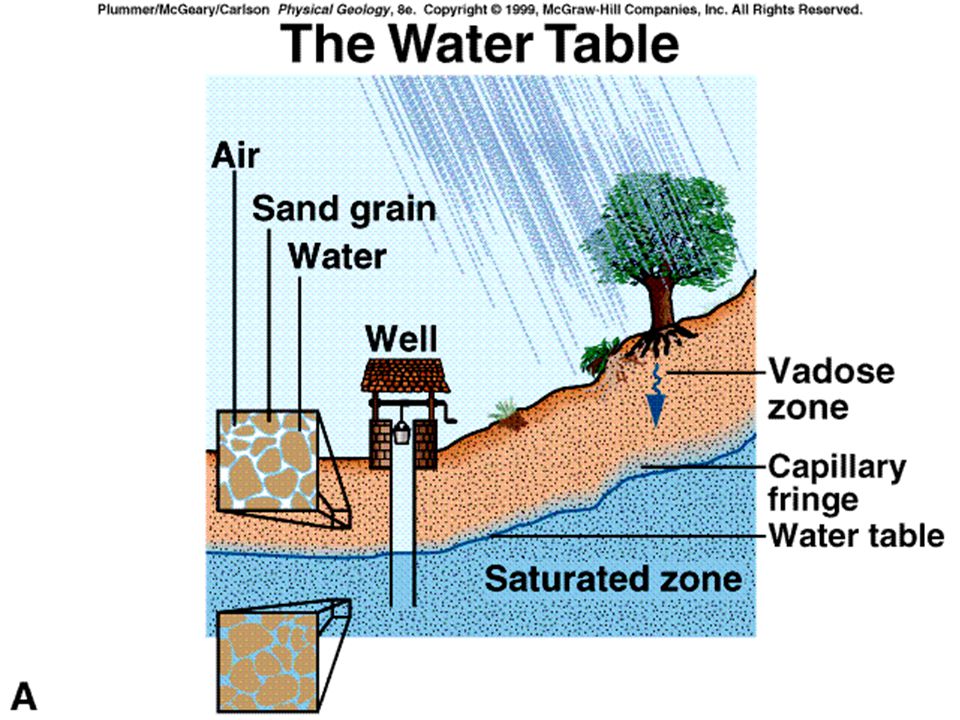
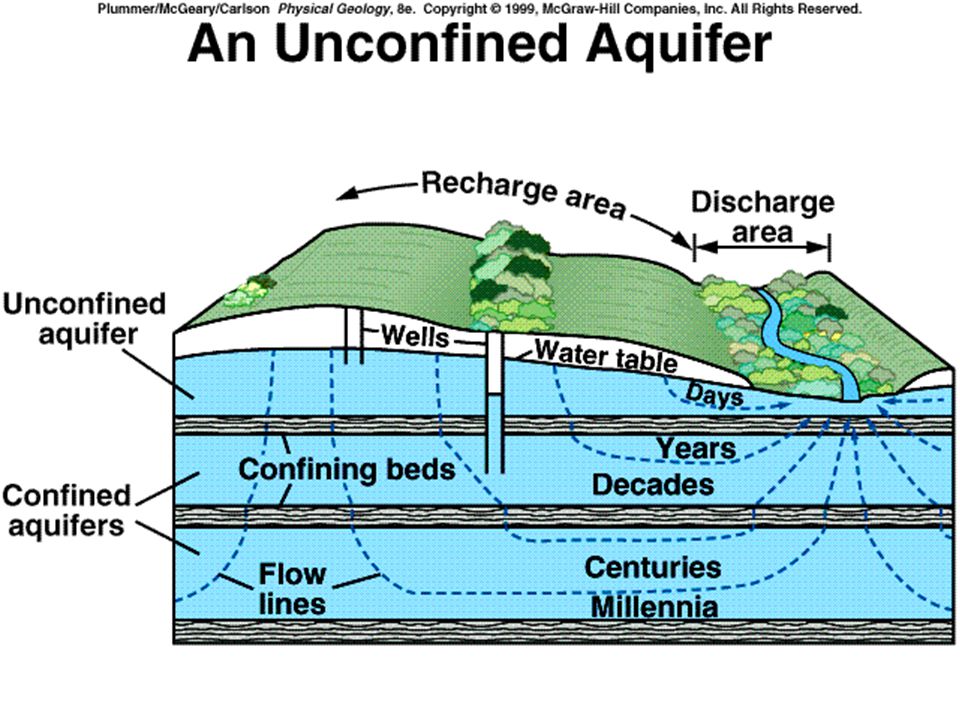
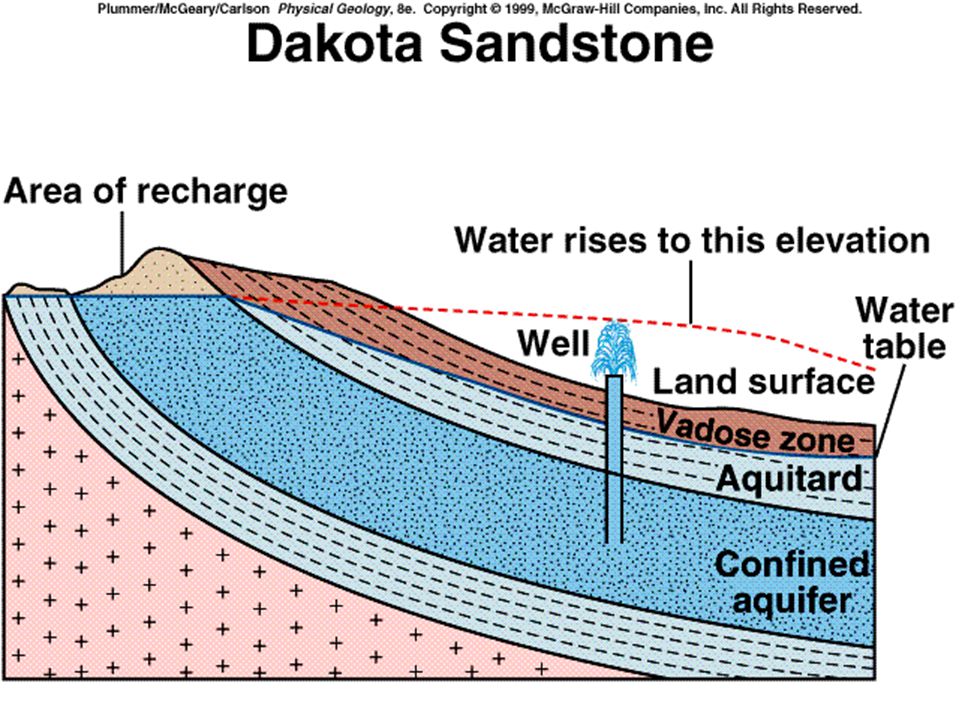
Groundwater What happens to precipitation once it reaches the ground –infiltration –percolation Water filling pore space, cracks & crevices in rocks- Porosity Aquifer- Geologic unit that can store, transmit and yield appreciable amounts of water

8
Porosity and Permeability Porosity – % of rock or sediment that is open (void spaces) – ability to hold water Permeability- ability to transmit water
 – ability to hold water Permeability- ability to transmit water")
10
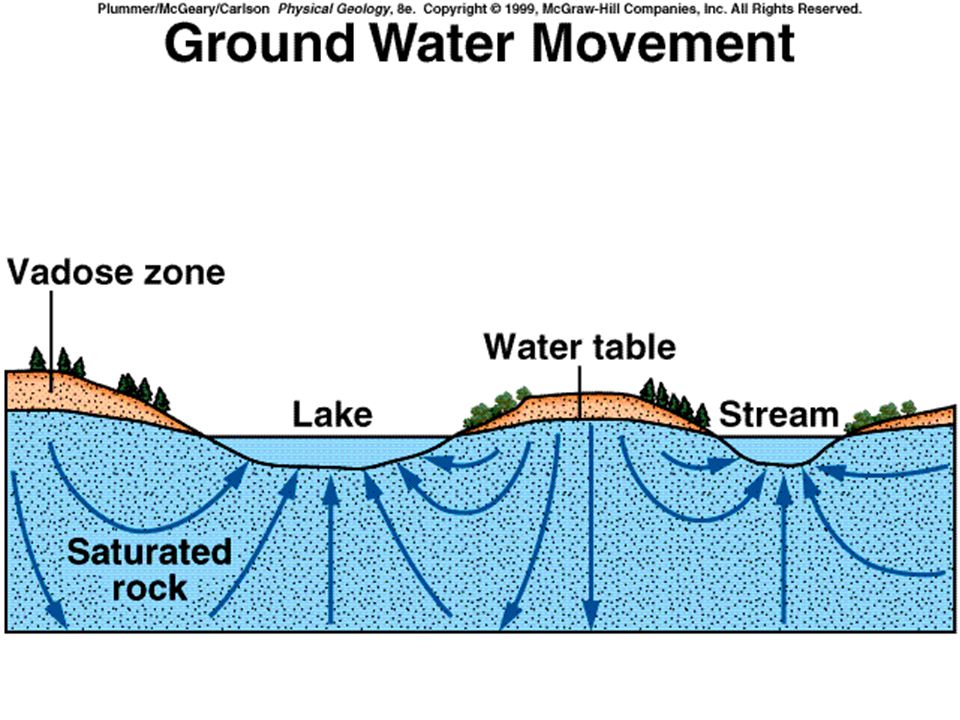
Movement of ground water Moves in response to differences in water pressure & elevation Velocity influenced by – Slope of water table – Permeability

14
Groundwater Movement Darcy’s Law –Q= KA (h 1 -h 2 )/(l) –Where Q is discharge; A= BxW –K is hydraulic conductivity –(h 1 -h 2 )/(l) is hydraulic gradient
/(l) –Where Q is discharge; A= BxW –K is hydraulic conductivity –(h 1 -h 2 )/(l) is hydraulic gradient")
15
Cone of Depression

16
After pumping in a well stops, the water level slowly recovers its previous level and the cone of depression disappears

21
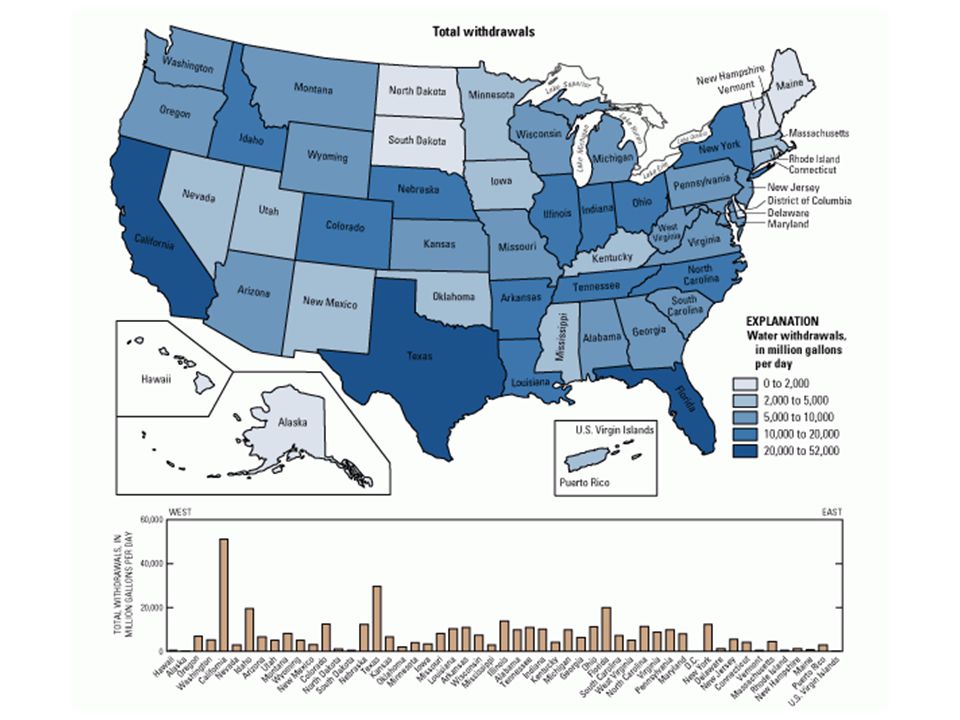
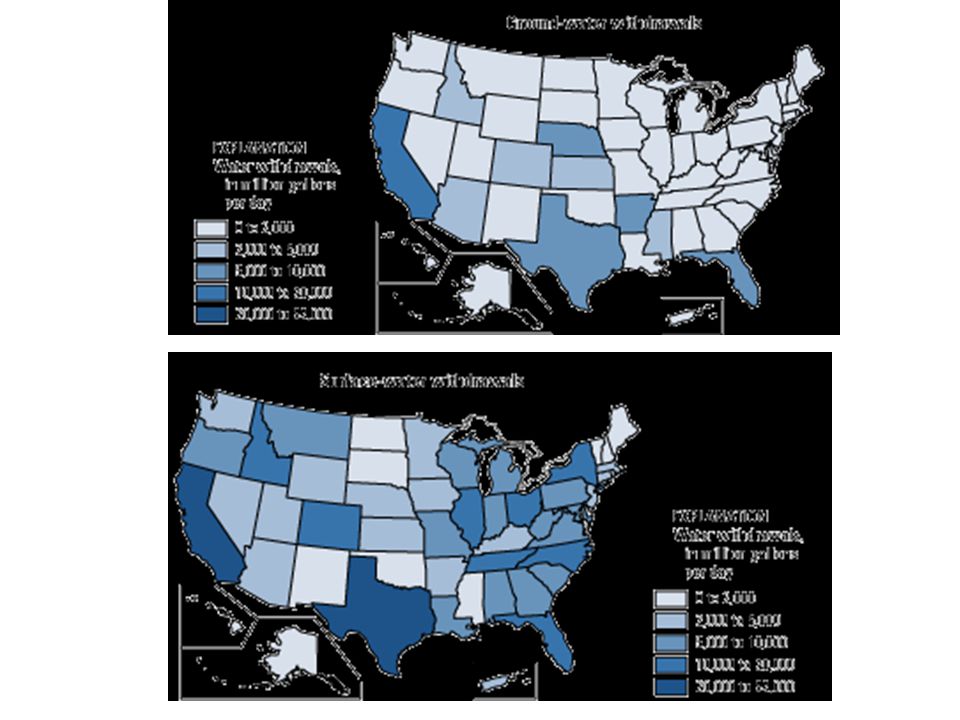
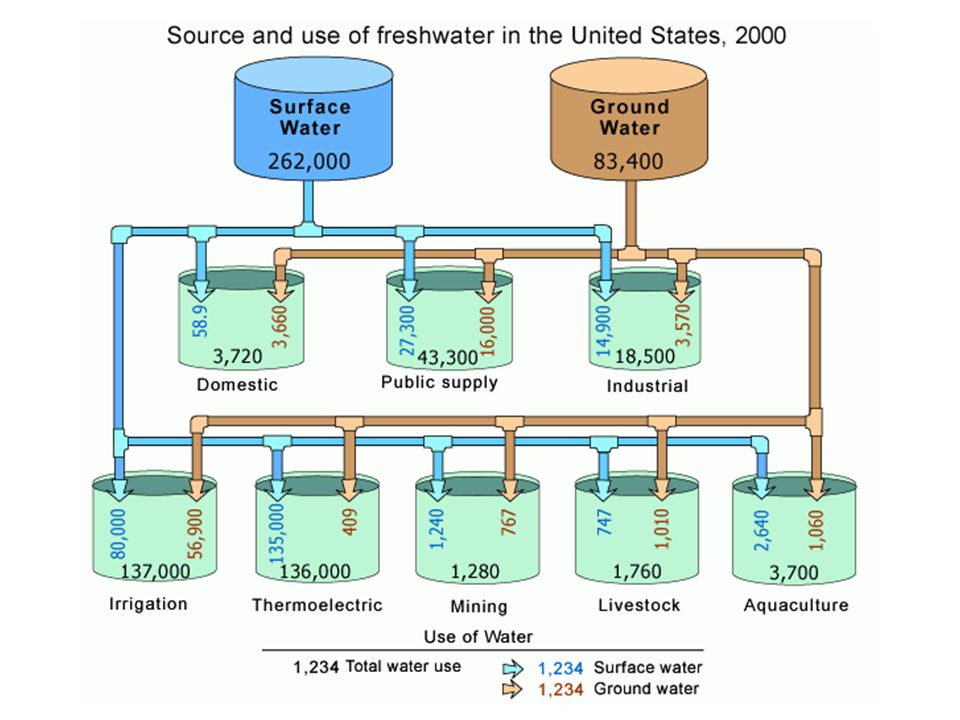
Water Use: Trends in population and freshwater withdrawals by source, 1950-2000.

22
Trends in total water withdrawals by water-use category, 1950-2000

23
Water Pollution

24
Degradation of water quality –Biological –Chemical –Physical –Based on the intended use of the water Attainment vs. non-attainment

25
Clean Water Act Sec.304(a)(1) : The Administrator, after consultation with appropriate Federal and State agencies and other interested persons, shall develop and publish, within one year after the date of enactment of this title (and from time to time thereafter revise) criteria for water quality accurately reflecting the latest scientific knowledge (A) on the kind and extent of all identifiable effects on health and welfare including, but not limited to, plankton, fish, shellfish, wildlife, plant life, shorelines, beaches, esthetics, and recreation which may be expected from the presence of pollutants in any body of water, including ground water; (B) on the concentration and dispersal of pollutants, or their byproducts, through biological, physical, and chemical processes; and (C) on the effects of pollutants on biological community diversity, productivity, and stability, including information on the factors affecting rates of eutrophication and rates of organic and inorganic sedimentation for varying types of receiving waters.
(1) : The Administrator, after consultation with appropriate Federal and State agencies and other interested persons, shall develop and publish, within one year after the date of enactment of this title (and from time to time thereafter revise) criteria for water quality accurately reflecting the latest scientific knowledge (A) on the kind and extent of all identifiable effects on health and welfare including, but not limited to, plankton, fish, shellfish, wildlife, plant life, shorelines, beaches, esthetics, and recreation which may be expected from the presence of pollutants in any body of water, including ground water; (B) on the concentration and dispersal of pollutants, or their byproducts, through biological, physical, and chemical processes; and (C) on the effects of pollutants on biological community diversity, productivity, and stability, including information on the factors affecting rates of eutrophication and rates of organic and inorganic sedimentation for varying types of receiving waters.")
26
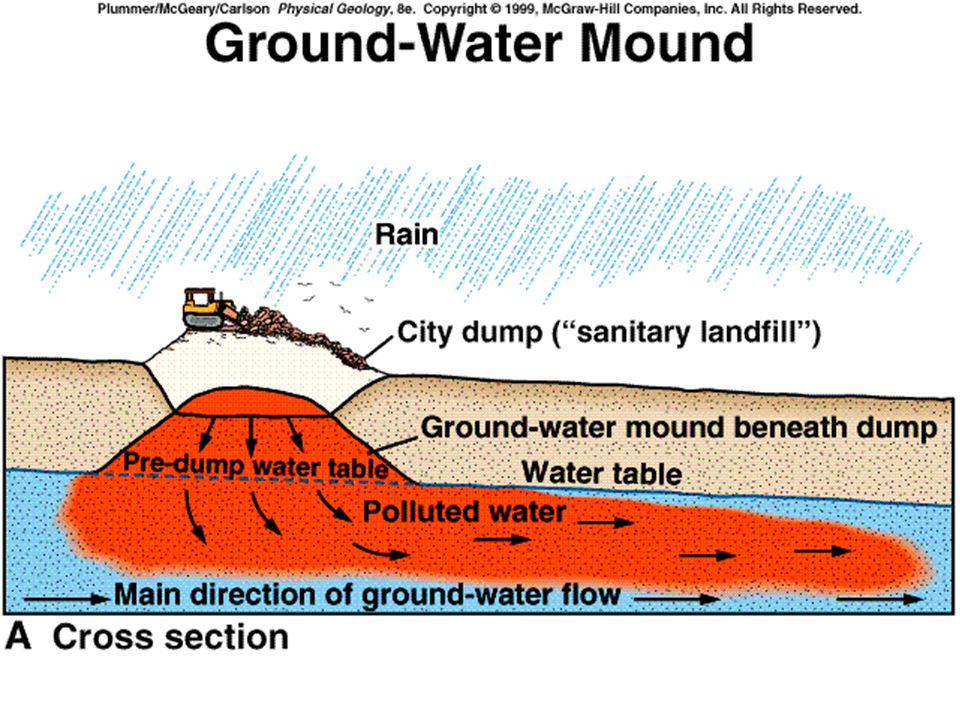
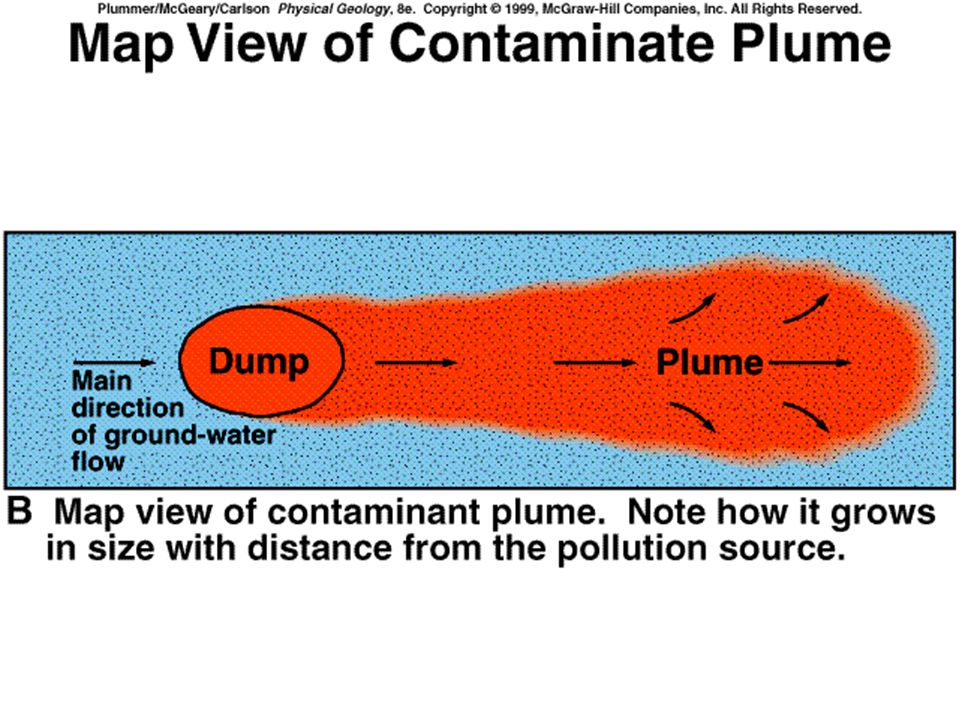
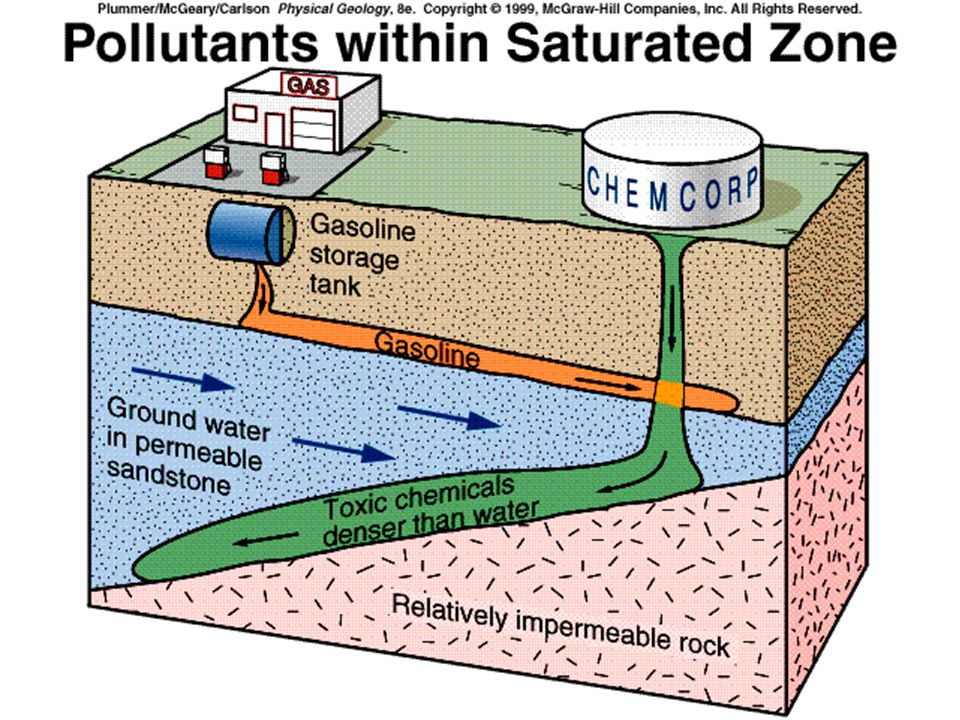
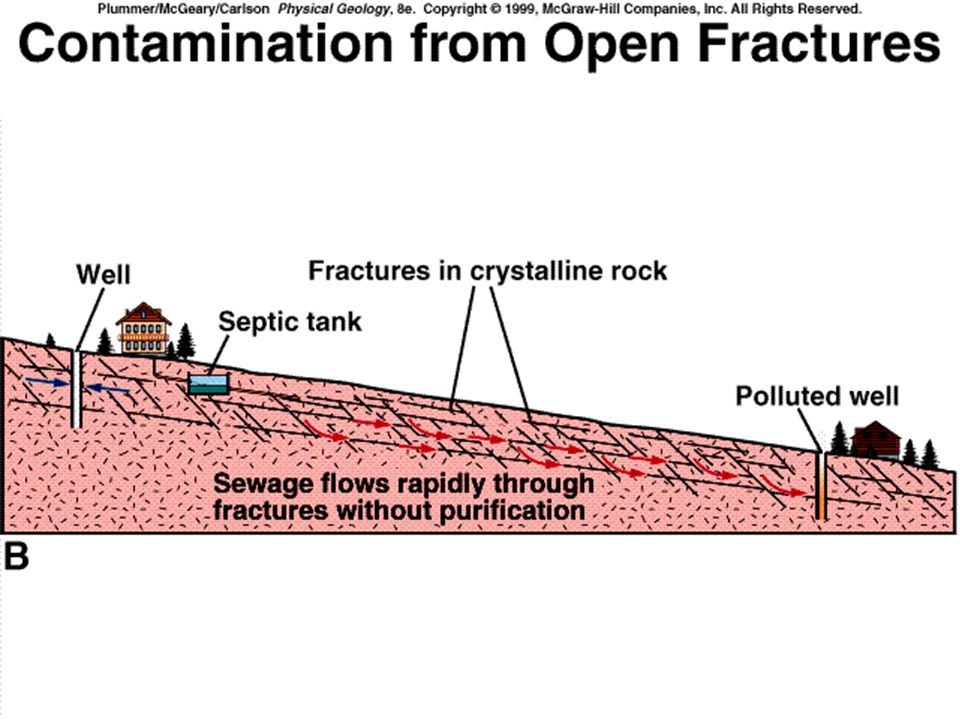
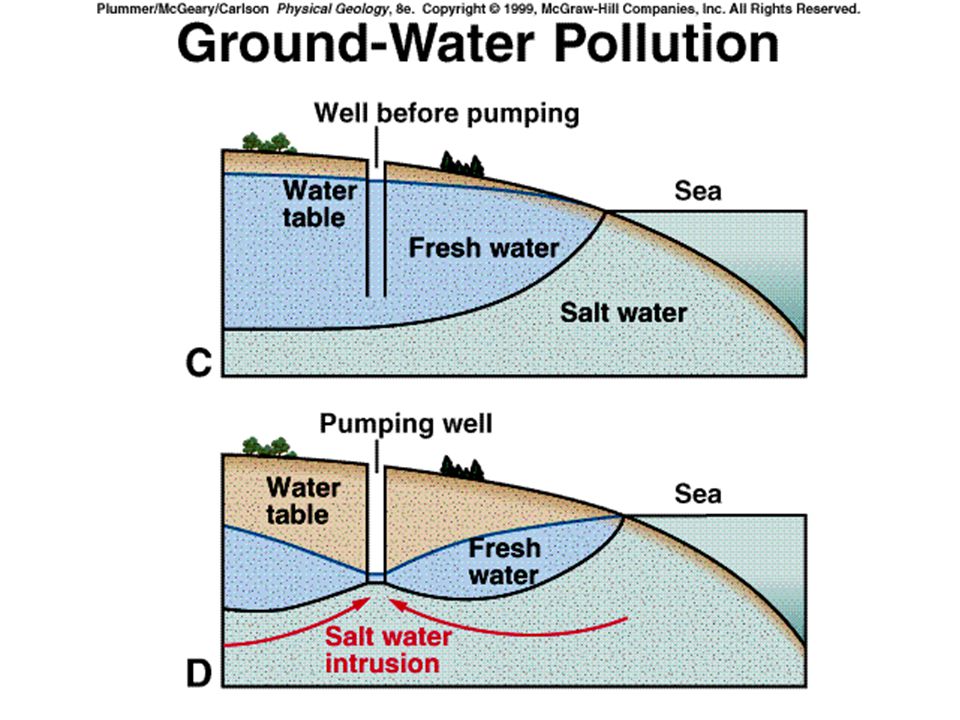
Common Sources of Groundwater Pollution/Contamination Leaks from storage tanks and pipes Leaks from waste disposal sites (landfills) Seepage from septic systems Accidental spills Agricultural activities Intrusion of salt water Mine spoils and tailings Irrigation Injection wells Acid mine drainage Runoff- urban, industrial, agricultural
 Seepage from septic systems Accidental spills Agricultural activities Intrusion of salt water Mine spoils and tailings Irrigation Injection wells Acid mine drainage Runoff- urban, industrial, agricultural")
27
Water Pollutants Biological Oxygen Demand Pathogenic Organisms Nutrients Oil Chemicals Heavy Metals Radioactive materials Sediments Thermal Pollution

34
Pollution and Environmental Health World Health Organization(WHO); World Resources Institute(WRI); United States Environmental Protection Agency (USEPA); United States Geological Survey(USGS); Botkin & Keller
; World Resources Institute(WRI); United States Environmental Protection Agency (USEPA); United States Geological Survey(USGS); Botkin & Keller")
35
Contamination, Pollution and Toxicity Any material that is above background level in the environment (introduced) Any material that is above background level in the environment and that causes a deleterious effect on humans and ecosystems
 Any material that is above background level in the environment and that causes a deleterious effect on humans and ecosystems")
36
Units of Measurement Depending on whether it is found in water, soil or air Reported as percent (%), ppm, ppb, ppt (parts per million, billion or trillion) –0.01% = 100ppm = mg/kg or mg/L –Milligram (mg) (1/1,000 g) –Microgram ( g) (1/1,000,000g) Reported as either volume, mass or weight
, ppm, ppb, ppt (parts per million, billion or trillion) –0.01% = 100ppm = mg/kg or mg/L –Milligram (mg) (1/1,000 g) –Microgram ( g) (1/1,000,000g) Reported as either volume, mass or weight")
37
There are two very distinct question sets Will a given material harm the environment? Will a given material harm us?

38
Factors Influencing Toxicity Additive 2 + 2 = 4 Synergistic 2 + 2 = 10 Antagonism 2 +2 = 0

39
Spectrum of Toxic Dose AgentLD50 (mg/kg) Ethanol10,000 NaCl4,000 Ferrous Sulfate1,500 DDT100 Strychnine sulfate2 Nicotine1 Tetrodotoxin0.1 Dioxin (TCDD)0.001 Botulinus0.00001
 Ethanol10,000 NaCl4,000 Ferrous Sulfate1,500 DDT100 Strychnine sulfate2 Nicotine1 Tetrodotoxin0.1 Dioxin (TCDD)0.001 Botulinus")
40
What determines the impact of Exposure? Length of, period of, time Concentration - dose Recurrence – is contact repeated Frequency of recurrence – daily/yearly Life cycle sensitivity differences - infant/adult Physical condition of victim – robust/sickly Presence of other hazards - synergism

41
Point vs. Non-Point Sources As authorized by the Clean Water Act, the National Pollutant Discharge Elimination System (NPDES) permit program controls water pollution by regulating point sources that discharge pollutants into waters of the United States Point sources are discrete conveyances such as pipes or man-made ditches Industrial, municipal, and other facilities must obtain permits if their discharges go directly to surface waters In most cases, the NPDES permit program is administered by authorized states
 permit program controls water pollution by regulating point sources that discharge pollutants into waters of the United States Point sources are discrete conveyances such as pipes or man-made ditches Industrial, municipal, and other facilities must obtain permits if their discharges go directly to surface waters In most cases, the NPDES permit program is administered by authorized states.")
42
Point vs. Non-Point Sources Non-point source (NPS) pollution, unlike pollution from industrial and sewage treatment plants, comes from many diffuse sources NPS pollution is caused by rainfall or snowmelt moving over and through the ground As the runoff moves, it picks up and carries away natural and human-made pollutants, finally depositing them into lakes, rivers, wetlands, coastal waters, and groundwater
 pollution, unlike pollution from industrial and sewage treatment plants, comes from many diffuse sources NPS pollution is caused by rainfall or snowmelt moving over and through the ground As the runoff moves, it picks up and carries away natural and human-made pollutants, finally depositing them into lakes, rivers, wetlands, coastal waters, and groundwater.")
43
Non-Point Source Pollutants Excess fertilizers, herbicides, and insecticides from agricultural lands and residential areas Oil, grease, and toxic chemicals from urban runoff and energy production Sediment from improperly managed construction sites, crop and forest lands, and eroding streambanks Salt from irrigation practices and acid drainage from abandoned mines Bacteria and nutrients from livestock, pet wastes, and faulty septic systems Atmospheric deposition are also sources of non- point source pollution

44
Federal Water Legislation Refuse Act 1899 Federal Water and Pollution Control Act 1956 Fish and Wildlife Coordination Act 1958 National Environmental Policy Act 1969 Water Quality Improvement Act 1970 Federal Water Pollution Control Act (Clean Water Act) 1972
 1972")
45
Water Quality Standards Under §303(c) of the Clean Water Act a water quality standard is described as comprising: (1) the designated beneficial uses (aquatic life, wildlife, recreation, fishing, agriculture, water supply, etc.) of a water body and (2) the criteria (numeric and narrative) necessary to protect these uses. States and Tribes are required by CWA §303(c)(2)(B) to adopt criteria for CWA §307(a) toxic pollutants for which EPA has published CWA §304(a) criteria, and/or recommendations and methodology based on the latest science.
(2)(B) to adopt criteria for CWA §307(a) toxic pollutants for which EPA has published CWA §304(a) criteria, and/or recommendations and methodology based on the latest science..")
46
Federal Water Legislation Comprehensive Environmental Response, Compensation and Liability Act (CERCLA) 1980 Hazardous and Solid Waste Amendments to the Resource Conservation and Recovery Act (RCRA) 1984 Water Quality Act 1987 Safe Drinking Water Act 1996
 1980 Hazardous and Solid Waste Amendments to the Resource Conservation and Recovery Act (RCRA) 1984 Water Quality Act 1987 Safe Drinking Water Act 1996")
47
Water Quality Standards Maximum Contaminant Level- MCLs –Based on toxicity –Usually lethal dose (LD 50 ) for some target organism or toxic dose (TD 50 ) Maximum Contaminant Level Goal- MCLGs
 for some target organism or toxic dose (TD 50 ) Maximum Contaminant Level Goal- MCLGs")
48
Primary Drinking Water Standards ContaminantMCL (mg/L)Problems Arsenic0.05Highly toxic Lead0.015Highly toxic Mercury0.002Kidney, Nervous System Fluoride4Skeletal Damage Asbestos 7 million fibers/L >10 m Benign Tumors Lindane0.004Kidney, Nervous System, Liver 2,4D0.07Kidney, Nervous System, Liver Benzene0.005Cancer Trichloroethylene0.005Probable Cancer Vinyl Chloride0.002Cancer risk Fecal Coliform1 cell/100mlPathogen
Problems Arsenic0.05Highly toxic Lead0.015Highly toxic Mercury0.002Kidney, Nervous System Fluoride4Skeletal Damage Asbestos 7 million fibers/L >10 m Benign Tumors Lindane0.004Kidney, Nervous System, Liver 2,4D0.07Kidney, Nervous System, Liver Benzene0.005Cancer Trichloroethylene0.005Probable Cancer Vinyl Chloride0.002Cancer risk Fecal Coliform1 cell/100mlPathogen")
49
Categories of Pollutants Biological- Infectious Agents Heavy Metals Organic compounds Particulates Radiation Thermal

50
Biological Hazards Of all the environmental hazards humans encounter, the most formidable adversaries remain the microorganisms -- viruses, bacteria, protozoa, and parasitic worms Up to 17 million deaths per year are attributable to these infectious and parasitic agents, almost all in the developing world, along with hundreds of millions of cases of illnesses

51
Why consider infectious diseases "environmental" in origin? Cholera and other diarrheal diseases are associated with inadequate access to clean water and sanitation and poor hygiene Diarrhea is spread by both bacteria and viruses through contaminated food or water, and these disease-causing agents represent one of the most widespread health problems in the world Diarrhea killed roughly 2.5 million people in 1996, according to World Health Organization, most of whom were children under age 5

52
Inadequate Water Supplies Creates conditions rife for transmitting diarrhea An estimated 2.9 billion people lack access to adequate sanitation Roughly 1.4 billion people do not have access to safe drinking water This situation has persisted despite investments of more than US$100 billion during the International Water and Sanitation Decade

53
Infectious Agents In 1993, the United States experienced the largest outbreak of diarrhea in recent history Affecting more than 400,000 people The municipal water supply of Milwaukee, Wisconsin, was contaminated by Cryptosporidium parvum from farm animal wastes This protozoan parasite has been wreaking havoc in countries across Europe as well, raising new concerns about the safety of drinking water in some of the world's most affluent countries.

54
Chemical Hazards in the Environment Exposure to chemical agents in the environment -- in air, water, food, and soil -- has been implicated in numerous adverse effects, from cancer to lung disease to brain damage to birth defects Some evidence is ironclad; some is suggestive at best

55
Heavy Metals Metals with high atomic mass Arsenic, Cadmium, Chromium, Lead, Mercury, Nickel, Platinum, Selenium, Silver, Vanadium (others) Used in industrial processes and by- products of mining, smelting, fossil fuel burning, etc. Can have direct physiological effect or can Concentrate in fatty tissue (bioaccumulation)
.")
56
Ducktown, TN- Burra Burra Mine Copper mining and smelting in the Copper Basin of the SE US

57
Mercury Mercury has been well known as an environmental pollutant for several decades As early as the 1950’s it was established that emissions of mercury to the environment could have serious effects on human health Inorganic mercury (Hg 2+ ) will undergo bacterial activity and be converted to the more toxic methyl mercury ([CH 3 Hg] + ) Early studies demonstrated that fish and other wildlife from various ecosystems commonly attain mercury levels of toxicological concern when directly affected by mercury- containing emissions from human-related activities Human health concerns arise when fish and wildlife from these ecosystems are consumed by humans (Minamata, Japan)
![Mercury Mercury has been well known as an environmental pollutant for several decades As early as the 1950’s it was established that emissions of mercury to the environment could have serious effects on human health Inorganic mercury (Hg 2+ ) will undergo bacterial activity and be converted to the more toxic methyl mercury ([CH 3 Hg] + ) Early studies demonstrated that fish and other wildlife from various ecosystems commonly attain mercury levels of toxicological concern when directly affected by mercury- containing emissions from human-related activities Human health concerns arise when fish and wildlife from these ecosystems are consumed by humans (Minamata, Japan)](http://images.slideplayer.com/15/4741832/slides/slide_57.jpg "Mercury Mercury has been well known as an environmental pollutant for several decades As early as the 1950’s it was established that emissions of mercury to the environment could have serious effects on human health Inorganic mercury (Hg 2+ ) will undergo bacterial activity and be converted to the more toxic methyl mercury ([CH 3 Hg] + ) Early studies demonstrated that fish and other wildlife from various ecosystems commonly attain mercury levels of toxicological concern when directly affected by mercury- containing emissions from human-related activities Human health concerns arise when fish and wildlife from these ecosystems are consumed by humans (Minamata, Japan)")
58
In the U.S. widespread mercury contamination in streams, wet-lands, reservoirs, and lakes To date, 33 states have issued fish consumption advisories because of mercury contamination These continental to global scale occurrences of mercury contamination cannot be linked to individual emissions of mercury, but instead are due to widespread air pollution When scientists measure mercury levels in air and surface water, however, the observed levels are extraordinarily low

59
Why do fish from some remote areas have elevated mercury concentrations, when contamination levels in the environment are so low? Mercury biomagnifies from the bottom to the top of the food chain Even at very low input rates to aquatic ecosystems that are remote from point sources, biomagnification effects can result in mercury levels of toxicological concern The bioaccumulation effect is generally compounded the longer an organism lives, so that larger predatory game fish will likely have the highest mercury levels Adding to this problem is the fact that mercury concentrates in the muscle tissue of fish Unlike organic contaminants (PCBs and dioxins) which concentrate in the skin and fat, mercury cannot be filleted or cooked out of consumable game fish
 which concentrate in the skin and fat, mercury cannot be filleted or cooked out of consumable game fish.")
60
Synthetic Organic Chemicals Carbon based molecular structure Often contain reactive chlorine Manufactured as pesticides, herbicides, insecticides or as insulator oil (PCB) 20 million produced and about 100,000 produced commercially Persistent in the environment Soluble in fat and accumulate in tissue
 20 million produced and about 100,000 produced commercially Persistent in the environment Soluble in fat and accumulate in tissue")
61
Synthetic Organic Chemicals "Over increasingly large areas of the United States spring now comes unheralded by the return of birds, and the early mornings are strangely silent where once they were filled with the beauty of bird song.“ Rachael Carson, Silent Spring 1962

62
DDT Dichloro- diphenyltrichloroethane World Health Organization credits DDT with reducing disease 1945-1960, used to control agricultural pests as well as disease-carrying insects (Malaria) –Venezuela 1943 -8,171,115 cases 1958 –800 cases –Taiwan 1945- 1,000,000 cases 1969- 9 cases Jones Beach on Long Island, NY
 –Venezuela ,171,115 cases 1958 –800 cases –Taiwan ,000,000 cases cases Jones Beach on Long Island, NY")
63
Cancer Cancers may take 10 to 40 years to develop, and many factors may contribute to the appearance of the disease in a particular person Accordingly, chemical risks tend to be described in terms of the numbers of people exposed -- for instance, 1.4 billion urban dwellers exposed to air quality that exceeds health guidelines, as WHO estimates

64
Thermal Pollution Release of heat into atmosphere or water ways –Acute (i.e. fires from agricultural burning) –Chronic (i.e. hot water releases from electric power plants) Change biological and physico-chemical composition of streams
 –Chronic (i.e. hot water releases from electric power plants) Change biological and physico-chemical composition of streams.")
65
Toxicity Testing Despite widespread public concern over chemical safety, toxicity testing remains inadequate For the vast majority of chemicals in widespread use, no toxicity testing results are available in the public record

66
Hazards Of the other potential effects of chemical hazards, such as infertility, birth defects, immune system impairment, or brain damage, even less is known. In the United States, for instance, the chief agency for chemical evaluation spent nearly US$29 million on testing chemicals for cancer in 1991, but just about $6 million for both genetic and reproductive effects Testing for other health concerns, such as immune system effects or endocrine disruption, lags even further behind United States provides an apt example: according to a recent study, 86 percent of chemicals in widespread use have not been tested for immunotoxicity, and 67 percent have not been tested for neurotoxicity This focus on cancer means that other important and preventable risks may be overlooked

68
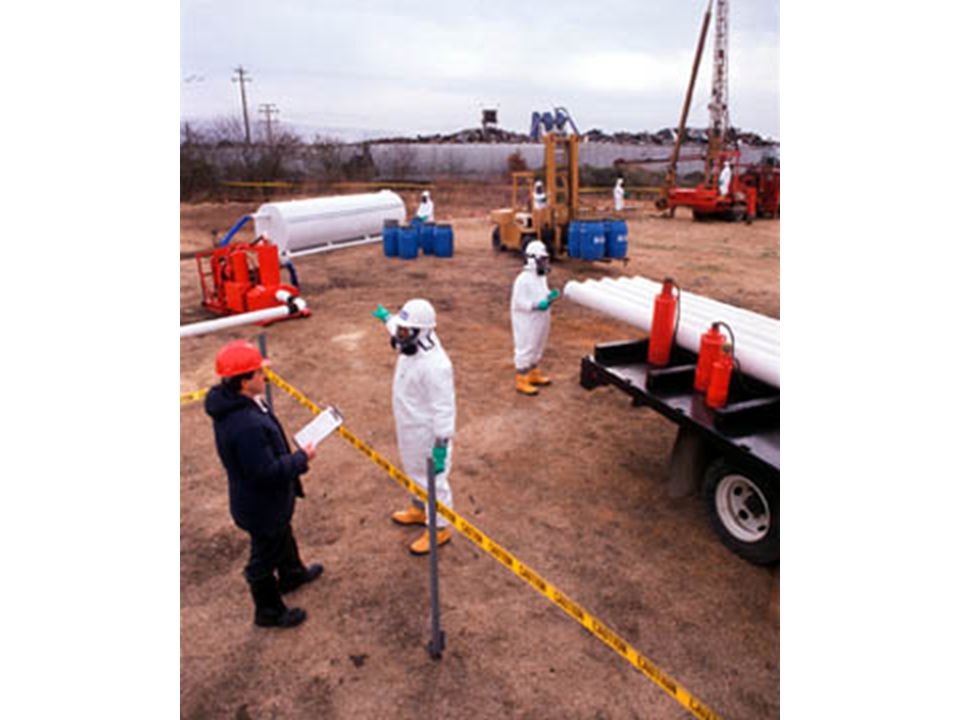
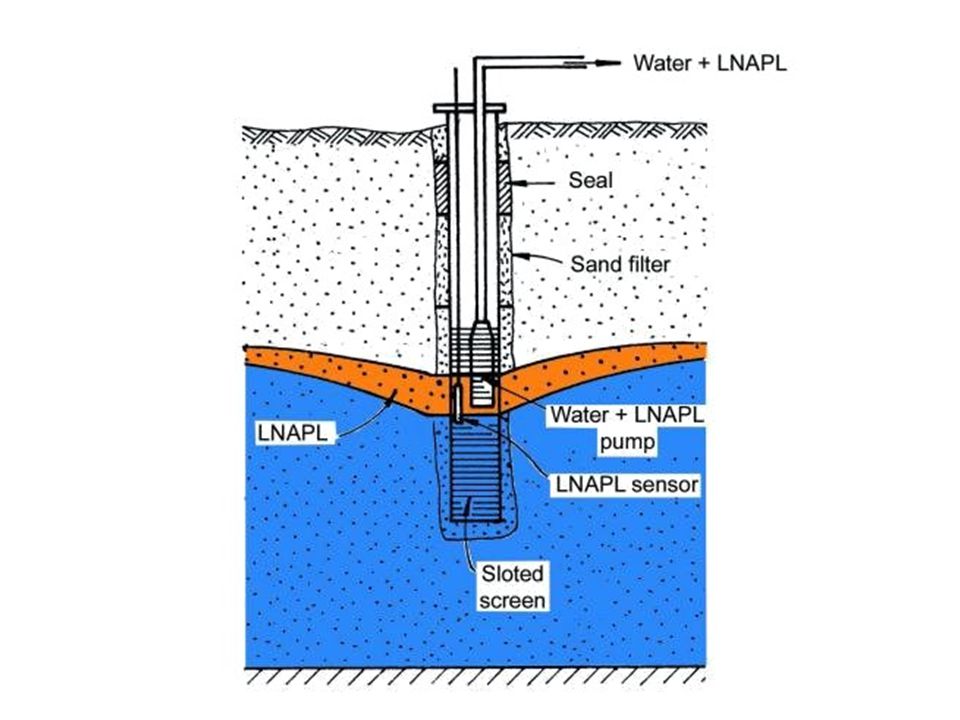
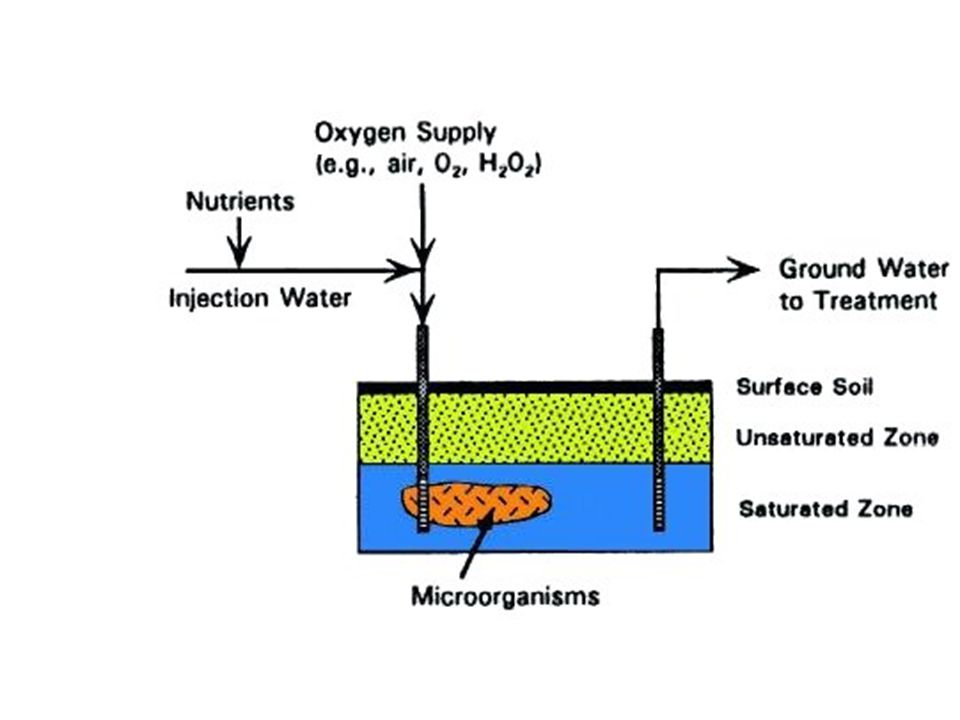
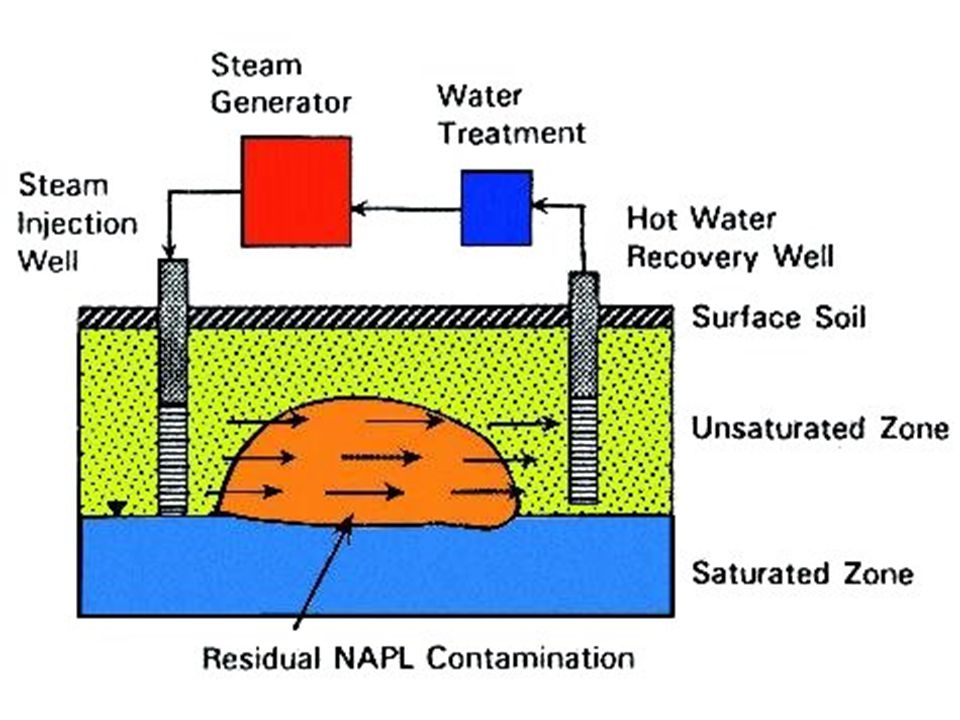
Remediation of Groundwater Extraction Wells –“Pump and Treat” by filtration, oxidation or air stripping Vapor Extraction Bioremediation –Injection of nutrients and oxygen to encourage microorganism growth Permeable Treatment Beds

71
CHEMICAL TREATMENT

73
Other Methods of Remediation Natural attenuation. –Natural attenuation defines the natural occurring processes in the subsurface environment such as dilution, volatilization, biodegradation, adsorption and chemical reactions with subsurface compounds that contain the spread of pollution and reduce the concentration and amount of pollutants at polluted sites.

Similar presentations