Download presentation
Presentation is loading. Please wait.

1
Water Policy in the US and the EU K H Reckhow and C Pahl-Wostl Part I: US Total Maximum Daily Load Program

2
20,000 waterbodies across America not meeting Clean Water Act goals established by States These waterbodies represent ~ 40% of those assessed, including : –Over 300,000 river & shore miles –5 million lake acres Approx. 36,000 TMDLs needed in 8 - 13 years The Extent of the Impaired Waters Problem

3
Framework for Restoring Impaired Waters Nonpoint Sources: Manage via partnerships, grants, voluntary programs Point Sources: Control via NPDES Permits TMDL: Determine maximum load and allocate load reductions among PS, NPS 303(d) List of Impaired Waters Monitoring and Assessment Water Quality Standards: Designated Use, Criteria, Anti-deg.
 List of Impaired Waters Monitoring and Assessment Water Quality Standards: Designated Use, Criteria, Anti-deg.")
4
Current Regulations Components of a TMDL –Sum of allowable loads to meet State water quality standards Wasteload allocations from point sources Load allocations from nonpoint sources and natural background –Margin of safety (MOS)
")
5
ASSESSING THE TMDL APPROACH TO WATER QUALITY MANAGEMENT Committee to Assess the Scientific Basis of the Total Maximum Daily Load Approach to Water Pollution Reduction Water Science and Technology Board Division on Earth and Life Studies National Research Council National Academy Press Washington, D.C. 2001

7
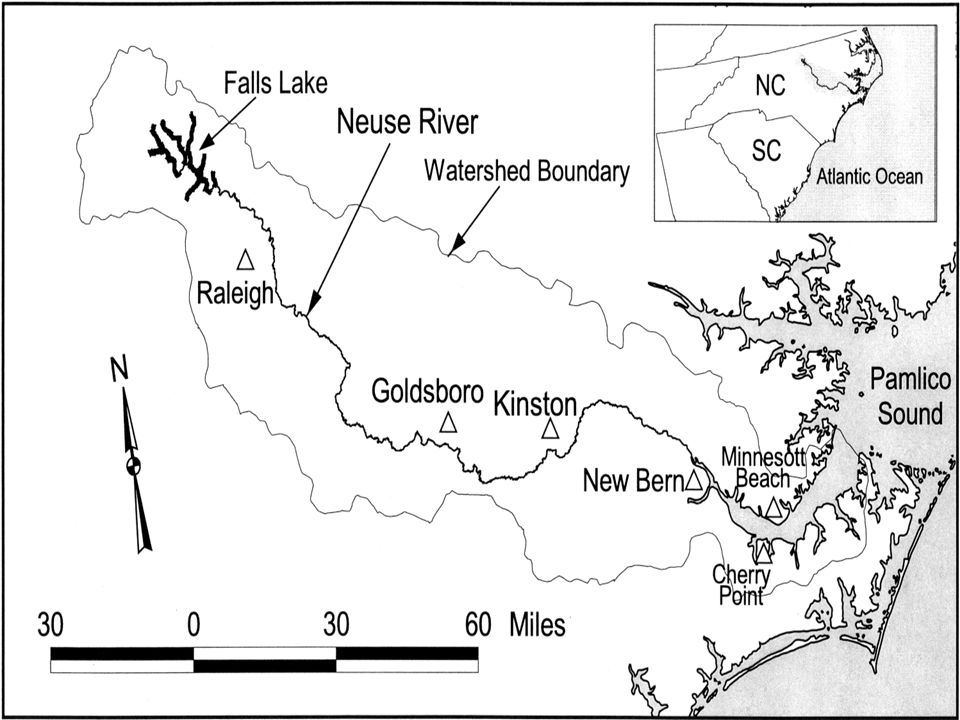
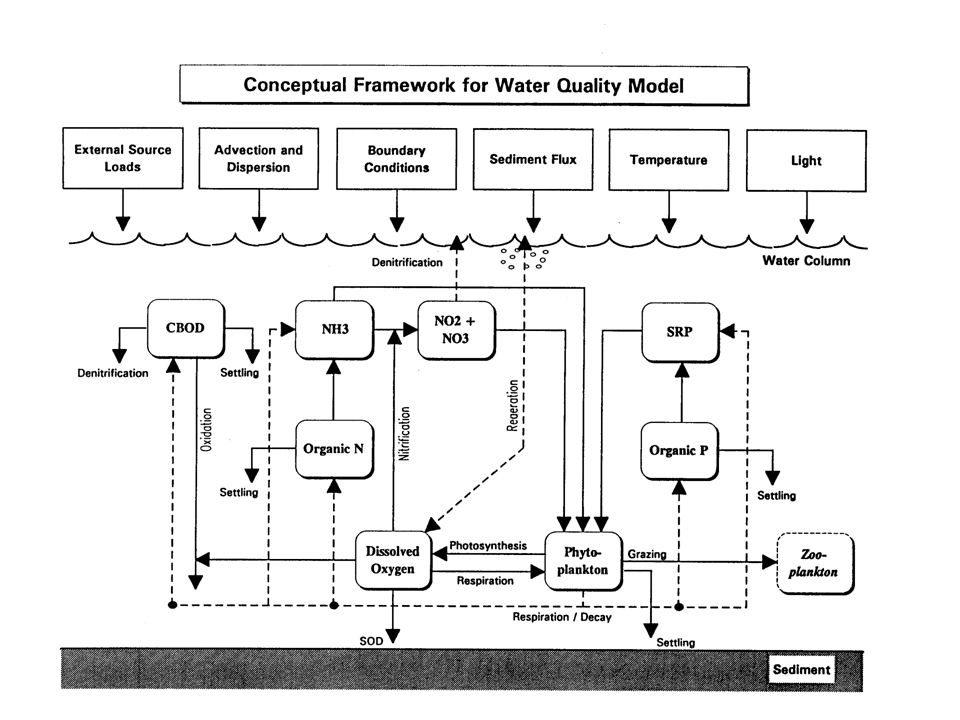
Neuse Estuary Eutrophication Model

10
Nitrogen Inputs Cause and Effect Relationships Cause and Effect Relationships Frequency of Hypoxia Duration of Stratification Harmful Algal Blooms Carbon Production Sediment Oxygen Demand River Flow Algal Density Chlorophyll Violations Number of Fishkills Fish Health Shellfish Abundance NeuBERN Bayes Net Estuary Model

11
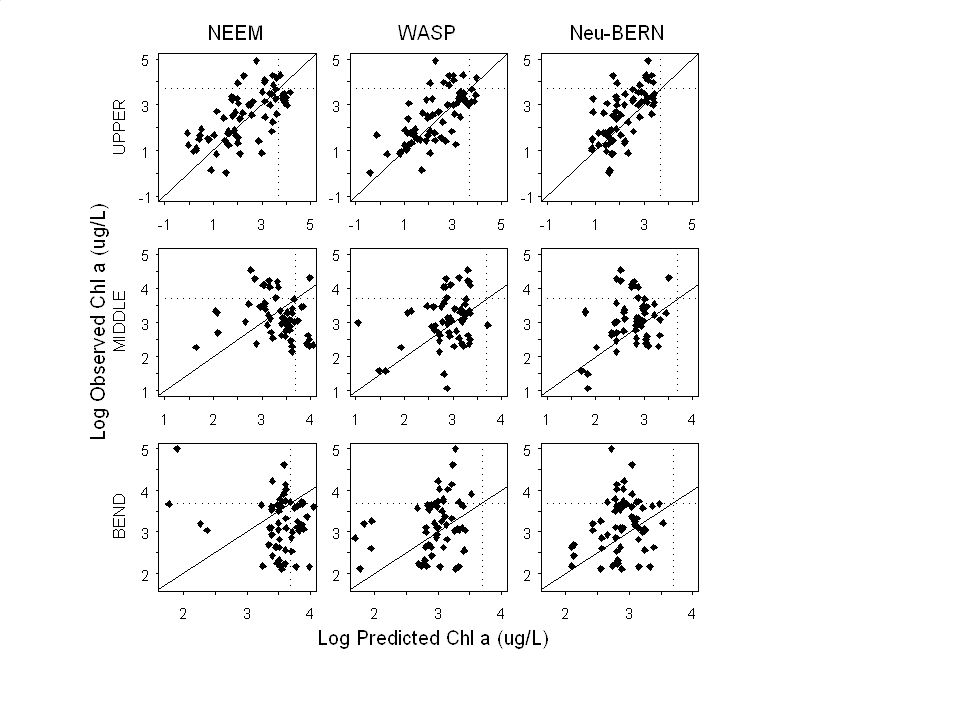
Water Quality (TMDL) Forecasting The problem with water quality forecasting is that we’re not terribly good at it. Result: Prediction uncertainty is high

13
Model development is likely to proceed along the conventional lines: Advances in process models will likely lead to increasingly elaborate mechanistic descriptions, with improvements expected. More/better observational data, and advances in statistical techniques, will likely lead to gains in empirical model forecast accuracy. However, it is hard to believe that either of these will result in dramatic improvements (perhaps mechanistic/statistical hybrid models have more promise).
..")
14
So, we need to consider another approach - using implemented actions on the real system as learning experiments to augment/improve model forecasts. Adaptive Implementation We can “learn while doing;” that is, we can observe how the real system (the actual waterbody) responds, and then use that information to augment and improve the prediction for the modeled system.
 responds, and then use that information to augment and improve the prediction for the modeled system..")
15
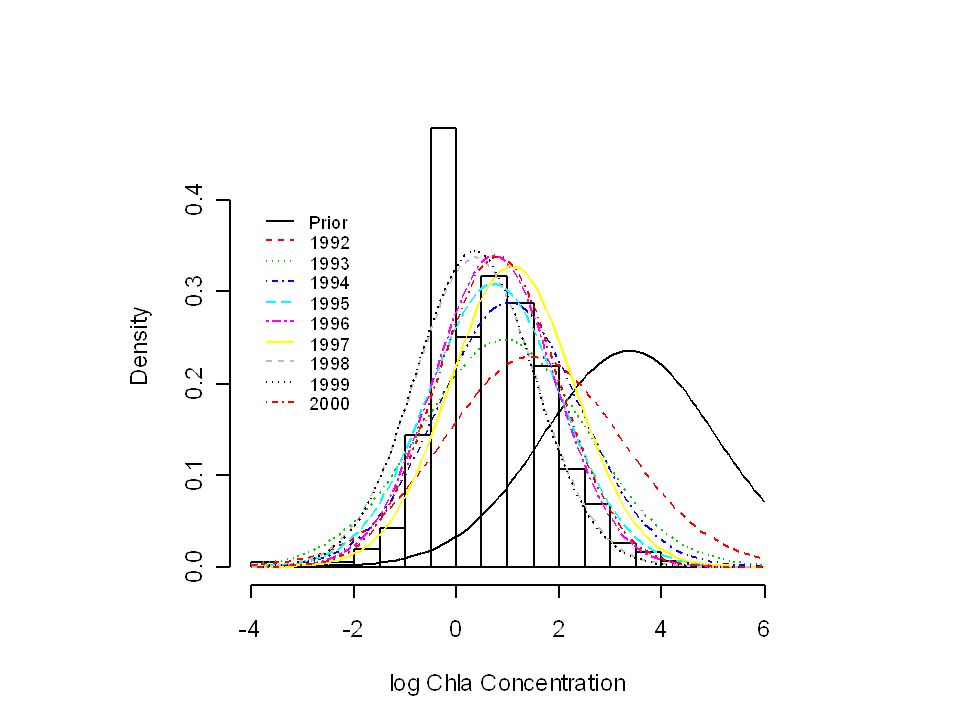
Prior (model forecast) Sample (monitoring Data) Posterior (integrating modeling and monitoring) Adaptive Implementation: Bayesian Analysis Water Quality Criterion Concentration
 Sample (monitoring Data) Posterior (integrating modeling and monitoring) Adaptive Implementation: Bayesian Analysis Water Quality Criterion Concentration")
16
Example: TN in Neuse Estuary Prior distribution of log TN concentration assessed from the Bayesian SPARROW model TN monitoring data collected from 1992 – 2000 The log TN distribution is updated using one year’s data at a time to illustrate sequential updating.

17
Sequential Updating Repeated use of Bayes theorem Current posterior becomes prior when new data are available.

20
Post (TMDL) Implementation Questions Has compliance with the water quality standard been achieved? If compliance has not been achieved, what pollutant reduction actions did not respond as predicted?

Similar presentations


 R. Olsen USEPA NHEERL Western Ecology Division.>")


 Plan Implementation by Jeff Spoelstra, Coordinator, Kalamazoo River Watershed Council.>")


