Download presentation
Presentation is loading. Please wait.

1
Does the Love of Money Cause Pay Dissatisfaction? Thomas Li-Ping Tang Middle Tennessee State University, the USA Fernando Arias-Galicia Universidad Autonoma del Estado de Morelos, Mexico Ilya Garger Saratov State Social-Economic University, Russia Theresa Li-Na Tang Affinion Group, the USA The 26 th International Congress of Applied Psychology Athens, Greece, July 16-21, 2006

2
TOTO SUTARSO, Middle Tennessee State University, USA, ADEBOWALE AKANDE, International Institute of Research, South Africa, MICHAEL W. ALLEN, Griffith University, Australia, ABDULGAWI SALIM ALZUBAIDI, Sultan Qaboos University, Oman, MAHFOOZ A. ANSARI, University Science Malaysia, Malaysia, FERNANDO ARIAS-GALICIA, National University of Mexico, Mexico, MARK G. BORG, University of Malta, Malta, LUIGINA CANOVA, University of Padua,, Italy, BRIGITTE CHARLES-PAUVERS, University of Nantes, France, BOR-SHIUAN CHENG, National Taiwan University, Taiwan, RANDY K. CHIU, Hong Kong Baptist University, Hong Kong, IOANA CODOBAN, Babes-Bolyai University, Romania, LINZHI DU, Nanjing University, China, ILIA GARBER, Saratov State Social-Economic University, Russia, CONSUELO GARCIA DE LA TORRE, Technological Institute of Monterrey, Mexico, ROSARIO CORREIA HIGGS, Polytechnic Institute of Lisbon – Portugal, Portugal, CHIN-KANG JEN, National Sun-Yat-Sen University, Taiwan, ALI MAHDI KAZEM, Sultan Qaboos University, Oman, KILSUN KIM, Sogang University, South Korea,

3
VIVIEN KIM GEOK LIM, National University of Singapore, Singapore, ROBERTO LUNA-AROCAS, University of Valencia, Spain, EVA MALOVICS, University of Szeged, Hungary, ANNA MARIA MANGANELLI, University of Padua, Italy, ALICE S. MOREIRA, Federal University of Pará, Brazil, ANTHONY UGOCHUKWU O. NNEDUM, Nnamdi Azikiwe University, Nigeria, JOHNSTO E. OSAGIE, Florida A & M University, USA, FRANCISCO COSTA PEREIRA, Polytechnic Institute of Lisbon – Portugal, Portugal, RUJA PHOLSWARD, University of the Thai Chamber of Commerce, Thailand, HORIA D. PITARIU, Babes-Bolyai University, Romania, MARKO POLIC, University of Ljubljana, Slovenia, ELISAVETA SARDZOSKA, University St. Cyril and Methodius, Macedonia, ALLEN F. STEMBRIDGE, Southwestern Adventist University, USA, THERESA LI-NA TANG, Cendant Marketing Group, Brentwood, TN, USA, THOMPSON SIAN HIN TEO, National University of Singapore, Singapore, MARCO TOMBOLANI, University of Padua, Italy, MARTINA TRONTELJ, University of Ljubljana, Slovenia, CAROLINE URBAIN, University of Nantes, France, PETER VLERICK, Ghent University, Belgium

4
Outline The Meaning of Money The Love of Money Scale The Pay Level Satisfaction Scale Method Results Discussion, Implications, Limitations

5
Money The instrument of commerce and the measure of value (Smith, 1776/1937). Attract, retain, and motivate employees and achieve organizational goals (Chiu, Luk, & Tang, 2002; Milkovich & Newman, 2005; Tang, Kim, & Tang, 2000).
..")
6
The Meaning of Money is “in the eye of the beholder” (McClelland, 1967, p. 10) and can be used as the “frame of reference” (Tang, 1992) in which people examine their everyday lives (Tang & Chiu, 2003; Tang, Luna-Arocas, & Sutarso, 2005).
 and can be used as the frame of reference (Tang, 1992) in which people examine their everyday lives (Tang & Chiu, 2003; Tang, Luna-Arocas, & Sutarso, 2005)..")
7
The Importance of Money *10 Job Preferences, Pay was ranked: (Jurgensen, 1978) No. 5 by Men No. 7 by Women *11 work goals, Pay was ranked: (Harpaz, 1990). No. 1 in Germany No. 2 in Belgium, the UK, and the US
. No. 1 in Germany No. 2 in Belgium, the UK, and the US.")
8
The Importance of Money In Hong Kong and China, Most Chinese prefer cash among 35 components of compensation, The cash mentality (Chiu, Luk, & Tang, 2001).
.")
9
Why Do Students Go to College? In 1971, 49.9 % of freshman said: They want “to make more money”. In 1993, 75.1 % (The American Freshman, 1994).
..")
10
Major Cause of Dissatisfaction Among University Students The Lack of Money 1981-1987: No. 2 1990-1996: No. 3 1997-2003: No. 1 (Bryan, 2004).
..")
11
Pay Dissatisfaction Has “numerous undesirable consequences” (Heneman & Judge, 2000: 77): Turnover (Hom & Griffeth, 1995; Tang, Kim, & Tang, 2000), Counterproductive Behavior (Cohen-Charash, & Spector, 2001; Luna-Arocas & Tang, 2004), and Unethical Behavior (e.g., Chen & Tang, 2006; Tang & Chen, 2005; Tang & Chiu, 2003).
: Turnover (Hom & Griffeth, 1995; Tang, Kim, & Tang, 2000), Counterproductive Behavior (Cohen-Charash, & Spector, 2001; Luna-Arocas & Tang, 2004), and Unethical Behavior (e.g., Chen & Tang, 2006; Tang & Chen, 2005; Tang & Chiu, 2003).")
12
The Love of Money Pay Level Satisfaction Some Oldest References “Poverty consists, not in the decrease of one’s possessions, but in the increase of one’s greed” (Plato, 427- 347 BC).
.")
13
Some Oldest References “Whoever loves money never has money enough; whoever loves wealth is never satisfied with his income” (Ecclesiastes, 5: 10, New International Version). The Love of Money Pay Level Satisfaction

14
Some Oldest References “People who want to get rich fall into temptation and a trap and into many foolish and harmful desires that plunge men into ruin and destruction. For the love of money is a root of all kinds of evil” (Bible: 1 Timothy, 6: 9-10; Tang & Chiu, 2003). The Love of Money Scale
. The Love of Money Scale.")
15
The ABCs of Money Attitudes Affective: Do you “love or hate” money? Behavioral: What do you “do” with your money? Cognitive: What does money “mean” to you?

16
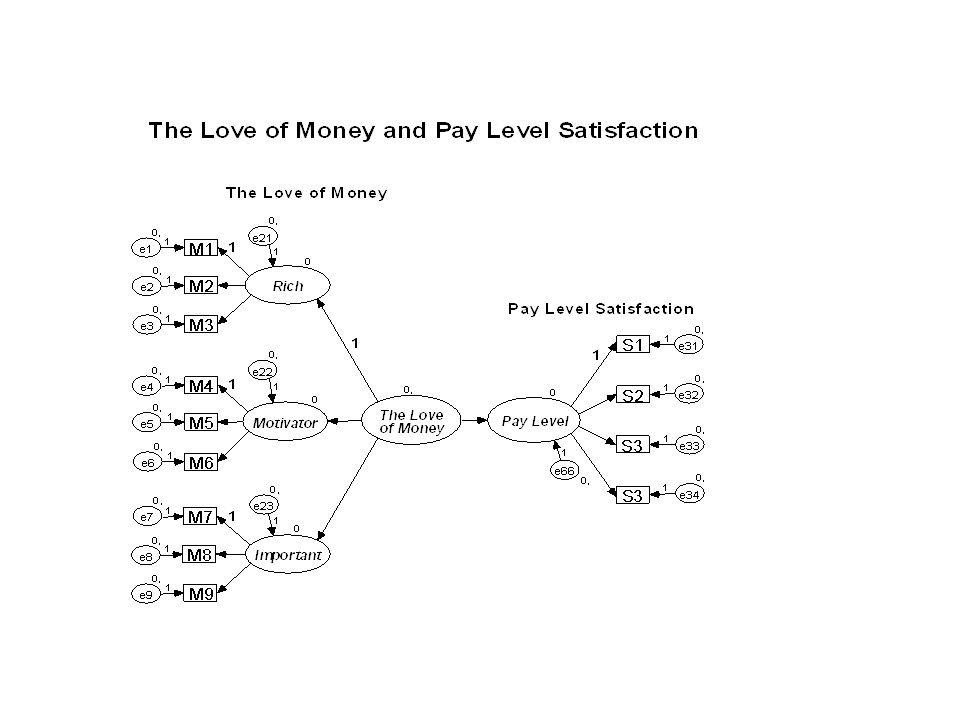
The Love of Money Factor Rich: I Want to be Rich. Factor Motivator: Money is a Motivator Factor Important: Money is important

17
Money Is a Motivator (+) 4 Methods: Improvement in Productivity Participation: 0% Job design: 9% Goal setting: 16% Contingent Pay: 30% “No other incentive or motivational technique comes even close to money” (Locke, Feren, McCaleb, Shaw, & Denny, 1980: 381) Money is a motivator (Stajkovic & Luthans, 2001). Money is NOT a motivator (Herzberg, 1987).
..")
18
The Love of Money Scale Factor 1: Rich (Affective) 1. I want to be rich. 2. It would be nice to be rich. 3. Having a lot of money (being rich) is good. Factor 2: Motivator (Behavior) 4. I am motivated to work hard for money. 5. Money reinforces me to work harder. 6. I am highly motivated by money. Factor 2: Importance (Cognitive) 7. Money is good. 8. Money is important. 9. Money is valuable.
 is good. Factor 2: Motivator (Behavior) 4. I am motivated to work hard for money. 5. Money reinforces me to work harder. 6. I am highly motivated by money. Factor 2: Importance (Cognitive) 7. Money is good. 8. Money is important. 9. Money is valuable..")
19
Pay Level Satisfaction The 18-item-4-factor Pay Satisfaction Questionnaire (PSQ, Heneman and Schwab, 1985) Pay, Bonus, Pay Raise, Administration One of the most well-known multidimensional measures of Pay Satisfaction (e.g., Williams, McDaniel, & Nguyen, 2006).
 Pay, Bonus, Pay Raise, Administration One of the most well-known multidimensional measures of Pay Satisfaction (e.g., Williams, McDaniel, & Nguyen, 2006).")
21
Table 1. Major Variables of the Study across 30 Geopolitical Entities Sample N Age Sex Education Rich Motivator Important Pay (% Male)(Year) M SD M SD M SD M SD 1. Australia262 26.81 29 12.50 3.73.81 3.23.90 3.79.73 3.14.94 2. Belgium201 38.97 57 16.09 3.40.79 3.04.84 3.68.72 3.30.85 3. Brazil201 37.71 45 16.92 3.59.91 3.05.98 3.73.81 2.68.95 4. Bulgaria 162 27.36 64 16.91 3.92.71 3.57.85 3.82.65 2.65.84 5. China 204 31.57 60 15.38 3.69.80 3.28.85 3.79.76 2.72.81 6. Egypt 200 40.26 50 14.88 3.75 1.05 2.90 1.04 4.08.74 3.37 1.08 7. France 135 32.30 56 16.19 3.79.78 3.38.92 3.61.70 2.86 1.04 8. HK211 30.68 49 15.67 4.06.69 3.33.90 4.07.59 3.00.83 9. Hungary100 34.06 55 15.96 3.83.73 3.55.90 3.98.71 3.05 1.08 10. Italy204 37.88 39 14.12 3.37.96 2.86.93 3.43.73 3.04.88 11. Macedonia204 41.60 44 13.31 3.97.81 3.54.88 4.07.71 2.87.97 12. Malaysia 200 31.80 53 15.23 3.99.68 3.64.84 4.17.56 3.12.89 13. Malta 200 36.91 51 16.47 3.95.85 3.13.98 4.33.57 2.56 1.02 14. Mexico 295 30.79 54 14.31 3.42.89 3.26.97 3.80.72 2.97.93 15. Nigeria200 34.80 61 15.74 4.48.60 3.24.99 4.57.49 3.45.84 16. Oman204 29.74 64 14.67 3.81.80 2.82.95 4.15.60 3.56.94 17. Peru 190 31.89 64 17.30 3.62.74 3.27.97 3.77.81 3.07.87 18. Philippines200 33.45 51 17.13 3.80.81 3.26 1.00 4.08.66 3.44.74 19. Portugal200 35.18 40 15.44 3.50.84 2.78.84 3.81.62 2.70.90 20. Romania200 38.02 27 16.69 3.83.77 3.56.85 3.85.74 2.56.94 21. Russia 200 35.92 42 17.58 3.96.78 3.34.84 3.88.70 2.76.92 22. Singapore-1202 33.70 53 15.12 3.95.75 3.43.99 4.02.63 3.18.88 23. Singapore-2336 33.23 57 15.01 3.95.69 3.52.89 4.07.67 3.26.82 24. Slovenia200 38.72 43 13.68 3.37.80 3.00.89 3.66.66 2.93 1.00 25. S. Africa203 46.52 46 15.76 3.88.67 3.16.75 4.03.58 2.28.56 26. S. Korea203 37.21 73 15.92 4.21.62 3.67.78 4.24.58 3.03.82 27. Spain 183 33.81 59 14.15 3.56.89 2.91.94 3.72.77 3.12.86 28. Taiwan201 34.95 48 16.56 4.10.68 3.81.80 4.15.62 3.03.86 29. Thailand200 33.29 54 16.98 3.88.86 3.30.84 3.87.68 3.19.63 30. US274 35.04 45 15.08 3.85.79 3.59.98 4.10.65 2.83 1.00 ________________________________________________________________________________________ Whole Sample 6,175 34.67 50 15.45 3.80.83 3.28.94 3.95.71 3.00.94 ________________________________________________________________________________________ Note. Age and education were expressed in years. Sex was expressed in % male.
(Year) M SD M SD M SD M SD 1. Australia Belgium Brazil Bulgaria China Egypt France HK Hungary Italy Macedonia Malaysia Malta Mexico Nigeria Oman Peru Philippines Portugal Romania Russia Singapore Singapore Slovenia S. Africa S. Korea Spain Taiwan Thailand US ________________________________________________________________________________________ Whole Sample 6, ________________________________________________________________________________________ Note. Age and education were expressed in years. Sex was expressed in % male..")
23
Measurement Invariance It does little good to test a theoretical and conceptual relationship across cultures “unless there is confidence that the measures operationalizing the constructs of that relationship exhibit both conceptual and measurement equivalence across the comparison groups” (Riordan & Vandenberg, 1994, p. 645).
..")
24
Measurement Invariance: 9 Steps (1) an omnibus test of equality of covariance matrices across groups, (2) a test of “configural invariance”, (3) a test of “metric invariance”, (4) a test of “scalar invariance”, (5) a test of the null hypothesis that like items unique variances are invariant across groups, (6) a test of the null hypothesis that factor variances were invariant across groups, (7) a test of the null hypothesis that factor covariances were invariant across groups, (8) a test of the null hypothesis of invariant factor means across groups, and (9) other more specific test.
 an omnibus test of equality of covariance matrices across groups, (2) a test of configural invariance , (3) a test of metric invariance , (4) a test of scalar invariance , (5) a test of the null hypothesis that like items unique variances are invariant across groups, (6) a test of the null hypothesis that factor variances were invariant across groups, (7) a test of the null hypothesis that factor covariances were invariant across groups, (8) a test of the null hypothesis of invariant factor means across groups, and (9) other more specific test.")
25
Measurement Invariance “Tests for configural and metric invariance were most often reported” (Vandenberg and Lance (2000) p. 35). Configural invariance—factor structures Metric invariance—factor loadings
. Configural invariance—factor structures Metric invariance—factor loadings.")
26
Method Researchers collected data from 200 full-time white-collar employees and managers in large organizations. Translation-back translation The Love of Money Scale The Pay Level Satisfaction Scale

27
32 Samples, N = 6,659 1. Australia (n = 262), 11. Hungry (100) 2. Belgium (201), 12. Italy (204) 3. Brazil (201), 13. Macedonia (204) 4. Bulgaria (162), 14. Malaysia (200) 5. China-1 (319 students), 15. Malta (200) 6. China-2 (204 employees), 16. Mexico (295) 7.Croatia (165), 17. Nigeria 8.Egypt (200), 18. Oman 9. France (135), 19. Peru 10. Hong Kong (211), 20. Philippines (200)
 2. Belgium (201), 12. Italy (204) 3. Brazil (201), 13. Macedonia (204) 4. Bulgaria (162), 14. Malaysia (200) 5. China-1 (319 students), 15. Malta (200) 6. China-2 (204 employees), 16. Mexico (295) 7.Croatia (165), 17. Nigeria 8.Egypt (200), 18. Oman 9. France (135), 19. Peru 10. Hong Kong (211), 20. Philippines (200).")
28
32 Samples, N = 6,659 21. Portugal (200), 31. Thailand (202) 22. Romania (200), 32. the USA (274) 23. Russia (200), 24. Singapore-1 (203), 25. Singapore-2 (336), 26. Slovenia (200), 27. South Africa (211), 28. South Korea (203), 29. Spain (183), 30. Taiwan (200),
, 32. the USA (274) 23. Russia (200), 24. Singapore-1 (203), 25. Singapore-2 (336), 26. Slovenia (200), 27. South Africa (211), 28. South Korea (203), 29. Spain (183), 30. Taiwan (200),.")
29
Evaluation criteria Measurement Invariance 1. Configural invariance: u χ2, df, u TLI >.95, u CFI >.95, u SRMSR <.08, u RMSEA <.08 and 2. Metric invariance: u chi-square change (Δχ2/Δdf) u fit index change ΔCFI
 u fit index change ΔCFI.")
32
Configural Invariance F First, we eliminated 14 samples (printed in bold) based on our rigorous criteria (χ2/df.90, CFI >.90, RMSEA.90, CFI >.90, RMSEA <.10). We eliminated only 2 samples (bold*) out of 31: Malta and Nigeria.
 out of 31: Malta and Nigeria..")
33
Metric Invariance The differences between unconstrained MGCFA (χ2 = 529.23, df = 360, p =.00, TLI = 1.00, CFI = 1.00, RMSEA =.01) and constrained MGCFA (χ2 = 867.43, df = 444, p =.00, TLI =.99, CFI = 1.00, RMSEA =.02) was significant based on chi-square change (Δχ2 = 338.20, Δdf = 84, p <.05), but not significant based on fit index change (ΔCFI =.00, n.s.). We have achieved metric (factor loadings) invariance.
 invariance..")
37
Implications--1 Researchers should not take the measurement invariance for granted. Researchers need “to systematically examine the assumption of stable and transferable measurement continua” (Riordan & Vandenberg, 1994: 666). This study is an initial step in the cross-cultural validation of the Love of Money Scale.
. This study is an initial step in the cross-cultural validation of the Love of Money Scale..")
38
Discussion, Implications, Limitations F There was a good fit between our 9-item-3-factor Love of Money Scale (LOMS) and our whole sample involving 31 geopolitical entities. F We achieved configural invariance in 15 samples using the most rigorous criteria F We achieved configural invariance in 29 samples (our of 31) using less rigorous but acceptable criteria F We achieved metric invariance in 15 samples using 15 samples.
 using less rigorous but acceptable criteria F We achieved metric invariance in 15 samples using 15 samples..")
39
Implications--2 This study examines the love of money across samples and “money” is the focus of our attention. Researchers have to examine the wording or phrasing of items carefully when they design future measurement instruments (Riordan & Vandenberg, 1994: 667).
..")
40
Implications--3 F Cronbach’s alpha examines inter-item reliability F Measurement invariance identifies equivalence across populations: factor structure and factor loading. F Both contribute to our understanding of the measurement instrument.

41
Implications--4 F One of the possible reasons of non-invariance is the composition of the samples. F Malaysia and Singapore-2 samples have Chinese, Malay, Indian, and Caucasian. F Singapore-1 sample has Chinese. F The Nigeria sample has Igbo, Yoruba, Housa, and other ethnic groups.

42
Other Research F The love of money is indirectly related to unethical behavior through Machiavellianism for Business students, male students, and male Business students, but not for Psychology students, female students, and female Psychology student. F Tang and Chen’s results offer some hope regarding the efficacy of teaching business ethics in business school because Business students reduce significantly the propensity to engage in Theft from Time 1 to Time 2.

43
Implications F Researchers and managers may have the potential to use the Love of Money Scale and the Propensity to Engage in Unethical Behavior Scale (Evil) as a personnel selection or an “at-hire” tool for “money sensitive” positions in organizations. F Future research may also examine the impact of possible training (HRD) on the love of money and other constructs that, in turn, may enhance employees’ ethical behaviors in organizations. More research is needed in this direction.
 on the love of money and other constructs that, in turn, may enhance employees’ ethical behaviors in organizations. More research is needed in this direction..")
44
Limitations F First, there is no guarantee that the original meaning of these items is perfectly translated to the other languages. F Second, we have collected data from full-time employees in these geopolitical entities. However, we do not have perfect control of many nuisance variables F Third, our whole sample is reasonably large, but the sample from each geopolitical entity is quite small and does not represent a random sample or the average citizen of the geopolitical entity. We cannot generalize the findings to the whole population with full confidence.

45
Final Thoughts and Conclusions F This study offers researchers some confidence and insights in using the Love of Money Scale. F When researchers and practitioners apply the same tools consistently across organizations and geopolitical entities overtime, the cumulative results will enhance our abilities to understand, predict, and control the role of the love of money in organizations.

46
Thank You Danke Dankeshen Grazie Merci Muchas Gracias 謝謝

Similar presentations


 for Turkish Adolescents and Young Adults ACA-APCC 2015 Conference, Singapore.>")


