Download presentation
Presentation is loading. Please wait.

1
New Experience in the Transformer Diagnosis Michael Krüger, OMICRON Austria

2
Electrical Measurement Methods I

3
Electrical Measurement Methods II

4
Content Winding Resistance Measurement
Fault Finding on Transformer Windings with FRA Moisture Measurement on Transformers Partial Discharge Measurement on Transformers

5
Winding Resistance Measurement

6
Diverter Switch Contact of Phase V

7
Winding Resistance after Repair

8
Content Winding Resistance Measurement
Fault Finding on Transformer Windings with FRA Moisture Measurement on Transformers Partial Discharge Measurement on Transformers

9
Fault on a 115kV / 34.5kV Transformer
There was a breakdown in phase B of the 34.5 kV busbar in the substation The differential protection relay of the faulty transformer tripped Example from David Stelmach. – a person was working in the substation, one 115kV line was falling down on the 34.5kV lines, first on phase B, then also on the other phases. Transformer saw overcurrent on B phase and then tripped out on Differential.

10
DGA Phase 1: Trip out of Service, Differential Phase 2: DGA
second DGA showed 19ppm C2H2

11
Transformer Model for FRA
28/11/2006 Transformer Model for FRA

12
Swept Frequency Response Analysis (SFRA)
28/11/2006 Swept Frequency Response Analysis (SFRA) Magnitude Phase This slide explains the so-called sweep frequency method. In contrast to the impulse method, here we work with a sinusoidal signal, which is swept between 10 Hz and 10/20 kHz (or more). Vin – represented in red – is the input signal, which is standardized to 1 or 100%. We sweep the signal over the whole frequency range and measure the signal Vout - represented in blue - at the other end of the winding. We see that the blue signal (output signal) compared to the red signal (input signal) shows both a damping as well as a phase shift. The transfer function (H) in dB is the result of the calculation according the shown formula: H(dB) = .... Advantages of the sweep FRA method: The input amplifiers of the equipment can be realized with a very small bandwidth; by that it can be avoided that other distortion signals superimpose the measurement signal Over the whole frequency range we have a constant amplitude of the oscillator signal and by that no limitation of / a constant energy at higher frequencies. This allows a more sensitive measurement of particularly at higher resonance frequencies.
 Magnitude. Phase. This slide explains the so-called sweep frequency method. In contrast to the impulse method, here we work with a sinusoidal signal, which is swept between 10 Hz and 10/20 kHz (or more). Vin – represented in red – is the input signal, which is standardized to 1 or 100%. We sweep the signal over the whole frequency range and measure the signal Vout - represented in blue - at the other end of the winding. We see that the blue signal (output signal) compared to the red signal (input signal) shows both a damping as well as a phase shift. The transfer function (H) in dB is the result of the calculation according the shown formula: H(dB) = .... Advantages of the sweep FRA method: The input amplifiers of the equipment can be realized with a very small bandwidth; by that it can be avoided that other distortion signals superimpose the measurement signal. Over the whole frequency range we have a constant amplitude of the oscillator signal and by that no limitation of / a constant energy at higher frequencies. This allows a more sensitive measurement of particularly at higher resonance frequencies.")
13
FRA LV Winding – Comparison of the 3 Phases
B Phase

14
Radial Forces Buckling with inner supports Buckling without inner
Higher order or forced Buckling The conductors can bend between the supports all along the circumference Free mode or free Buckling Source: Brochure CIGRE WG : The Short Circuit Performance of Power Transformers

15
Radial Failure (Buckling)
This slides shows the standard FRA measuring method: The yellow cable (generator output) is connected to the beginning of the winding, with the red cable the injected voltage is measured back to compensate wiring influences (reference channel). With the blue cable (output) the damped signal at the other end of the same winding is fed back to equipment to the measurement input. This is the standard FRA method which should be applied as a minimum for all FRA measurements. The measurement is performed for each phase: If a transformer has two voltage levels this means that six measurements are performed, if we have a three-winding transformer (upper, medium, and low voltage winding), nine such measurements are necessary. © OMICRON Academy
 is connected to the beginning of the winding, with the red cable the injected voltage is measured back to compensate wiring influences (reference channel). With the blue cable (output) the damped signal at the other end of the same winding is fed back to equipment to the measurement input. This is the standard FRA method which should be applied as a minimum for all FRA measurements. The measurement is performed for each phase: If a transformer has two voltage levels this means that six measurements are performed, if we have a three-winding transformer (upper, medium, and low voltage winding), nine such measurements are necessary. © OMICRON Academy.")
16
Failure Modes due to Radial Forces
B phase with buckling C phase without buckling Source: Cigre Brochure 342 “ MECHANICAL-CONDITION ASSESSMENT OF TRANSFORMER WINDINGS USING FREQUENCY RESPONSE ANALYSIS (FRA)”
")
17
LV Winding with Cigre Case Study of Buckling
Comparison FRA LV Winding with Cigre Case Study of Buckling Systematic shift of several resonances B Phase

18
B Phase Take a closer look

19
B Phase

20
Content Winding Resistance Measurement
Fault Finding on Transformer Windings with FRA Moisture Measurement on Transformers Partial Discharge Measurement on Transformers

21
Diagnosis of Tranformer On-load Tap Changers
29 November 2006 Water in the Transformer Most of the water is contained in the paper! Mass of the oil: 100,000 kg = 220,000 Lbs Water content at 60 °C: 40 ppm Mass of the water, dissolved in the oil: 4 kg = 8.8 Lbs Mass of the solid insulation: 13,000 kg = 20,000 Lbs Water content at 60 °C: 4 % Mass of the water contained in the paper: 520 kg = 1200 Lbs Paper 4 -

22
Diagnosis of Tranformer On-load Tap Changers
29 November 2006 Determination of the Water Content in Paper [Karl Fischer Titration and Equilibrium Curves] Curves are only valid for new oil and new paper, for aged oil/paper different curves are necessary Oil sampling is critical (round robin tests) Balance between water content in the paper and in oil needs constant temperatures over a long period Only average measurement Paper 4 -
 Balance between water content in the paper and in oil needs constant temperatures over a long period. Only average measurement. Paper 4 -")
23
History of Dielectric Diagnostic Methods
1991 RVM for water determination Soon questioned by users (Kachler 1996) 1960+ Dissipation factor at power frequency Polarization index At that time: No reliable method for onsite moisture diagnostics 1999+ Polarization Depolarization Currents Technical University Zurich Switzerland 1999+ Frequency Domain Spectroscopy KTH Stockholm with ABB 2007 Combination of PDC and FDS
 Dissipation factor at power frequency. Polarization index. At that time: No reliable method for onsite moisture diagnostics Polarization Depolarization Currents. Technical University Zurich Switzerland Frequency Domain Spectroscopy. KTH Stockholm with ABB Combination of PDC and FDS.")
24
Diagnosis of Tranformer On-load Tap Changers
29 November 2006 Dielektric Response in the Time Domain Polarisation Depolarisation Current (PDC) Current = f(t) Paper 4 -
 Current = f(t) Paper 4 -")
25
Diagnosis of Tranformer On-load Tap Changers
29 November 2006 Dielektric Response in the Frequency Domain Frequency Domain Spectroscopy (FDS) or Dielectric Frequency Response (DFR) Paper 4 -
 or Dielectric Frequency Response (DFR) Paper 4 -")
26
Dielectric Response Measurement with Frequency Domain Spectroscopy (FDS) and Polarisation & Depolarisation Current (PDC) Current [nA] Time [s] Trans- formation Frequency [Hz] Power factor 0.001 1 1000 100 0.1 PDC FDS 2 4 6 8 10 12 14 PDC FDS DIRANA Duration / h 0,0001 0,001 0,01 0,1 1 100 1000 Frequency range / Hz Combination of PDC und FDS reduces measurement time

27
Interpretation and Analysis
Transition from Capacitive to Resistive Voltage Distribution Pressboard: Water, lmw Acids Oil: Carbon, Sludge, hmw Acids Öl 1pS/m 10 Pressboard Dissipation factor 1 Pressboard 0,5 1,0 2,0 Overall Response 1%, 1pS/m, X30, Y15 0.1 0.01 0.001 0.0001 0.0001 0.001 0.01 0.1 1.0 10 100 1000 f/Hz

28
Analysis of the Water Content by Comparison to Model Results
Measurement Laboratory Results Water Content Oil Conductivity Comparison Fitting X Oil XY-Model Barriers Spacers Y Temperature Moisture determination bases on a comparison of the dielectric properties of the real transformer to modelled dielectric properties. The model bases on laboratory measurements on pressboard samples (upper right photograph) and the conductivity of oil. Both are combined by the XY-model taking into account the geometry condition of the transformer and the insulation temperature. A fitting algorithm arranges the modelled dielectric properties in order to get a good agreement to the measured dielectric properties. The best fitting curve provides the moisture content and oil conductivity of the real transformer. Here you can demonstrate how the software works using the link to C:\Program Files\OMICRON\DIRANA\Dirana.exe Source: Weidmann
 and the conductivity of oil. Both are combined by the XY-model taking into account the geometry condition of the transformer and the insulation temperature. A fitting algorithm arranges the modelled dielectric properties in order to get a good agreement to the measured dielectric properties. The best fitting curve provides the moisture content and oil conductivity of the real transformer. Here you can demonstrate how the software works using the link to C:\Program Files\OMICRON\DIRANA\Dirana.exe. Source: Weidmann.")
29
FDS / PDC Measurement on a 130 MVA Transformer – Situation 2006
Diagnosis of Tranformer On-load Tap Changers 29 November 2006 FDS / PDC Measurement on a 130 MVA Transformer – Situation 2006 130 MVA 230 / 115 / 48 kV Year of manf. 1967 Rubber membrane in the expansion vessel Paper 4 -

30
FDS / PDC Measurement on a 130 MVA Transformer – Water Content Distribution
5 Oilsample Karl Fischer mg/kg (Oommen equilibrium) 4 Oilsample RH % Average Moisture in paper [%] 3 FDS HV-LV Tertiary not in use 2 1 FDS LV- Tertiary FDS Tertiary- Tank FDS/PDC 1mHz-1kHz
 4. Oilsample. RH % Average. Moisture in paper [%] 3. FDS HV-LV. Tertiary not in use FDS LV- Tertiary. FDS Tertiary- Tank. FDS/PDC. 1mHz-1kHz.")
31
130 MVA Transformer On-Line Drying
Diagnosis of Tranformer On-load Tap Changers 29 November 2006 130 MVA Transformer On-Line Drying Paper 4 -

32
History 2006 –

33
Content Winding Resistance Measurement
Fault Finding on Transformer Windings with FRA Moisture Measurement on Transformers Partial Discharge Measurement on Transformers

34
Diagnostic Measurement on a Cast Resin Type Transformer

35
Cracks in the Epoxy

36
PD Measurement Circuit

37
Test Arangement CPC100 CP CU1 Compensating Capacitors

38
Test Arangement Coupling Capacitor and MPD600

39
Separation of PD Sources in 3CFRD
500kHz 2 MHz 8 MHz 500kHz 8MHz 2MHz timeframe 1 µs 500 kHz 2 MHz 8 MHz 3CFRD = 3 Center Frequency Relation Diagram

40
PD Measurement without 3CFRD Filtering

41
3CFRD Filtering

42
PD Measurement with 3CFRD Filtering

43
PD Measurement without 3CFRD Filtering

44
On-Line PD Measurement on a Transformer

45
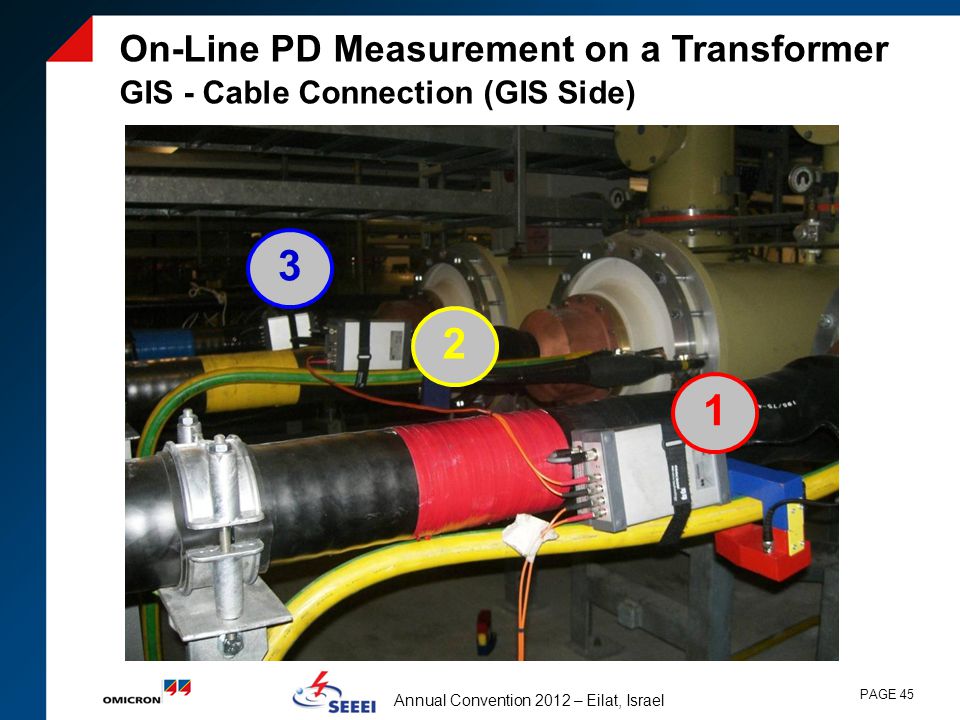
On-Line PD Measurement on a Transformer GIS - Cable Connection (GIS Side)
2 1 3
46
Online PD Measurement at the GIS Side
red phase GIS yellow phase GIS blue phase GIS

47
Sensors 1, 2 and 3 at the GIS Side and Sensor 4 at the Transformer Side

48
PD Measurement at the GIS and the Transformer Side
blue phase GIS blue phase Tr

49
PD Measurement at GIS and TR Side Trigger = TR Side - Delay on GIS Side
trigger = blue phase Tr delayed signal blue phase GIS

50
Jumper between Oil/Oil Bushing and Cable Termination

51
Jumper between Oil/Oil Bushing and Cable Termination

52
Questions and Remarks?

53
A last Example: Fault Investigation on a 220kV Transformer

54
DGA

55
Ratio Measurement HV to LV

56
Ratio HV to LV Phase A=R 2kV on HV -> 23mV on LV on all taps !

57
Ratio HV to LV Phase B=S All taps have the same ratio 7.2:1 of position 11 !

58
Ratio HV to LV Phase C=T All taps have the same ratio 7.2:1 of position 11 !

59
FRA HV Interruption in phase R, HV side

60
FRA LV with HV open Short circuit in phase R, but on LV or HV side ???

61
FRA LV with HV Open and Shorted
A LV with open loop HV (red line) B LV with open loop HV (blue solid line) B LV with shorted HV (blue dashed line)
 B LV with open loop HV (blue solid line) B LV with shorted HV (blue dashed line)")
62
Winding Resistance of LV
Phase R LV doesn’t look damaged

63
Conclusions Phase R=A is interrupted on HV side
The tap changer is broken – in position 11 The limb R has a shorted winding The short circuit in limb R is not on the LV side but on the HV side

64
Opening of the OLTC Compartment

65
Opened OLTC Compartment
Interruption in phase R, HV side

66
Interruption due to Open OLTC Contacts

67
Removed OLTC – Cables to the Tap Winding

68
FRA on the Single Tap Winding Segments

69
FRA on the Single Tap Winding Segments
9 - 11 8 - 9 7 - 8 6 - 7 5 - 6 4 - 5 3 - 4 2 - 3

70
FRA on the Single Tap Winding Segments

71
Winding Resistance of the Tap Winding Segments
4 The fault was between tap conductor 4 and 6 ! 25mΩ 7mΩ 14mΩ 6mΩ 5 6

72
Questions and Remarks?

Similar presentations


 and Transformer Diagnostics M5100 Product Series Doble Engineering Knowledge Is Power SM Apparatus Maintenance.>")


