Download presentation
Presentation is loading. Please wait.

1
Workshop on Census Cartography and Management for ESCAP 15 – 19 October 2007 Bangkok, Thailand HOUSING CENSUS DATA & DISASTER MITIGATION ASPECTS IN INDIA Dr. B. B. JAIN, Ph.D. Office of the Registrar General and Census Commissioner New Delhi, India

4
ADMINISTRATIVE DIVISIONS : FACTS & FIGURES STATES: 35 (28 States and 7 Union territories) DISTRICTS: 593 SUBDISTRICTS: 5,463 TOWNS: 5,161 C D BLOCKS: 6,404 VILLAGES: 6.39 Lakh (44,856 Uninhabited) AREA :3.28 Million Sq.Kms 2.4 % of World Surface Area. 16.9 % of World Population.

5
Administrative Setup INDIA (Country) States (35) Districts (593) Sub-district (5,463) Village (0.6 million) Ward Town (5161) C D Block (6,406)
 States (35) Districts (593) Sub-district (5,463) Village (0.6 million) Ward Town (5161) C D Block (6,406)")
6
Disaster effects in India

7
SEISMIC ZONES IN INDIA Zone V : Covers the areas liable to seismic intensity IX and above on Modified Mercalli Intensity Scale. This is the most severe seismic zone and is referred here as Very High Damage Risk Zone. Zone IV : Gives the area liable to MM VIII. This, zone is second in severity to zone V. This is referred here as High Damage Risk Zone. Zone III: The associated intensity is MM VII. This is termed here as Moderate Damage Risk Zone. Zone II: The probable intensity is MM VI. This zone is referred to as Low Damage Risk Zone. Zone I: Here the maximum intensity is estimated as MM V or less. This zone is termed here as Very Low Damage Risk Zone.

8
Indian Subcontinent is one of the world’s most disaster prone areas 1.Earthquake: 54% area vulnerable to Earthquakes One million houses damaged annually + human,social,other losses 12%of land is liable to severe earthquake MSK IX 18%land is liable to MSK VIII 25%land liable to MSK VII 2.Floods: 12% area of the country is prone to floods which means 40 million Hectares land area are prone to floods and annually on an average 8 million is affected 3.Wind and Cyclone Hazards: 8% of land prone to cyclones affect by both the Bay of Bengal and Arabian Sea. 4.Land Slides: Areas of Himalayas, North-eastern Region and Western Ghats prone of land slides. 5.Drought: 68% of the country is prone to drought in varying degrees. NATURAL DISASTERS : EFFECT IN INDIA

9
Indian agriculture is heavily dependent on the monsoon as a source of water. In some parts of India, the failure of the monsoons result in water shortages, resulting in below- average crop yields. This is particularly true of major drought-prone regions such as southern and eastern Maharashtra, northern Karnataka, Andhra Pradesh, Orissa, Gujarat, and Rajasthan. In the past, droughts have periodically led to major Indian famines, including the Bengal famine of 1770, in which up to one third of the population in affected areas died; the 1876–1877 famine, in which over five million people died; the 1899 famine, in which over 4.5 million died; and the Bengal famine of 1943, in which over five million died from starvation and famine-related illnesses. NATURAL DISASTERS : EFFECT IN INDIA

10
Indian Census: Introduction

11
Indian Census – Brief background o First synchronous census held in 1881 o Census 2001 was the 14 th in this uninterrupted series o Adopted extended de-facto method (or enumerating persons normally residing in the household during the enumeration period) o Census held in two phases: House-listing Operations … (April to June 2000) Population Enumeration … (9th to 28th February 2001)
 o Census held in two phases: House-listing Operations … (April to June 2000) Population Enumeration … (9th to 28th February 2001)")
12
Indian Census – Brief background o Unit of enumeration in Census is the Enumeration Block (EB) allotted to an Enumerator o Curved out on the basis of population size, an EB comprises of about 120 – 150 households or about 500 to 750 persons o 2 million Enumerators were deployed for 2001 Census. Mostly primary school teachers.

13
The final results of the House listing Operations 2001 were released in April, 2003 which provided valuable information on the housing stock, amenities and assets available to the household. House-listing data is available in ‘Tables on Houses, Household Amenities and Assets by India and States’. This data is also available in hard copy and electronic format for India and all the States/Union territories at district, sub- district and town level. The House-listing data is immensely useful to the Disaster Managers, Policy makers, Planners, Administrators to improve the quality of life in vulnerable areas.

14
Population: 1,028,737,436 Males: 532,223,090 (51.7 %) Rural Males: 381,668,992 (37.1 %); Urban Males: 150,554,098 (14.6 %) Females: 496,514,346 (48.3 %) Rural Females: 360,948,755 (35.1 %); Urban Females: 135,565,591 (13.2 %) Child Population (age 0–6years) : 163,819,614 (15.9 % of total population) Male Children : 84,999,203 (8.3 % of total population) Female Children : 78,820,411 (7.7 % of total population) Literate Persons: 560,687,797 (64.8 %) Literate Males: 336,533,716 (75.3 %) Literate Females: 224,154,081 (53.7 %)
 Rural Males: 381,668,992 (37.1 %); Urban Males: 150,554,098 (14.6 %) Females: 496,514,346 (48.3 %) Rural Females: 360,948,755 (35.1 %); Urban Females: 135,565,591 (13.2 %) Child Population (age 0–6years) : 163,819,614 (15.9 % of total population) Male Children : 84,999,203 (8.3 % of total population) Female Children : 78,820,411 (7.7 % of total population) Literate Persons: 560,687,797 (64.8 %) Literate Males: 336,533,716 (75.3 %) Literate Females: 224,154,081 (53.7 %)")
15
HOUSING CENSUS DATA in Tables, INDIA,2001 H-2 Distribution of census houses used as residence and residence-cum-other use by their condition H-2 Appendix Distribution of households by the condition of census houses occupied by them H-3A Distribution of census houses by predominant material of roof H-3B Distribution of census houses by predominant material of wall

16
H-3C Distribution of census houses by predominant material of floor H-3A Appendix Distribution of households living in census houses by predominant material of roof H-3B Appendix Distribution of households living in census houses by predominant material of wall H-3C Appendix Distribution of households living in census houses by predominant material of floor

17
H-11 Distribution of households by availability of separate kitchen and type of fuel used for cooking H-12 Distribution of households by source and location of drinking water and availability of electricity and latrine H-12 A (E) Distribution of households classified by source and location of drinking water and availability of electricity and latrine
 Distribution of households classified by source and location of drinking water and availability of electricity and latrine")
18
H-12 B (E) Households and distribution of 1000 population by availability of electricity and toilet facilities and ownership status of house occupied H-4 Distribution of census houses used as residence and residence-cum-other use by their type of structure H-4 Appendix Distribution of households by type of census houses occupied H-5 Distribution of households by size and number of dwelling rooms
 Households and distribution of 1000 population by availability of electricity and toilet facilities and ownership status of house occupied H-4 Distribution of census houses used as residence and residence-cum-other use by their type of structure H-4 Appendix Distribution of households by type of census houses occupied H-5 Distribution of households by size and number of dwelling rooms")
19
H-6 Distribution of households by ownership status of the census houses occupied by them and number of dwelling rooms H-6A (E) Distribution of households by ownership status of census houses, size of the household and number of dwelling rooms
 Distribution of households by ownership status of census houses, size of the household and number of dwelling rooms")
20
H-7 Distribution of households by number of married couples in a household and number of dwelling rooms, total number of married couples and number of married couples having independent sleeping rooms H-7A (E) Distribution of married couples and married couples having independent sleeping room by number of dwelling rooms available to the households in which they live and by number of married couples
 Distribution of married couples and married couples having independent sleeping room by number of dwelling rooms available to the households in which they live and by number of married couples")
21
H-8 Distribution of households by source of drinking water and its location H-9 Distribution of households by source of lighting H-10 Distribution of households by availability of bathroom & type of latrine within the house and type of drainage connectivity for waste water outlet

22
H-11 Distribution of households by availability of separate kitchen and type of fuel used for cooking. H-12 Distribution of households by source and location of drinking water and availability of electricity and latrine H-12 A (E) Distribution of households classified by source and location of drinking water and availability of electricity and latrine. H-13 Number of households availing banking services and number of households having each of the specified asset
 Distribution of households classified by source and location of drinking water and availability of electricity and latrine. H-13 Number of households availing banking services and number of households having each of the specified asset.")
23
Population Density (District Level) : INDIA, 2001
 : INDIA, 2001")
24
Condition of Census Houses Number (in million) Percentage Total Households187100.0 Good 94 50.3 Livable83 44.5 Dilapidated10 5.2 Condition of Census Houses : India 2001
 Percentage Total Households Good Livable Dilapidated Condition of Census Houses : India 2001")
25
Material of Roof (India 2001) Households (in million) Percentage No. of Households192100.0 Concrete 38 19.8 Tiles 63 32.6 Grass, thatch,bamboo, wood, mud, etc. 42 21.9 Others 49 25.7 Material Used in Houses : Roof

26
Material Used in Houses: Walls Material of Walls (India 2001) Households (in million) Percentage No. of Households192100.0 Burnt Brick 84 43.7 Mud, Unburnt Brick 62 32.2 Grass, thatch, bamboo, Wood, etc. 21 10.2 Others 25 13.9

27
Material Used in Houses: Floors Material of Floors (India 2001) Households (in million) Percentage No. of Households192100.0 Mosaic, Floor tiles 14 7.3 Cement 51 26.5 Mud110 57.1 Others 17 9.1

28
Dwelling (India 2001) Households (in Millions) Percentage Total Households192100.0 No exclusive Room 6 3.1 One Room 74 38.5 Two Room 58 30.0 Three Room 27 14.3 More than three Rooms 27 14.1 Dwelling Rooms in Houses: 2001
 Households (in Millions) Percentage Total Households No exclusive Room One Room Two Room Three Room More than three Rooms Dwelling Rooms in Houses: 2001")
29
Distance/TypeHouseholds (in million) Percentage Total Households 192100.0 Within Premises 75 39.0 Near Premises 85 44.3 Away 32 16.7 Hand pump/Tube-well 79 41.2 Tap 70 36.7 Well 35 18.2 Other 8 3.9 Source of Drinking Water: India
 Percentage Total Households Within Premises Near Premises Away Hand pump/Tube-well Tap Well Other Source of Drinking Water: India")
30
Source of Lighting: India 2001 LightingHouseholds (in million) Percentage Total Households191.9 100.0 Electricity107.2 55.8 Kerosene 83.1 43.3 Others 1.0 0.9 No Lighting 0.6-
 Percentage Total Households Electricity Kerosene Others No Lighting 0.6-")
31
Availability of bathroom, latrine & Kitchen : India India (2001)Households (in million) Percentage Bathroom available within the house 69 36.1 Latrine available within the house 70 36.4 Kitchen available within the house 123 64.0
Households (in million) Percentage Bathroom available within the house Latrine available within the house Kitchen available within the house")
32
Fuel used for Cooking: India 2001 FuelHouseholds (in million) Percentage Total Households192100.0 Fire-wood 101 52.5 LPG 34 17.5 Crop residue 19 10.0 Cow dung Cake 19 9.8
 Percentage Total Households Fire-wood LPG Crop residue Cow dung Cake")
33
Assets Available: India 2001 AssetsHouseholds (in million) Percentage Radio, Transistor 67.4 35.1 Television 60.6 31.6 Telephone 17.5 9.1 Bicycle 83.8 43.7 Scooter, motorcycle, moped 22.5 11.5 Car, Jeep, Van 4.8 2.5 None of the above assets 66.2 34.5 Availing banking services 68.2 35.5
 Percentage Radio, Transistor Television Telephone Bicycle Scooter, motorcycle, moped Car, Jeep, Van None of the above assets Availing banking services")
34
Mapping Exercises: Aims to provide a pictorial base to the planning process especially to the semi literate population. Social Mapping: Location of habitat, natural topography, number of pucca (burnt bricks) and kuchha (mud etc.) houses, Other common infrastructures(eg. Safe Shelter worship place,health centre, play ground etc. Resource Mapping: Locally available resources and assets for use during disasters.
 and kuchha (mud etc.) houses, Other common infrastructures(eg. Safe Shelter worship place,health centre, play ground etc. Resource Mapping: Locally available resources and assets for use during disasters..")
35
1.SOCIAL MAPPING LOCATION OF THE HABITAT WITH RESPECT TO NATURAL TOPOGRAPHY NUMBER of PUCCA and KACCHA HOUSES 2. RESOURSE MAPPING 3.VULNERABILITY MAPPING Household Wise Vulnerable Groups Vulnerable Houses And Defunct Infrastructure Low Lying Areas Prone To Floods Landslide Prone Areas Location Of Hazardous Industries/Electrical Installations/ Tall Weak Structures – Buildings,etc. Narrow Roads 4.SAFE AND ALTERNATE ROUTE MAPPING Mapping Exercises:

36
NATIONAL DISASTER MANAGEMENT : INDIA MINISTRY OF HOME AFFAIRS NATIONAL CRISIS MANAGEMENT COMMITTEE(NCMC) NATIONAL& STATE DISASTER MANAGEMENT AUTHORITY NATIONAL INSTITUTE OF DISASTER MANAGEMENT IMD, CWC, DOS,(NRSA) NATIONAL DISASTER RESPONSE
 NATIONAL& STATE DISASTER MANAGEMENT AUTHORITY NATIONAL INSTITUTE OF DISASTER MANAGEMENT IMD, CWC, DOS,(NRSA) NATIONAL DISASTER RESPONSE")
37
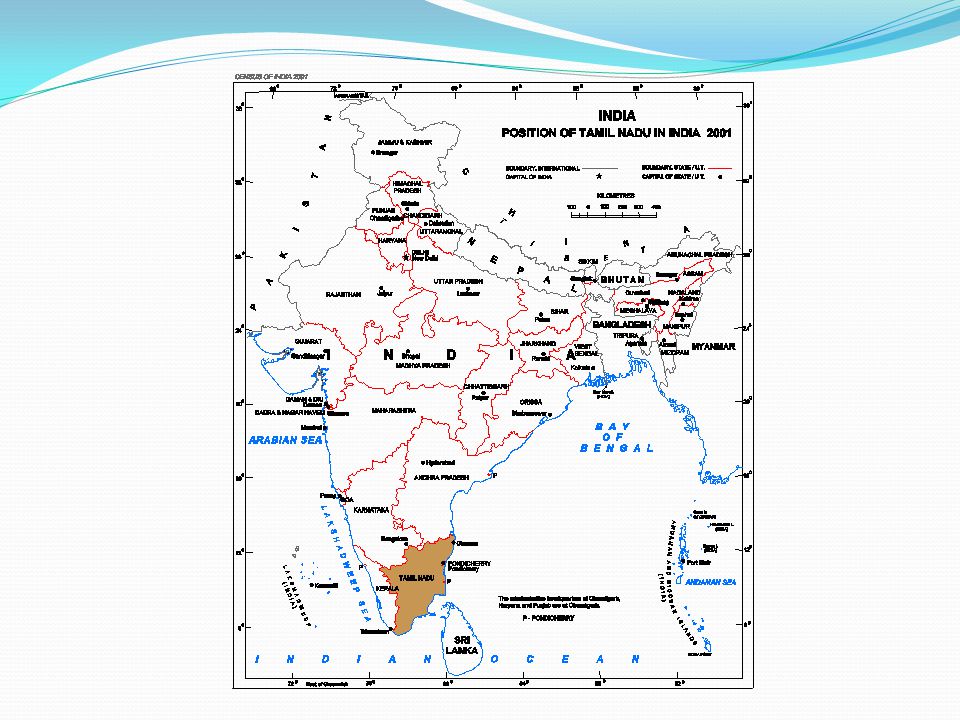
Housing Census Data & Maps of Tamil Nadu State in India (Tsunami Effected)
")
40
RELIEF AND DRAINAGE, TAMIL NADU

41
Tsunami effected Areas: Tamil Nadu (India)
")
42
P0PULATION DISTRIBUTION, 2001 TAMIL NADU

44
HOUSING PROFILE : TAMIL NADU (India) CENSUS HOUSES AND THE USES TO WHICH THEY ARE PUT HousesTotal (%) Rural (%) Urban (%) No. of Census Houses 16,996,604 (100.0) 9,724,711 (57.2) 7,271,893 (42.8) Vacant Census Houses 1,050,624 (6.2 ) 606,205 (6.2) 444,419 (6.1) Occupied Census Houses 15,945,980 (93.8) 9,118,506 (93.8) 6,827,474 (93.9)
 9,724,711 (57.2) 7,271,893 (42.8) Vacant Census Houses 1,050,624 (6.2 ) 606,205 (6.2) 444,419 (6.1) Occupied Census Houses 15,945,980 (93.8) 9,118,506 (93.8) 6,827,474 (93.9).")
45
Material of Roof:Total (%)Rural (%)Urban (%) Total1 4,173,626 (100)8,274,790 (100)5,898,836 (100) Grass Thatch, Bamboo, Wood, Mud, etc. 3,744,853 (26.4)2,934,271(35.5)810,582 (13.7) Plastic, Polythene 31,990 (0.2)18,890 (0.2)13,100 (0.2) Tiles5,365,397 (37.9)3,336,304 (40.3)2,029,093 (34.4) Slate17,218 (0.1)8,663 (0.1)8,555 (0.1) G.I., Metal, Asbestos sheets466,334 (3.3)201,638 (2.4)264,696 (4.5) Brick270,913 (1.9)127,821 (1.5)143,092 (2.4) Stone26,681 (0.2)12,160 (0.1)14,521 (0.2) Concrete4,205,460 (29.7)1,613,546 (19.5)2,591,914 (43.9) Any other material44,780 (0.3)21,497 (0.3)23,283 (0.4) Tamil Nadu (India) HOUSEHOLDS LIVING IN CENSUS HOUSES BY PREDOMINANT MATERIAL OF ROOF
2,934,271(35.5)810,582 (13.7) Plastic, Polythene 31,990 (0.2)18,890 (0.2)13,100 (0.2) Tiles5,365,397 (37.9)3,336,304 (40.3)2,029,093 (34.4) Slate17,218 (0.1)8,663 (0.1)8,555 (0.1) G.I., Metal, Asbestos sheets466,334 (3.3)201,638 (2.4)264,696 (4.5) Brick270,913 (1.9)127,821 (1.5)143,092 (2.4) Stone26,681 (0.2)12,160 (0.1)14,521 (0.2) Concrete4,205,460 (29.7)1,613,546 (19.5)2,591,914 (43.9) Any other material44,780 (0.3)21,497 (0.3)23,283 (0.4) Tamil Nadu (India) HOUSEHOLDS LIVING IN CENSUS HOUSES BY PREDOMINANT MATERIAL OF ROOF.")
46
URBAN HOUSEHOLDS BY DWELLING ROOMS TAMIL NADU,2001

47
ASSETS AVAILABLE IN RURAL AREAS TAMIL NADU,2001

48
SOURCE OF DRINKING WATER IN RURAL AREAS TAML NADU,2001

49
SOURCE OF DRINKING WATER URBAN AREAS. TAML NADU,2001

50
RECOMMENDATIONS The maps of relief, contours, physiography, geological structure and housing conditions, material used in houses are digitized separately into polygon coverages using PC Arc/Info. Census data on housing are shown on map using Arc GIS software. Helpful in identifying the comparative position of housing stock prone to disaster.

51
Therefore, by querying this spatial database and the user requirements the planners and developers can select the sites which are ideal for their intended purpose. An overlay of the disaster prone area map and the human settlements and infrastructure map can be used to identify the endangered human settlements for taking early actions to assure the safety of them.

52
Once the sites/areas are selected with the guidance of these disaster prone maps, it is always advisable to carry out a location specific investigation to assess the risk on the intended purpose since these maps are based on the census data.

53
These maps also identify the safe areas on the basis of housing data and the areas which can be utilized with corrective measures. These housing data based spatial maps (GIS) can play a major roll in taking safety measures by local administration/departments in the country.
 can play a major roll in taking safety measures by local administration/departments in the country..")
54
Well Organized Management often passes disasters ……Thanks

Similar presentations


 Jamai-Osmania (P.O.), Hyderabad.>")


. RURAL HOUSING>")


