Download presentation
Presentation is loading. Please wait.

1
Science Assessment to Support an Illinois Nutrient Loss Reduction Strategy Mark David, Greg McIsaac, George Czapar, Gary Schnitkey, Corey Mitchell University of Illinois at Urbana-Champaign 11-08-12

2
Technical Tasks develop a science based technical assessment of: – current conditions in Illinois of nutrient sources and export by rivers in the state from point and non- point sources – methods that could be used to reduce these losses and estimates of their effectiveness throughout Illinois – estimates of the costs of statewide and watershed level application of these methods to reduce nutrient losses to meet TMDL and Gulf of Mexico goals

3
Illinois Riverine Water and Nutrients

4
Illinois Nutrient Concentrations (average of all rivers in state)
")
5
Riverine N and P Fluxes WaterNitrate-NTotal NDRPTotal P 10 12 ft 3 yr -1 million lb N or P yr -1 David & Gentry (2000) 1.653831.3 1980-1996 1.7040452715.434.0 1997-2011 1.7241053618.537.5 Urban runoff 6.0 8.3 1.5 Point sources 75.2 87.3 18.1 Percent of 1997-2011 load Point sources 18.4 16.348 David & Gentry (2000) 1647
 Urban runoff Point sources Percent of load Point sources David & Gentry (2000) 1647")
6
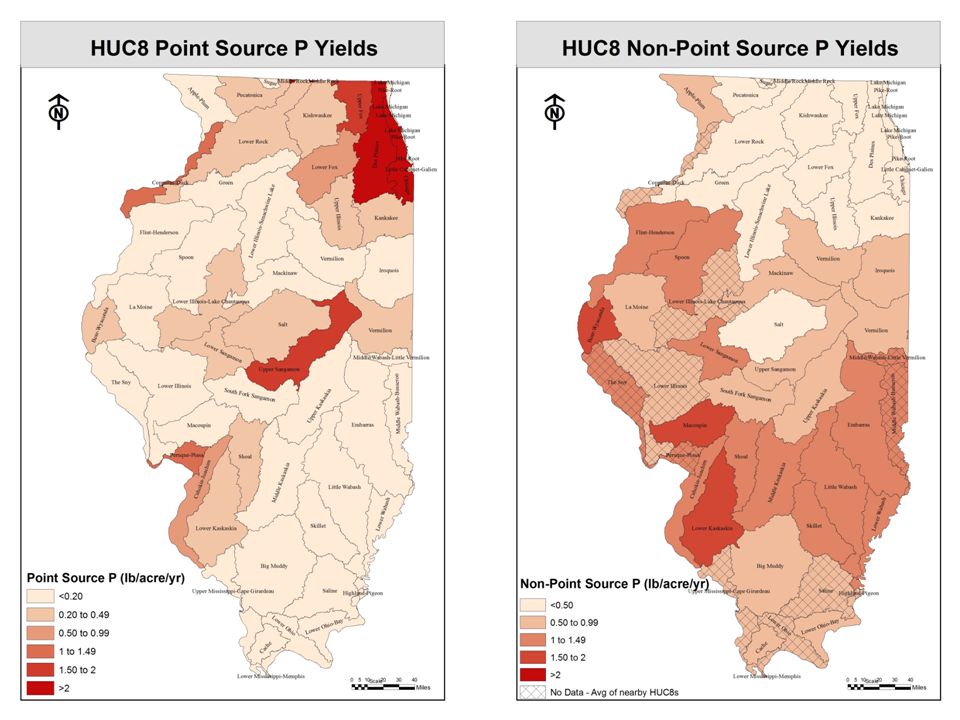
Point and agricultural sources (1997-2011)
")
7
Nitrate-N and Total P Targets Red line is target, purple is average 1997 to 2011

8
Illinois as % of MRB 20.2 11.3 David and Gentry (2000) 15% for total N, 10% for P
 15% for total N, 10% for P")
9
Illinois Nutrient Sources

14
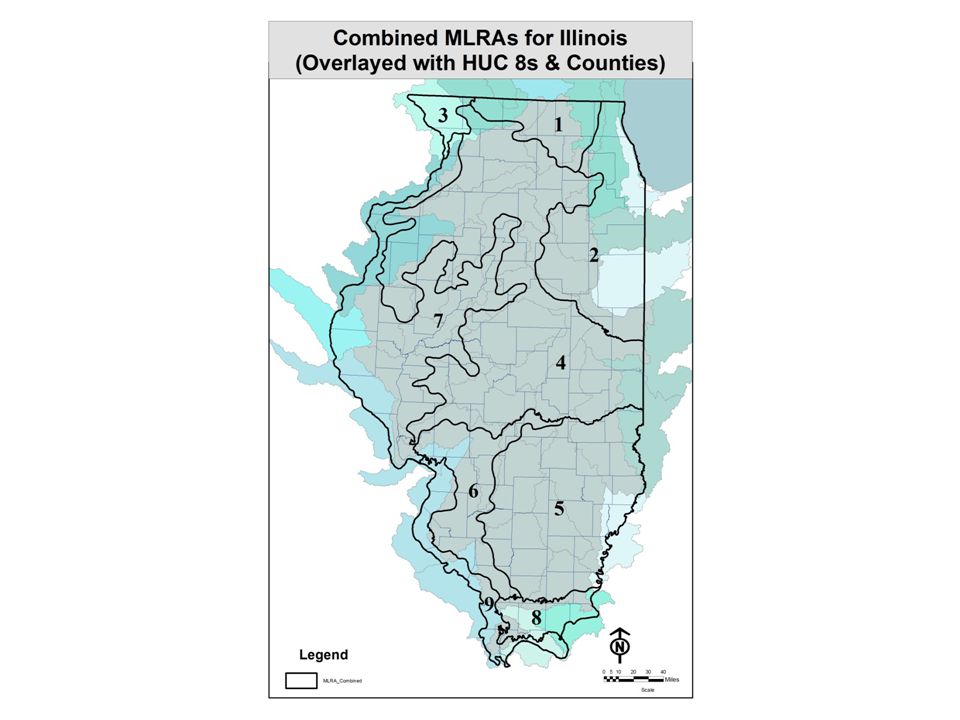
Agricultural Management by MLRA Combined MLRA DescriptionCorn (acres) Soybean (acres) Wheat (acres) Drained acres (% of crop acres) Corn yield (bu/acre) Soybean yield (bu/acre) MLRA 1 Northern Illinois drift plain515,905224,18620,192 288,491 (39)16148 MLRA 2 Northeastern Illinois heavy till plain1,532,1001,111,88542,404 2,063,695 (78)15039 MLRA 3 Northern Mississippi Valley163,50752,4321,975 20,942 (10)16050 MLRA 4Deep loess and drift5,579,9803,343,44476,078 5,437,807 (61)16452 MLRA 5Claypan1,609,6331,991,939352,839 310,087 (9)12839 MLRA 6Thin loess and till664,242689,773161,180 226,971 (17)13042 MLRA 7 Central Mississippi Valley, Northern Part2,058,8531,288,68673,884 1,284,588 (38)15549 MLRA 8 Sandstone and shale hills and valleys83,969115,24410,658 49,565 (25)10333 MLRA 9 Central Mississippi Valley, Western Part203,736314,66278,250 23,769 (5)12539 Sum12,411,9259,132,251817,4609,705,916 (43) Average crop acres and yields 2008 through 2012
 Soybean (acres) Wheat (acres) Drained acres (% of crop acres) Corn yield (bu/acre) Soybean yield (bu/acre) MLRA 1 Northern Illinois drift plain515,905224,18620, ,491 (39)16148 MLRA 2 Northeastern Illinois heavy till plain1,532,1001,111,88542,404 2,063,695 (78)15039 MLRA 3 Northern Mississippi Valley163,50752,4321,975 20,942 (10)16050 MLRA 4Deep loess and drift5,579,9803,343,44476,078 5,437,807 (61)16452 MLRA 5Claypan1,609,6331,991,939352, ,087 (9)12839 MLRA 6Thin loess and till664,242689,773161, ,971 (17)13042 MLRA 7 Central Mississippi Valley, Northern Part2,058,8531,288,68673,884 1,284,588 (38)15549 MLRA 8 Sandstone and shale hills and valleys83,969115,24410,658 49,565 (25)10333 MLRA 9 Central Mississippi Valley, Western Part203,736314,66278,250 23,769 (5)12539 Sum12,411,9259,132,251817,4609,705,916 (43) Average crop acres and yields 2008 through 2012")
15
Agricultural N Management by MLRA Combined MLRA DescriptionEstimated corn fertilizer (lb N/acre/yr) Estimated corn fertilizer + manure (lb N/acre/yr) Row crops (acres) Nitrate-N yield per row crop acre (lb N/acre/yr) MLRA 1 Northern Illinois drift plain152168 760,28320.4 MLRA 2 Northeastern Illinois heavy till plain158164 2,686,38925.0 MLRA 3 Northern Mississippi Valley135158 217,91431.3 MLRA 4Deep loess and drift150159 8,999,50219.6 MLRA 5Claypan180196 3,954,411 6.6 MLRA 6Thin loess and till156170 1,515,195 7.4 MLRA 7 Central Mississippi Valley, Northern Part155169 3,421,42324.5 MLRA 8 Sandstone and shale hills and valleys209219 209,871 3.9 MLRA 9 Central Mississippi Valley, Western Part192204 596,648 4.0 Sum157168 22,361,636
 Estimated corn fertilizer + manure (lb N/acre/yr) Row crops (acres) Nitrate-N yield per row crop acre (lb N/acre/yr) MLRA 1 Northern Illinois drift plain , MLRA 2 Northeastern Illinois heavy till plain ,686, MLRA 3 Northern Mississippi Valley , MLRA 4Deep loess and drift ,999, MLRA 5Claypan ,954, MLRA 6Thin loess and till ,515, MLRA 7 Central Mississippi Valley, Northern Part ,421, MLRA 8 Sandstone and shale hills and valleys , MLRA 9 Central Mississippi Valley, Western Part , Sum ,361,636")
16
Corn Fertilizer N by MLRA Combined MLRA DescriptionEstimated CS fertilizer + manure (lb/acre/yr) MRTN (10 to 1) CS (lb N/acre/yr) Estimated CC fertilizer + manure (lb/acre/yr) MRTN (10 to 1) CC (lb N/acre/yr) MLRA 1 Northern Illinois drift plain 156146196199 MLRA 2 Northeastern Illinois heavy till plain 151155190197 MLRA 3 Northern Mississippi Valley 146 184199 MLRA 4 Deep loess and drift 147155185197 MLRA 5 Claypan 181171227189 MLRA 6 Thin loess and till 157171198189 MLRA 7 Central Mississippi Valley, Northern Part 156163197194 MLRA 8 Sandstone and shale hills and valleys 202171254189 MLRA 9 Central Mississippi Valley, Western Part 188171237189 MRTN is Maximum Return to N
 MRTN (10 to 1) CS (lb N/acre/yr) Estimated CC fertilizer + manure (lb/acre/yr) MRTN (10 to 1) CC (lb N/acre/yr) MLRA 1 Northern Illinois drift plain MLRA 2 Northeastern Illinois heavy till plain MLRA 3 Northern Mississippi Valley MLRA 4 Deep loess and drift MLRA 5 Claypan MLRA 6 Thin loess and till MLRA 7 Central Mississippi Valley, Northern Part MLRA 8 Sandstone and shale hills and valleys MLRA 9 Central Mississippi Valley, Western Part MRTN is Maximum Return to N")
17
Nitrate Yield by MLRA Combined MLRA Description Drained cropland (acres) Nitrate-N yield per row crop acre (lb N/acre/yr) Nitrate-N yield per tile drained acre (lb N/acre/yr) Nitrate-N yield from non-tiled land (lb N/acre/yr) MLRA 1 Northern Illinois drift plain 288,49120.4436.6 MLRA 2 Northeastern Illinois heavy till plain 2,063,69525.02910.8 MLRA 3 Northern Mississippi Valley 20,94231.3 MLRA 4 Deep loess and drift 5,437,80719.6269.9 MLRA 5 Claypan 310,087 6.6 MLRA 6 Thin loess and till 226,971 7.4303.5 MLRA 7 Central Mississippi Valley, Northern Part 1,284,58824.54611.8 MLRA 8 Sandstone and shale hills and valleys 49,565 3.9 MLRA 9 Central Mississippi Valley, Western Part 23,769 4.0
 Nitrate-N yield per row crop acre (lb N/acre/yr) Nitrate-N yield per tile drained acre (lb N/acre/yr) Nitrate-N yield from non-tiled land (lb N/acre/yr) MLRA 1 Northern Illinois drift plain 288, MLRA 2 Northeastern Illinois heavy till plain 2,063, MLRA 3 Northern Mississippi Valley 20, MLRA 4 Deep loess and drift 5,437, MLRA 5 Claypan 310, MLRA 6 Thin loess and till 226, MLRA 7 Central Mississippi Valley, Northern Part 1,284, MLRA 8 Sandstone and shale hills and valleys 49, MLRA 9 Central Mississippi Valley, Western Part 23,")
18
What can we do in agriculture? given, – it is not typically over fertilization based on current rates and yields – may be zero or negative N & P balances in some areas of the tile drained Midwest three types of conservation practices could help – nutrient-use efficiency (4Rs) – in-field management – off-site measures
 – in-field management – off-site measures.")
19
Woodchip bioreactors

20
Tile installation is faster than ever Pattern systems on 25 m spacing Annual ryegrass and radish - aerial seeding 09-08-12 10-08-1211-08-12

21
Nitrogen costs per acre Practice/ScenarioCost Per Acre Notes Reducing N rate from background to the MRTN (10% of acres) -$8Reduce N rates (20 pounds) Nitrification inhibitor with all fall applied fertilizer on tile- drained corn acres $7Cost of inhibitor Split (50%) fall and spring (50%) on tile-drained corn acres $17Additional field pass, switch to N solutions Fall to spring on tile-drained corn acres $18Switch to N solutions, higher ammonia price, additional application costs Cover crops on all corn/soybean tile-drained acres $29Aerial applications of cereal rye Cover crops on all corn/soybean non-tiled acres $29Aerial applications of cereal rye Bioreactors on 50% of tile-drained land $17Upfront costs of $133 per acre Wetlands on 25% of tile-drained land $605% of farmland out of production Major cost is land ($11,000) Buffers on all applicable crop land (reduction only for water that interacts with active area) $294 per buffer acre Land costs plus $50 planting, $10 yearly maintenance Perennial/energy crops equal to pasture/hay acreage from 1987 $86Less profit compared to corn-soybean rotation Perennial/energy crops on 10% of tile-drained land $86Less profit compared to corn-soybean rotation Edge-of- field Land use change In-field
 -$8Reduce N rates (20 pounds) Nitrification inhibitor with all fall applied fertilizer on tile- drained corn acres $7Cost of inhibitor Split (50%) fall and spring (50%) on tile-drained corn acres $17Additional field pass, switch to N solutions Fall to spring on tile-drained corn acres $18Switch to N solutions, higher ammonia price, additional application costs Cover crops on all corn/soybean tile-drained acres $29Aerial applications of cereal rye Cover crops on all corn/soybean non-tiled acres $29Aerial applications of cereal rye Bioreactors on 50% of tile-drained land $17Upfront costs of $133 per acre Wetlands on 25% of tile-drained land $605% of farmland out of production Major cost is land ($11,000) Buffers on all applicable crop land (reduction only for water that interacts with active area) $294 per buffer acre Land costs plus $50 planting, $10 yearly maintenance Perennial/energy crops equal to pasture/hay acreage from 1987 $86Less profit compared to corn-soybean rotation Perennial/energy crops on 10% of tile-drained land $86Less profit compared to corn-soybean rotation Edge-of- field Land use change In-field")
22
Phosphorus costs per acre Practice/ScenarioCost Per Acre Notes Reduce tillage -$16Eliminate one pass of heavy equipment, no change in yield No P fertilizer on 12.5 million ac of CS fields with soil test P above maintenance level for average of 6 years -$15Cost of six years of P fertilizer averaged over 20 years. Cover crops on corn/soybean tile-drained acres $29Aerial applications of cereal rye Cover crops on corn/soybean non-tiled acres $29Aerial applications of cereal rye Bioreactors on 50% of tile-drained land $17Upfront costs of $133 per acre Wetlands on 25% of tile-drained land $605% of farmland out of production Major cost is land ($11,000) Buffers on all applicable crop land (reduction only for water that interacts with active area) $294 per buffer acre Land costs plus $50 planting, $10 yearly maintenance Perennial/energy crops equal to pasture/hay acreage from 1987 $86Less profit compared to corn-soybean rotation Perennial/energy crops on 10% of tile-drained land $86Less profit compared to corn-soybean rotation Edge-of- field Land use change In-field
 Buffers on all applicable crop land (reduction only for water that interacts with active area) $294 per buffer acre Land costs plus $50 planting, $10 yearly maintenance Perennial/energy crops equal to pasture/hay acreage from 1987 $86Less profit compared to corn-soybean rotation Perennial/energy crops on 10% of tile-drained land $86Less profit compared to corn-soybean rotation Edge-of- field Land use change In-field.")
23
Example Statewide Results for N Practice/ScenarioNitrate- N reduction per acre (%) Nitrate- N reduced (million lb N) Nitrate-N Reduction % (from baseline) Cost ($/lb N removed) Baseline410 Reducing N rate from background to the MRTN (10% of acres) 10 2.3 0.6-4.25 Nitrification inhibitor with all fall applied fertilizer on tile-drained corn acres 10 4.3 1.0 2.33 Split (50%) fall and spring (50%) on tile-drained corn acres 7.5 to 10 13 3.1 6.22 Fall to spring on tile-drained corn acres 15 to 20 26 6.4 3.17 Cover crops on all corn/soybean tile-drained acres 30 84 20.5 3.21 Cover crops on all corn/soybean non-tiled acres 30 33 7.9 11.02 Bioreactors on 50% of tile-drained land 40 56 13.6 1.38 Wetlands on 25% of tile-drained land 40 28 6.8 5.06 Buffers on all applicable crop land (reduction only for water that interacts with active area) 90 36 8.7 1.63 Perennial/energy crops equal to pasture/hay acreage from 1987 90 10 2.6 9.34 Perennial/energy crops on 10% of tile-drained land 90 25 6.1 3.18 Point source reduction to 10 mg nitrate-N/L 14 3.4 3.30 Point source reduction in N due to biological nutrient removal for P 8 1.8 Point source Edge-of- field Land use change In-field
 Nitrate- N reduced (million lb N) Nitrate-N Reduction % (from baseline) Cost ($/lb N removed) Baseline410 Reducing N rate from background to the MRTN (10% of acres) Nitrification inhibitor with all fall applied fertilizer on tile-drained corn acres Split (50%) fall and spring (50%) on tile-drained corn acres 7.5 to Fall to spring on tile-drained corn acres 15 to Cover crops on all corn/soybean tile-drained acres Cover crops on all corn/soybean non-tiled acres Bioreactors on 50% of tile-drained land Wetlands on 25% of tile-drained land Buffers on all applicable crop land (reduction only for water that interacts with active area) Perennial/energy crops equal to pasture/hay acreage from Perennial/energy crops on 10% of tile-drained land Point source reduction to 10 mg nitrate-N/L Point source reduction in N due to biological nutrient removal for P Point source Edge-of- field Land use change In-field")
24
Example Statewide Results for P Practice/ScenarioTotal P reduction per acre (%) Total P reduced (million lb P) Total P Reduction % (from baseline) Cost ($/lb P removed) Baseline37.5 Convert 1.8 million acres of conventional till eroding >T to reduced, mulch or no-till 50 1.8 5.0-16.60 P rate reduction on fields with soil test P above the recommended maintenance level 7 1.9 5.0-48.75 Cover crops on all corn/soybean acres 30 4.812.8130.40 Cover crops on 1.6 million acres eroding>T currently in reduced, mulch or no-till 501.9 5.0 24.50 Wetlands on 25% of tile-drained land 0 0 0.0 Buffers on all applicable crop land 25-504.812.9 11.97 Perennial/energy crops equal to pasture/hay acreage from 1987 900.9 2.5 102.30 Perennial/energy crops on 1.6 million acres>T currently in reduced, mulch or no-till 903.5 9.0 40.40 Perennial/energy crops on 10% of tile- drained land 500.3 0.8250.07 Point source reduction to 1.0 mg total P/L (majors only) 8.322.1 13.71 Point source Edge- of-field Land use change In-field USLE method
 Total P reduced (million lb P) Total P Reduction % (from baseline) Cost ($/lb P removed) Baseline37.5 Convert 1.8 million acres of conventional till eroding >T to reduced, mulch or no-till P rate reduction on fields with soil test P above the recommended maintenance level Cover crops on all corn/soybean acres Cover crops on 1.6 million acres eroding>T currently in reduced, mulch or no-till Wetlands on 25% of tile-drained land Buffers on all applicable crop land Perennial/energy crops equal to pasture/hay acreage from Perennial/energy crops on 1.6 million acres>T currently in reduced, mulch or no-till Perennial/energy crops on 10% of tile- drained land Point source reduction to 1.0 mg total P/L (majors only) Point source Edge- of-field Land use change In-field USLE method")
25
Example Statewide N & P Scenarios NameCombined Practices and/or Scenarios Nitrate-N (% reduction) Total P (% reduction) Cost of Reduction ($/lb) Annualized Costs (million $/year) NP1 MRTN, fall to spring, bioreactors 50%, wetlands 25%, no P fert. on 12.5 million ac above STP maintenance, reduced till on 1.8 million ac conv. till eroding > T, buffers on all applicable lands, point source to 1.0 mg TP/L and 10 mg nitrate-N/L 3545**383 NP2 MRTN, fall to spring, bioreactors 50%, no P fert. on 12.5 million ac above STP maintenance, reduced till on 1.8 million ac conv. till eroding > T, cover crops on all CS, point source to 1.0 mg TP/L and 10 mg nitrate-N/L 45 **810 NP3 MRTN, fall to spring, bioreactors 15%, no P fert. on 12.5 million ac above STP maintenance, reduced till on 1.8 million ac conv. till eroding > T, cover crops on 87.5% of CS, buffers on all applicable lands, perennial crops on 1.6 million ac >T, and 0.9 million additional ac. 45 **791 NP4 MRTN, fall to spring N, bioreactors 35%, no P fert. on 12.5 million ac above STP maintenance, reduced till on 1.8 million ac conv. till eroding > T, buffers on 80% of all applicable land 20 ** 48 NP5 MRTN, fall to spring N, bioreactors 30%, wetlands 15%, no P fert. on 12.5 million ac above STP maintenance, reduced till on 1.8 million ac conv. till eroding > T, point source to 1.0 mg TP/L and 10 mg nitrate-N/L on 45% of discharge 20 ** 66 NP6 MRTN, fall to spring N, no P fert. on 12.5 million ac above STP maintenance, reduced till on 1.8 million ac conv. till eroding > T, cover crops on 1.6 million ac eroding >T and 40% of all other CS 2420** 244

26
Combined scenarios with costs by practice (million $ per year) PracticeNP1NP2NP3NP4NP5NP6 MRTN-9.6 N fertilizer timing82 Bioreactors77 235446 Wetlands140 Buffers58 46 Cover crops 625547 296 Perennials 215 Reduced P fertilizer-94 Reduced tillage-30 Point source P114 51 Point source N46 21 Sum3838107914866244
 PracticeNP1NP2NP3NP4NP5NP6 MRTN-9.6 N fertilizer timing82 Bioreactors Wetlands140 Buffers58 46 Cover crops Perennials 215 Reduced P fertilizer-94 Reduced tillage-30 Point source P Point source N46 21 Sum")
27
http://www.epa.state.il.us/water/nutrient/index.html

28
IEPA and Dept. of Agriculture two agencies have led process series of meetings with stakeholders in state I made presentations as science assessment was developed more recent meetings to develop strategy final meeting in May – drafts of strategy have been released for comment three groups represented – agriculture, point source, and environmental groups

29
Public meetings

30
Agriculture Subcommittee Survey PracticeMedian adoption rate (%) N reduction (million lb N) P reduction (million lb P) Timing change (either fall to spring or fall/spring/side dress) 65170 Cover crops – tile drained corn and soybean acres 25210.5 Ephemeral gulley control65?? Buffers on ag streams50132.4 Wetlands on tile drained acres10110 No P fertilizers with STP above maintenance 7801.5 No manure application on frozen ground 93?? Convert 1.8 million acres of conventional till eroding > T to reduced, mulch, or no till 6001.1 Summed60 (15%)5.5 (15%)
5.5 (15%).")
31
Conclusions no simple solution, or one method to achieve goals will take a range of point and non point source reductions to meet targets initial focus could be: – point source P reductions ($114 million per year) – tile-drained nitrate reductions by agriculture (range of costs) strategy to get us started
 – tile-drained nitrate reductions by agriculture (range of costs) strategy to get us started")
Similar presentations


>")


