Download presentation
Presentation is loading. Please wait.

1
OTT ADC Acoustic Digital Current Meter: Description of meter and Results of USGS testing
Dan Wagner Hydrologist Arkansas Water Science Center Hydroacoustics Webinar May 24, 2010

2
Outline Description of ADC Results of USGS Testing
New USGS Firmware / enhancements In this presentation, I’ll describe the ADC, discuss results of USGS testing of the ADC, and show enhancements that have been made to the ADC with a new “USGS Firmware,” currently in Beta testing.

3
ADC History Released in USA December 2007
Testing by HIF, HAWG, and WSCs from New USGS Firmware currently in Beta Testing USGS testing was performed by HIF, HAWG, and Pennsylvania, Illinois, Florida, Arkansas, Alaska, Oregon, and Maine WSCs. New Firmware version

4
System Components Figure courtesy of OTT 2 6 MHZ transducers
Thermistor Pressure sensor- 0 to 5m (16.4 ft) depth Meter will work in 0.15’ of water (2”) Figure courtesy of OTT
 depth. Meter will work in 0.15’ of water (2 ) Figure courtesy of OTT.")
5
Handheld Display Mini-USB to USB cable for downloading w/ PC (no serial cables!) Robust sensor cable connection Big keys, beep when key pressed Separate function keys for toggling through menus Sealed, battery accessible only by opening case (send to factory) Rechargeable battery not accessible unless sent back to factory-still a concern amongst some users, would like to see an accessible battery compartment like with a laptop, where the rechargeable battery could be replaced. Battery life should be 20+ hours of use, 500 charging cycles (basically, days without charging and several years’ worth of charges) Figure courtesy of OTT
 Rechargeable battery not accessible unless sent back to factory-still a concern amongst some users, would like to see an accessible battery compartment like with a laptop, where the rechargeable battery could be replaced. Battery life should be 20+ hours of use, 500 charging cycles (basically, days without charging and several years’ worth of charges) Figure courtesy of OTT.")
6
Handheld Display Operation
Depending on the display screen, commands appear above the function keys-press the appropriate key to enter the command Figure courtesy of OTT

7
Display Screen Note the use of familiar symbols—PC-like progress bar, cell-phone like “signal quality” bars for correlation, battery symbol (9,1,2) Note that the ADC tells you a target depth and the actual depth so that the user can position the sensor at the appropriate position in the vertical without even having to look at the wading rod (3,4) Also the ADC tells you the distance of your vertical from the start point and shows a graph of the same (6,7) Velocity is in live streaming mode unless you turn that off…it’s nice for checking for QA/QC probs behind cobbles and boulders Figure courtesy of OTT
 Also the ADC tells you the distance of your vertical from the start point and shows a graph of the same (6,7) Velocity is in live streaming mode unless you turn that off…it’s nice for checking for QA/QC probs behind cobbles and boulders. Figure courtesy of OTT.")
8
Location of Sample Volume
Sample volume still 10 cm away from transducers, but in front of meter instead of to the side. Sample volume much larger than that of the FlowTracker…this coupled with the higher acoustic frequency means the ADC should have much less SNR issues in low backscattering environments. ADV ADC

9
Measuring Principle Two 6 MHz acoustic transducers
Large sample volume located in front of sensor Large sample volume reduces potential signal-to- noise (SNR) issues, reduces error with flow angles Two sample volumes Improves data precision Internal cross correlation calculation verifies measurement accuracy and identifies potential boundary issues 4 in 2 in Sensor head Sample volume 2 Sample volume 1 0.4 in Each transducer works both as a transmitter and receiver Large sample – which is controlled by the receiving time window of the timing controller Large sample volume reduces signal to noise issues because scatters, or particles in the water column, contribute a stronger echo Two sample volumes – velocity measurement from the sample volumes are averaged together to produce a single in-line velocity measurement. Using two sample volumes improves precision by averaging measurements collection from each and makes it possible to offset the sample volume from the centerline of the probe Robust design that reduces mechanical impact Figure courtesy of OTT
 issues, reduces error with flow angles. Two sample volumes. Improves data precision. Internal cross correlation calculation verifies measurement accuracy and identifies potential boundary issues. 4 in. 2 in. Sensor head. Sample volume 2. Sample volume in. Each transducer works both as a transmitter and receiver. Large sample – which is controlled by the receiving time window of the timing controller. Large sample volume reduces signal to noise issues because scatters, or particles in the water column, contribute a stronger echo. Two sample volumes – velocity measurement from the sample volumes are averaged together to produce a single in-line velocity measurement. Using two sample volumes improves precision by averaging measurements collection from each and makes it possible to offset the sample volume from the centerline of the probe. Robust design that reduces mechanical impact. Figure courtesy of OTT.")
10
Measuring Principle 1. Transmit – Receive - Digitize Break
Cross Correlation Check for similarities Calculation of time shift An ultrasonic burst is sent into the media from beam 1 and beam 2 simultaneously All particles in the measurement path reflect a small amount of the ultrasonic signal Depending on the shape and size a particular signal results The multitude of the reflected signals result in a reflection pattern which is then saved to the DSP After a certain amount of time a second burst is sent into the medium A second reflection pattern is generated. This pattern is distorted due to slightly different reflections. This is because some particles have been turning around and have another reflection or some particles are no longer in the measurement range. The DSP checks both received reflection patterns for similarities using the cross correlation method All existing signal differences are rejected so that two similar but offset signal patterns are left for velocity evaluation Dt Calculation of flow velocity Slide courtesy of OTT

11
Depth Sensor Calibrate by zeroing to atmospheric pressure on site (raise out of water to calibrate) Get depth for each vertical by first lowering meter to bottom, rod offset computed automatically Hand-held display shows target depth and actual depth for velocity measurement in vertical depending on the velocity method selected by the user. Depth sensor can be turned off with new firmware The depth sensor is easy to use, but some testers didn’t like it, and wanted to be able to enter the depths manually as they do with other current meters. The new USGS firmware allows the user to turn off the depth sensor prior to starting the discharge measurement. One application of the depth sensor is in making mid-section measurements from a bridge with a long rod (see picture). While not commonly used in the USA, this practice is common in Europe.
. While not commonly used in the USA, this practice is common in Europe.")
12
QA/QC Figure courtesy of OTT

13
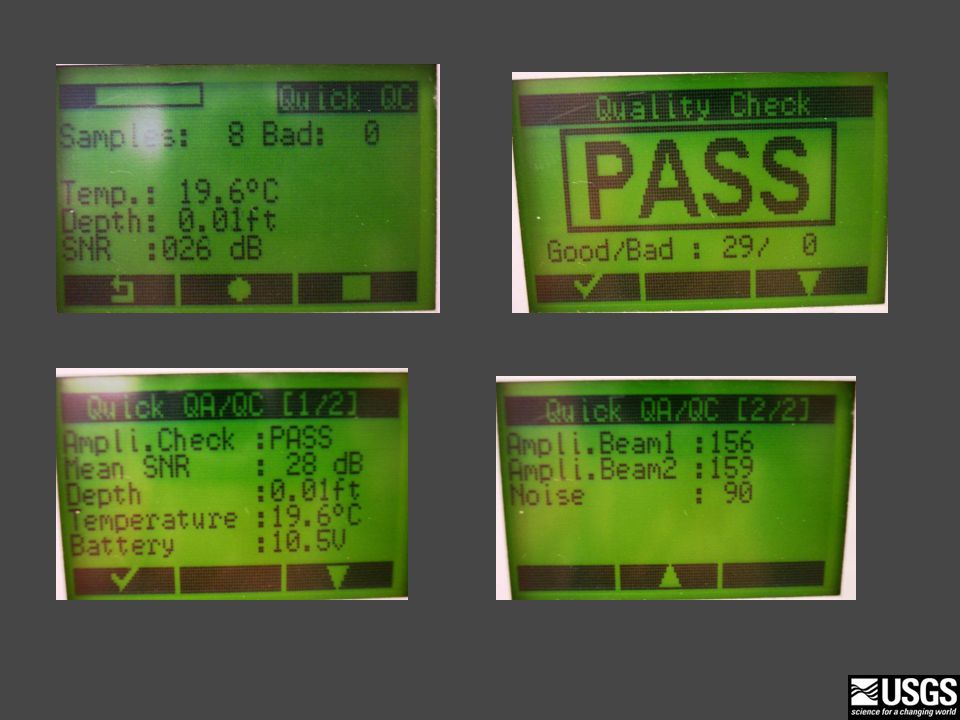
QA/QC checks With new USGS firmware, a Quick QA/QC check is performed in office (similar to ADV beam check, can print results) Pre-measurement QA/QC check is logged with measurement file and appears on printout Prior to the recent release of the new USGS firmware, the ADC had no logged QA/QC check.

14
Screen shots of the handheld display during QA/QC and depth sensor calibration procedures

17
Qreview Software-Data Download
Select from files on ADC on left hand side…right hand side shows ADC files currently in selected directory in PC. Nice windows format

18
Measurement Review This is the new & improved look of Qreview…note the color-coded %Q/vertical and the QA/QC coloration on the Depth window. Use the edit function to delete verticals, change vertical depths (if they were incorrectly entered)
")
19
QA/QC check as it appears in QReview

20
Arkansas Test Sites Location of Arkansas’ test sites, in the NW part of the state. Waters typically clear with low suspended solids (and typically low SNRs when measured with ADV), bedrock lined channels w/ boulders, cobbles, gravel. N
, bedrock lined channels w/ boulders, cobbles, gravel. N.")
21
Vmean, Test Measurements
Site Vmean,ADV Vmean,ADC % error Mud Creek 0.03 0.014 -53.3 Richland Creek 0.39 0.45 +15.4 Brush Creek 0.46 0.42 -8.7 Baron Fork 0.49 0.44 -10.2 Flint Creek nr. West Siloam Springs 0.60 0.58 -3.3 Flint Creek nr. Springtown 0.80 0.77 The largest percent differences in Arkansas’ test measurements were at low velocities…and the absolute differences were small.

22
Vmean, Test Measurements
Site Vmean,ADV Vmean,ADC % error Illinois River nr. Savoy 0.84 0.90 +7.1 Bear Creek 0.85 -1.2 Middle Fork White River 1.22 1.14 -6.6 Osage Creek 1.47 1.45 -1.4 Yocum Creek 1.97 1.95 -1.0 White River nr. Fayetteville 2.04 2.05 +0.49

23
Percent Difference of Velocity Measured with ADC Relative to Velocity Measured with ADV
Plotting percent difference of mean velocity measured with the ADC relative to that measured with the ADV versus the mean velocity measured with the ADC for Arkansas’ test measurements produces a trend similar to other tests (see next slide)
")
24
Same as previous slide but for all test measurements
Same as previous slide but for all test measurements. Keep in mind that most of the measurements were compared with measurements made with SonTek FlowTracker ADVs, and as with most comparisons, we don’t really know the “TRUE” velocity or discharge. Figure courtesy of Kevin Oberg, OSW

25
Basically, the same plot as previous slide but showing % difference of ADC from ADV vs. Discharge instead of velocity. Figure courtesy of Kevin Oberg, OSW

26
Regressing the mean velocities from ADC test measurements against those from reference measurements produces a very linear relationship, as we would expect. Figure courtesy of Kevin Oberg, OSW

27
Depths measured with the ADC’s depth sensor often differed slightly from those recorded by technicians in ADV or Pygmy meter measurements. Keep in mind that wading rods have error and sometimes bases are not screwed on all the way…also the technician is making a judgement call on anything less than a 0.1’ resolution in depth, possibly introducing error. Figure courtesy of Kevin Oberg, OSW

28
Initial HIF tow-tank testing indicated that at low velocity, measurements with the ADC were biased low. OTT has since put much effort into correcting the low velocity bias with new firmware fixes and recent tests at HIF indicate that these fixes have improved the low velocity comparisons.

29
Notice that the percent error of ADC velocity doesn’t exceed 5% between -50 and +70 degrees…the ADC handles flow angles well!

30
Same as previous slide, but horizontal angles. Point is,
Figure courtesy of Kirk Thibideaux, HIF

31
ADC Pros/Cons-prior to USGS firmware
Depth Sensor Sample volume in front of meter Rugged Construction, cabling Rechargeable battery 2 beams-improved performance in environments with low SNR, angles Live velocity reading-can help with meter placement Depth Sensor Sample volume in front of meter Rechargeable battery (?) Can’t edit erroneous stations until reviewing the measurement in Qreview Lack of beam check (“bucket test”) and/or quick field QA/QC check that is logged with measurement Lack of QA/QC warnings during measurement (i.e., for 0.2/0.8 velocity discrepancies, bad correlation resulting from bad boundary conditions -The depth sensor was welcomed by some users, despised by others. The new USGS firmware allows it to be turned off. -The rechargeable battery seems to perform very well. Some users remain skeptical of its long-term performance and the fact that the ADC has to be sent to the OTT factory in Loveland, Colorado for battery replacement. -The sample volume being in front of the meter was helpful in some stream bottom conditions but faces the same issues as a FlowTracker does when placed less than 10 cm from an obstruction or a vertical wall. -The new USGS firmware didn’t address the issue of being able to delete an erroneous station (i.e., technician enters the wrong depth for a vertical, with the ADV, they can toggle back to that vertical and make the change during the discharge measurement; with the ADC, these changes can only be made in Qreview) -Prior to the new USGS firmware, the ADC had no pre-deployment beam check or field QA/QC check that was logged with the measurement. Also, the old firmware lacked QA/QC warnings during the discharge measurement that would alert the technician to possible QA/QC issues.
 Can’t edit erroneous stations until reviewing the measurement in Qreview. Lack of beam check ( bucket test ) and/or quick field QA/QC check that is logged with measurement. Lack of QA/QC warnings during measurement (i.e., for 0.2/0.8 velocity discrepancies, bad correlation resulting from bad boundary conditions. -The depth sensor was welcomed by some users, despised by others. The new USGS firmware allows it to be turned off. -The rechargeable battery seems to perform very well. Some users remain skeptical of its long-term performance and the fact that the ADC has to be sent to the OTT factory in Loveland, Colorado for battery replacement. -The sample volume being in front of the meter was helpful in some stream bottom conditions but faces the same issues as a FlowTracker does when placed less than 10 cm from an obstruction or a vertical wall. -The new USGS firmware didn’t address the issue of being able to delete an erroneous station (i.e., technician enters the wrong depth for a vertical, with the ADV, they can toggle back to that vertical and make the change during the discharge measurement; with the ADC, these changes can only be made in Qreview) -Prior to the new USGS firmware, the ADC had no pre-deployment beam check or field QA/QC check that was logged with the measurement. Also, the old firmware lacked QA/QC warnings during the discharge measurement that would alert the technician to possible QA/QC issues.")
32
Software Enhancements
Enhanced quality assurance Including pre-deployment quality check and field quality check Ability to enter rated Q Expanded character limits for station name and number and addition of measurement number Computation and recording of averaged flow angles On-screen warning messages, a.k.a., Measurement Guidance Provide user with options to improve measurement results Option to turn off depth sensor Enhanced measurement review Detailed discharge and quality check reports Warning and potential quality issue logs One-second time series data OSW compiled a list of desired enhancements to the ADC based on tester’s comments. This is a list of the software enhancements that are part of the new “USGS Firmware.”

33
New ADC QA/QC Warnings The QA/QC warnings in the new firmware are similar to those provided in the familiar ADV Figure courtesy of OTT

34
Questions? HIF does not currently stock the ADC, but plans to move towards carrying the ADC in their warehouse after software improvements to help low velocity bias are tested.

Similar presentations


 Weather Lesson 5: Station Information April 2014.>")

