Download presentation
Presentation is loading. Please wait.

1
Clu-In 9/12/08 Triad: Beyond Characterization to Long- Term Management of Groundwater Contaminant Plumes Dr. Mark Kram, Groundswell Gregg Gustafson, INW Clu-In Webinar Workshop 12 September 2008 1-1

2
Clu-In 9/12/08 TECHNICAL OBJECTIVES Present a comprehensive approach to optimized characterization/remediation design/LTM Take Triad to next level –Use Triad based approaches to develop CSM –Use CSM to develop remediation and monitoring strategy –Integrate Triad/CSM/LTM components into streamlined process –Work towards single mobilization solutions 1-2

3
Clu-In 9/12/08 OUTLINE Innovative Direct Push Characterization Techniques –Chemical Distributions (MIP, LIF, FFD, UVOST, GeoVIS, ConeSipper, Waterloo APS Profiler) –Hydraulic Parameter Distributions (HRP, HPT) –3D Flux Model Generation LTM Network Design –Spatial Considerations (2D/3D) –Well Design (ASTM vs. WDS) Sensor Technologies –Desktop Monitoring –Analytes (Today and in Near Future) –Components of a Wireless Telemetry System New LTM Approaches –Automation –Rapid Reporting/Assessment/Lines of Evidence For additional information: http://clu-in.org/char/technologies/dpanalytical.cfm 1-3
 Sensor Technologies –Desktop Monitoring –Analytes (Today and in Near Future) –Components of a Wireless Telemetry System New LTM Approaches –Automation –Rapid Reporting/Assessment/Lines of Evidence For additional information:")
4
Clu-In 9/12/08 Adapted from CH2MHill, AFCEE Overview of an L&D Plume: Massachusetts Military Reservation (MMR) Site 1-4
 Site 1-4")
5
Clu-In 9/12/08 Numerous large & dilute TCE plumes Some plumes 2 miles long Using Pump & Treat for 10 years Over $400 million has been spent to date on investigation and cleanup The estimated total long term cost: $850 million Current status: 12 plumes require LTM (at least) Massachusetts Military Reservation Adapted from CH2MHill, AFCEE 1-5
 Massachusetts Military Reservation Adapted from CH2MHill, AFCEE 1-5")
6
Clu-In 9/12/08 SEEPAGE VELOCITY AND FLUX Seepage velocity ( ): K i where: K = hydraulic conductivity = ------ (length/time) i = hydraulic gradient = effective porosity Contaminant flux (F): F = [X]where: = seepage velocity (length/time; m/s) (mass/length 2 -time; mg/m 2 -s) [X] = concentration of solute (mass/volume; mg/m 3 ) 1-6
![Clu-In 9/12/08 SEEPAGE VELOCITY AND FLUX Seepage velocity ( ): K i where: K = hydraulic conductivity = (length/time) i = hydraulic gradient = effective porosity Contaminant flux (F): F = [X]where: = seepage velocity (length/time; m/s) (mass/length 2 -time; mg/m 2 -s) [X] = concentration of solute (mass/volume; mg/m 3 ) 1-6](http://images.slideplayer.com/15/4560514/slides/slide_6.jpg "Clu-In 9/12/08 SEEPAGE VELOCITY AND FLUX Seepage velocity ( ): K i where: K = hydraulic conductivity = (length/time) i = hydraulic gradient = effective porosity Contaminant flux (F): F = [X]where: = seepage velocity (length/time; m/s) (mass/length 2 -time; mg/m 2 -s) [X] = concentration of solute (mass/volume; mg/m 3 ) 1-6")
7
Clu-In 9/12/08 CONCENTRATION VS. FLUX Length F, 1-7

8
Clu-In 9/12/08 CONCENTRATION VS. FLUX High Concentration High Risk!! Concentration and Hydraulic Component Length F, 1-8

9
Clu-In 9/12/08 STREAMLINED APPROACH Plume Delineation MIP, LIF, ConeSipper, Field Lab, etc. 2D/3D Concentration Representations CPT Data for Well Design Hydro Assessment High-Res Piezocone (2D/3D Flow Field, K, head, eff. Por.) Conventional Approaches (e.g., Wells, Aq. Tests, etc.) LTM Network Design WDS based on CPT Data G.S.D. via ASTM D5092 Field Installations (Clustered Short Screened Wells) Surveys (Lat/Long/Elevation) GMS Interpolations (, F), Initial Models 1-9
 Conventional Approaches (e.g., Wells, Aq. Tests, etc.) LTM Network Design WDS based on CPT Data G.S.D. via ASTM D5092 Field Installations (Clustered Short Screened Wells) Surveys (Lat/Long/Elevation) GMS Interpolations (, F), Initial Models 1-9.")
10
Clu-In 9/12/08 GW Plume Characterization Strategy Wiedemeier et al., 1996 BC D 3D – Depth Specific Info; Wells or Continuous Profile 1-10

11
Clu-In 9/12/08 GW Plume Characterization Strategy Wiedemeier et al., 1996 BC D 3D – Depth Specific Info; Wells or Continuous Profile 1-11

12
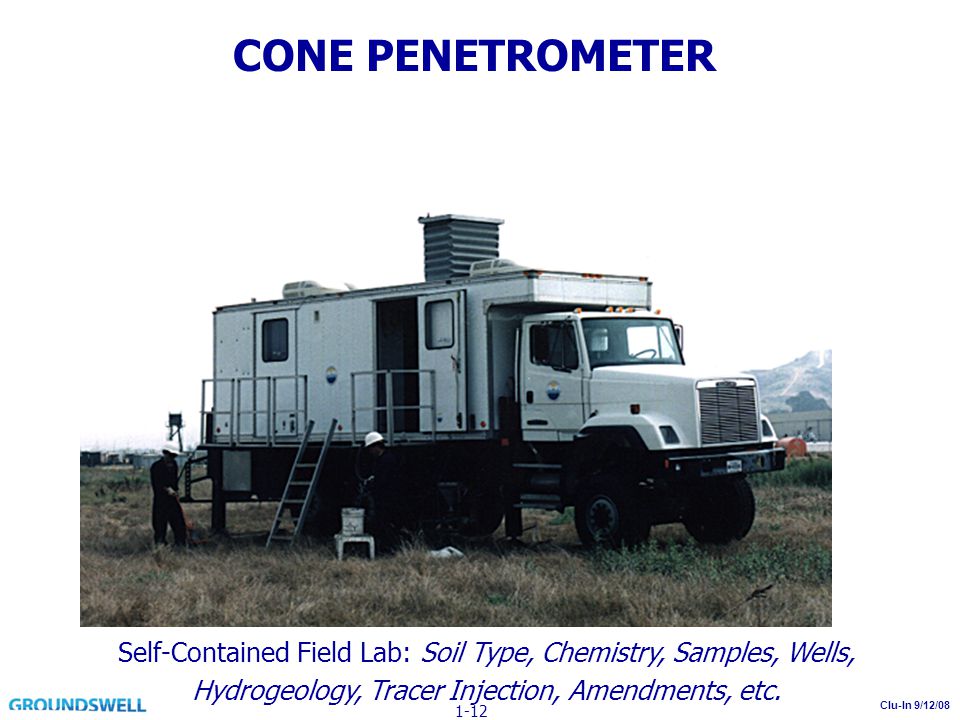
Clu-In 9/12/08 CONE PENETROMETER Self-Contained Field Lab: Soil Type, Chemistry, Samples, Wells, Hydrogeology, Tracer Injection, Amendments, etc. 1-12
13
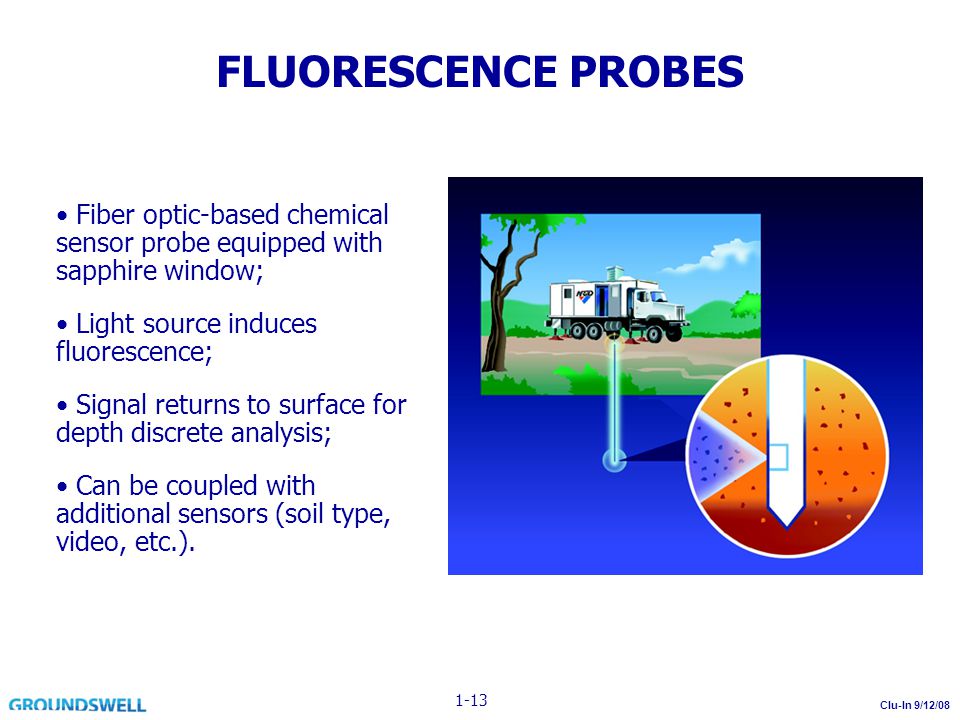
Clu-In 9/12/08 FLUORESCENCE PROBES Fiber optic-based chemical sensor probe equipped with sapphire window; Light source induces fluorescence; Signal returns to surface for depth discrete analysis; Can be coupled with additional sensors (soil type, video, etc.). 1-13
14
Clu-In 9/12/08 1-14

15
Clu-In 9/12/08 LIF Data Remediation Performance (Before and After Steam Enhanced Extraction) 1-15
 1-15")
16
Clu-In 9/12/08 FLUORESCENCE PROBES Pro: NAPL evidence based on sensitive UV fluorescence of fuel constituents or co-mingled materials (multi-ring fuel compounds, etc.); Can rapidly measure in real time; Depth discrete signals; Can be coupled with lithologic sensors for correlation, well design; Good screening method with high resolution; Can use several off-the-shelf energy sources (UVOST, FFD, LIF); Cal EPA Certification and ASTM Standard. Con: Limited by lithology; False negatives and positives possible due to wavelength dependency; Not analyte-specific; Semi-quantitative so requires confirmation samples. 1-16

17
Clu-In 9/12/08 GeoVIS 1-17

18
Clu-In 9/12/08 Box is 2.5mm x 2mm 1-18

19
Clu-In 9/12/08 GeoVIS Pro: Unique perspective regarding subsurface reality; Only true NAPL confirmation tool; Can generate continuous graphic profile; Can provide some hydro info (porosity, g.s.d., NAPL saturation). Con: Rate of data collection limited by ability to visibly process information; Transparent NAPL droplets can be present and not detectable in current configuration; Limited by lithology; Porosity estimates poor in silty sands; Semi-quantitative assessment; Pressure or heat front may force droplets away from window. 1-19

20
Clu-In 9/12/08 Membrane Interface Probe Screening tool with semi-quantitative capabilities. Membrane is semi-permeable and is comprised of a thin film polymer impregnated into a stainless steel screen for support. The membrane is placed in a heated block attached to the probe and heated to approximately 100-120 degrees C. Analyses of vapors at surface via GC and various detectors. 1-20

21
Clu-In 9/12/08 1-21

22
Clu-In 9/12/08 MIP Pro: Excellent chemical screening tool; Can generate continuous profile or focus on specific depth; Analyte specific; Many types of analytes (VOCs, semi-VOCs); Can be coupled with lithologic sensors for correlation. Con: When operating with a non-continuous configuration, user needs to determine appropriate target sample depths while “on the fly”; Constant operational conditions not always possible; Bulk fluids can not travel across membrane; Semi-quantitative; Clogging and carry-over can occur (some work-arounds); Limited by lithology; Heat front or pressure front may inhibit membrane contact with contaminant. 1-22
; Limited by lithology; Heat front or pressure front may inhibit membrane contact with contaminant")
23
Clu-In 9/12/08 Soil-gas and water sampler; Pneumatic valving; 200 foot depth capacity; Inert gas used to move samples to surface; Up to 80ml samples; Downhole decontamination; Great for focused MIP confirmation. CONESIPPER 1-23

24
Clu-In 9/12/08 CONESIPPER Pro: Depth discrete samples Vapor and liquid samples Can be coupled with rapid analyses (min. holding time concern) Excellent confirmation for MIP, UV Fluorescence, etc. Con: Decontamination concerns Single depth sample per push (not continuous) Not typically coupled with sensors (exceptions) Clogging can occur Limited by lithology (fines can be difficult) Pressure or heat front may cause displacement 1-24
 Excellent confirmation for MIP, UV Fluorescence, etc. Con: Decontamination concerns Single depth sample per push (not continuous) Not typically coupled with sensors (exceptions) Clogging can occur Limited by lithology (fines can be difficult) Pressure or heat front may cause displacement")
25
Clu-In 9/12/08 Collect samples Couple with field analyses (GC, etc.) Measure head Measure index of K Measure physicochem properties (pH, conductance, D.O., redox, T) via in-line flow-through cell Can grout through tip WATERLOO APS ADVANCED PROFILING SYSTEM 1-25
 Measure head Measure index of K Measure physicochem properties (pH, conductance, D.O., redox, T) via in-line flow-through cell Can grout through tip WATERLOO APS ADVANCED PROFILING SYSTEM 1-25")
26
Clu-In 9/12/08 WATERLOO APS ADVANCED PROFILING SYSTEM 1-26

27
Clu-In 9/12/08 WATERLOO APS ADVANCED PROFILING SYSTEM Pro: Depth discrete samples Vapor and liquid samples Can be coupled with rapid analyses (min. holding time concern) Hydro info (head, relative K) Excellent confirmation and CSM tool Con: Limited by lithology K values not quantified, so limited modeling capabilities Pressure or heat front may cause displacement 1-27
 Hydro info (head, relative K) Excellent confirmation and CSM tool Con: Limited by lithology K values not quantified, so limited modeling capabilities Pressure or heat front may cause displacement")
28
Clu-In 9/12/08 High-Resolution Piezocone Direct-Push (DP) Sensor Probe that Converts Pore Pressure to Water Level or Hydraulic Head Head Values to ± 0.08ft (to >60’ below w.t.) Can Measure Vertical Gradients Simultaneously Collect Soil Type and K K from Pressure Dissipation, Soil Type Minimal Worker Exposure to Contaminants System Installed on NAVFAC SCAPS Licensed to AMS Custom Transducer 1-28
 Sensor Probe that Converts Pore Pressure to Water Level or Hydraulic Head Head Values to ± 0.08ft (to >60’ below w.t.) Can Measure Vertical Gradients Simultaneously Collect Soil Type and K K from Pressure Dissipation, Soil Type Minimal Worker Exposure to Contaminants System Installed on NAVFAC SCAPS Licensed to AMS Custom Transducer 1-28")
29
Clu-In 9/12/08 PIEZOCONE OUTPUT Final Pressures Dissipation Tests 1-29

30
Clu-In 9/12/08 HRP TESTS (6/13/06) Head Values for Piezocone Displays shallow gradient W1 W3 W2 1-30
 Head Values for Piezocone Displays shallow gradient W1 W3 W2 1-30")
31
Clu-In 9/12/08 FIELD EFFORTS Site Characterization with High Resolution Piezocone 11/22/04 Well Development & Hydraulic Test 8/24/05 Installation ¾” Wells 7/28/05 1 st Wells 12/9/04 Field Demo 6/13/06 1-31

32
Clu-In 9/12/08 HEAD DETERMINATION (3-D Interpolations) Shallow gradient (5.49-5.41’; 5.45-5.38’ range in clusters over 25’) In practice, resolution exceptional (larger push spacing) PiezoWells 1-32
 Shallow gradient ( ’; ’ range in clusters over 25’) In practice, resolution exceptional (larger push spacing) PiezoWells 1-32")
33
Clu-In 9/12/08 GMS MODIFICATIONS Gradient, Velocity and Flux Calculations Convert Scalar Head to Gradient [Key Step!] 1-33
![Clu-In 9/12/08 GMS MODIFICATIONS Gradient, Velocity and Flux Calculations Convert Scalar Head to Gradient [Key Step!] 1-33](http://images.slideplayer.com/15/4560514/slides/slide_33.jpg "Clu-In 9/12/08 GMS MODIFICATIONS Gradient, Velocity and Flux Calculations Convert Scalar Head to Gradient [Key Step!] 1-33")
34
Clu-In 9/12/08 GMS MODIFICATIONS Gradient, Velocity and Flux Calculations Convert Scalar Head to Gradient [Key Step!] 1-34
![Clu-In 9/12/08 GMS MODIFICATIONS Gradient, Velocity and Flux Calculations Convert Scalar Head to Gradient [Key Step!] 1-34](http://images.slideplayer.com/15/4560514/slides/slide_34.jpg "Clu-In 9/12/08 GMS MODIFICATIONS Gradient, Velocity and Flux Calculations Convert Scalar Head to Gradient [Key Step!] 1-34")
35
Clu-In 9/12/08 GMS MODIFICATIONS Gradient, Velocity and Flux Calculations Convert Scalar Head to Gradient [Key Step!] Merging of 3-D Distributions to Solve for Velocity Merging of Velocity and Concentration (MIP or Samples) Distributions to Solve for Contaminant Flux 1-35
![Clu-In 9/12/08 GMS MODIFICATIONS Gradient, Velocity and Flux Calculations Convert Scalar Head to Gradient [Key Step!] Merging of 3-D Distributions to Solve for Velocity Merging of Velocity and Concentration (MIP or Samples) Distributions to Solve for Contaminant Flux 1-35](http://images.slideplayer.com/15/4560514/slides/slide_35.jpg "Clu-In 9/12/08 GMS MODIFICATIONS Gradient, Velocity and Flux Calculations Convert Scalar Head to Gradient [Key Step!] Merging of 3-D Distributions to Solve for Velocity Merging of Velocity and Concentration (MIP or Samples) Distributions to Solve for Contaminant Flux 1-35")
36
Clu-In 9/12/08 VELOCITY DETERMINATION (cm/s) WellPiezo (mean K) mid 1 st row centerline 1-36
 WellPiezo (mean K) mid 1 st row centerline 1-36")
37
Clu-In 9/12/08 FLUX DETERMINATION (Day 49 Projection) WellPiezo (mean K) mid 1 st row centerline ug/ft 2 -day 1-37
 WellPiezo (mean K) mid 1 st row centerline ug/ft 2 -day 1-37")
38
Clu-In 9/12/08 MODELING Concentration and Flux 1-38

39
Clu-In 9/12/08 MODELING Concentration and Flux Well K mean K lc Ave K ug/ft 2 -day ppb 1-39

40
Clu-In 9/12/08 PERFORMANCE 1-40

41
Clu-In 9/12/08 FLUX CHARACTERIZATION Cost Comparisons “Apples to Apples” – HR Piez. with MIP vs. Wells, Aq. Tests, Samples 10 Locations/30 Wells 1-41

42
Clu-In 9/12/08 Early Savings of ~$1.5M to $4.8M FLUX CHARACTERIZATION Cost Comparisons 1-42

43
Clu-In 9/12/08 “Apples to Apples” – HR Piez. with MIP vs. Wells, Aq. Tests, Samples 10 Locations/30 Wells FLUX CHARACTERIZATION Time Comparisons 1-43

44
Clu-In 9/12/08 HIGH-RESOLUTION PIEZOCONE Pro: Rapid site characterization Depth discrete hydraulic characterization (can even determine whether confined) Vertically continuous soil type data Profiles of head, K, effective porosity, and 3D distributions of seepage velocity and flux now possible Significantly lower costs relative to conventional methods Greater accuracy and usefulness of transport models Data can be used for monitoring well design without need for sample collection (e.g., Kram and Farrar well design method) Less worker exposure to contaminants Updated ASTM standard (D6067) Con: Not applicable when gravels or consolidated materials are present Data distributions rely on geostatistical interpolation, so extreme conditions between measurement locations can be difficult to estimate Aquifer storage not determined Hydraulic head measurements can only resolve changes of 1" or greater. Final Report: http://www.clu-in.org/s.focus/c/pub/i/1558/http://www.clu-in.org/s.focus/c/pub/i/1558/ 1-44

45
Clu-In 9/12/08 Measures pressure response of soil to water injections; Relative K characterization, but helpful for migration pathway and remediation design; Static water levels; Refined soil type characteristics (when combined with EC sensor); Can be advanced with percussion or hydraulic push rig. HYDRAULIC PROFILING TOOL 1-45

46
Clu-In 9/12/08 HYDRAULIC PROFILING TOOL Pro: Continuous profiling; Useful for remediation design; Can be combined with soil type (EC) indicators; Excellent conceptual modeling tool. Con: K values not quantified, so limited modeling capabilities; Theory behind K derivations may require additional lab effort (but would potentially lead to quantification); EC soil type not as resolved in silty sand to sand. 1-46
; EC soil type not as resolved in silty sand to sand")
47
Clu-In 9/12/08 LTM NETWORK DESIGN CONSIDERATIONS Well Design ASTM CPT Based (Kram and Farrar) Well Placement 2D vs. 3D (long vs. short screens) 3D Spacing Well Installation Prepack Options 1-47
 3D Spacing Well Installation Prepack Options")
48
Clu-In 9/12/08 ASTM D5092 FILTER PACK Granular material of known chemistry and selected grain size and gradation installed in the annulus between screen and borehole wall; Filter pack grain size and gradation selected to allow only the finest materials to enter screen during development (well conditioning); –30% finer (d-30) grain size that is 4 to 10 times greater than d-30 of screened unit; –Slot size to retain 90-99% of filter pack. 1-48
49
Clu-In 9/12/08 ASTM D5092 FILTER PACK Granular material of known chemistry and selected grain size and gradation installed in the annulus between screen and borehole wall; Filter pack grain size and gradation selected to allow only the finest materials to enter screen during development (well conditioning); –30% finer (d-30) grain size that is 4 to 10 times greater than d-30 of screened unit; –Slot size to retain 90-99% of filter pack. Formation G.S. Filter Pack Design Slot Size Selection 1-49

50
Clu-In 9/12/08 ASTM D5092 FILTER PACK AND SLOT CRITERIA 1-50

51
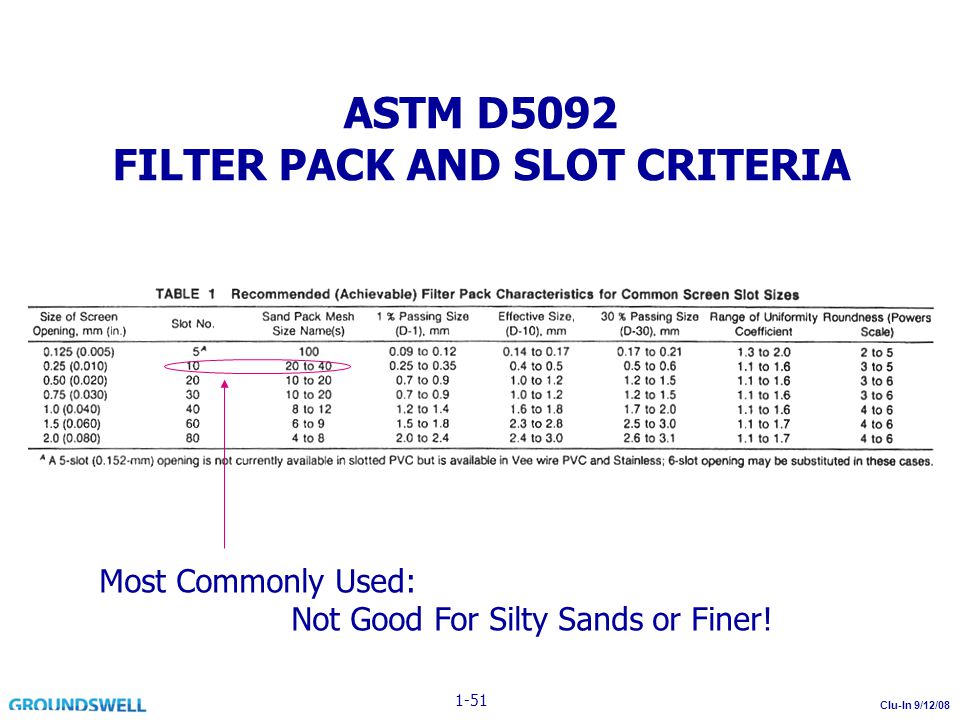
Clu-In 9/12/08 ASTM D5092 FILTER PACK AND SLOT CRITERIA Most Commonly Used: Not Good For Silty Sands or Finer! 1-51
52
Clu-In 9/12/08 NEW APPROACH FOR WELL DESIGN USING CPT SOIL DATA Benefits: No need for sieve analysis (no samples); real-time design; customized multi-level design; save $, etc. US Patent: 6,317,694 1-52

53
Clu-In 9/12/08 CPT-BASED WELL DESIGN Candidate Screen Zone Kram and Farrar Well Design Method 1-53

54
Clu-In 9/12/08 CONTAMINANT FLUX MONITORING STEPS (Remediation Design/Effectiveness) Generate Initial Model (Seepage Velocity, Concentration Distributions) –Conventional Approaches –High Resolution Piezocone/MIP/Confirmation Install Customized 3D Monitoring Well Network Monitor Water Level and Concentrations (Dynamic) Track Flux Distributions (3D, Transects) Evaluate Remediation Effectiveness –Plume Status (Stable, Contraction, etc.) –Remediation Metric –Regulatory Metric? 1-54
55
Clu-In 9/12/08 GREGG’S PORTION Sensor Technologies Desktop Monitoring Hydraulic Parameters Analytes (Today and in Near Future) Components of a Wireless Telemetry System Automated Monitoring 1-55
 Components of a Wireless Telemetry System Automated Monitoring 1-55")
56
Long-Term Monitoring Bringing Environmental Data to Your Desktop Presented by Gregg Gustafson Instrumentation NW 2-1

57
Introduction Long Term Monitoring Systems Long Term Monitoring Systems – Sensors – Wireless – Software 2-2

58
Overview & Background Sensors vs Sampling 2-3

59
2-4

60
Why monitor real time? … Early Detection of pollution Early detection Difficult to clean up Easy to clean up Late detection 2-5

61
Why Monitor… Trends and variations Traditional sampling and analysis methods only collect a limited amount of data; this can miss trends over time Sensors gather much more data, providing useful information on temporal variations in contaminant levels that can be clearly defined 2-6

62
Why Monitor… Remediation Performance Monitoring – Automatically track dynamic parameters via sensors –Water level –Concentration –Etc. – Route sensor data via software –expedited processing –Visualization –Reporting – More data points than quarterly sampling – Better understanding for remediation evaluation – Monitor specifically for –“Lines of evidence” –Plume status 2-7

63
Today… Decision makers need Decision makers need – More data – From more locations – More frequently – Consistent with Triad Principles 2-8

64
Technical – Provides real time data on demand – Assures accurate coordinated data across entire sites – Enables monitoring of relatively inaccessible locations – Improves safety – less need to enter hazardous areas – Lower carbon footprint! Benefits 2-9

65
BenefitsEconomic – Reduces expensive trips to each location – Allows better focusing of staff – Maximizes early detection of problems Less cleanup cost Less environmental damage Less downtime – Better information = better decisions 2-10

66
Are Sensors Suitable for Long Term Monitoring? …YES! – Useful parameters Can sensors measure what is needed? – Quality measurements Can sensors provide data that is accurate, stable, and traceable? – Ruggedness Are today’s sensors rugged enough for harsh environments and rough handling? – Connectivity Easy to connect to the computer world? 2-11

67
Components of a Monitoring System 2-12

68
Sensors 2-13

69
Sensors - Measuring – Accuracy – Drift – Range – Traceability – Resolution – Data Storage – Power Consumption – Immunity to: Temperature Error Noise Shock & Abuse Harsh Environments Leaking Sensors must take measurements Sensors must take measurements 2-14

70
Sensors – Measuring Useful Parameters – Field Proven Useful Parameters – Field Proven – Pressure – Temperature – pH/ISE/Orp – Conductivity – Dissolved Oxygen – Turbidity – TCE/ Field analytics 2-15

71
Sensors – Future Useful Parameters – In Development Useful Parameters – In Development – Radiological – Chlorinated Hydrocarbons – Biological – RDX – Vapor Intrusion Analytes 2-16

72
SensorsInstallation 2-17

73
Sensors – Installation Above Ground Monument Sensor Cable Well casing Strain relief Desiccant Service port Well cap Monument Steel or fiberglass monument Steel or fiberglass monument 2-18

74
Steel or fiberglass flush mounted lid Steel or fiberglass flush mounted lid Sensors – Installation Below Ground Monument Sensor Cable Well casing Strain relief Desiccant* Service port Well cap MonumentLid *Prone to flooding!! Keep desiccant dry or use absolute sensors. 2-19

75
Above or below ground Above or below ground Sensors – Installation Cluster Well Installation Monument Top view Junction box with service port Wells with sensors at different levels 2-20

76
Telemetry Systems 2-21

77
Telemetry Systems May consist of: – Radios Single sets for up to about 5 miles Repeater networks for extended coverage – Modems Cellular IP modems Dialup modems – Both Networks combining both radios and modems offer great flexibility 2-22

78
Telemetry- Radios Typical Installation 2-23

79
Telemetry- Radios Sample Network – to reach longer distances or difficult locations 1 Radio Host, 2 Radio Repeaters, 1 Radio Remote, 1 Sensor 2-24

80
Transmission Systems - Radios Sample Network – to avoid an obstacle 1 Radio Host, 1 Radio Repeater, 1 Radio Remote, 1 Sensor 2-25

81
Typical Dial-up Installation Transmission Systems - Modems Dial out from PC with modem 2-26

82
Typical IP Installation Transmission Systems - Modems Connect via the Internet 2-27

83
Sample Network Complex network including radios and cellular modem Telemetry Systems- Blended 2-28

84
Typical Installations Typical Installations Sample Mounting on Wellhead – Strap to wellhead – Antenna and sensor wiring facing down to reduce leaking 2-29

85
Typical Installations Sample Mounting on Pole – Strap enclosure to pole – Bury pole and strap to well head for support – Use guy wires as needed – Antenna and sensor wiring facing down to reduce leaking 2-30

86
Typical Installations Above Ground Monument Radio Strap to side of well head. Use fiberglass (not steel) monument 2-31
 monument")
87
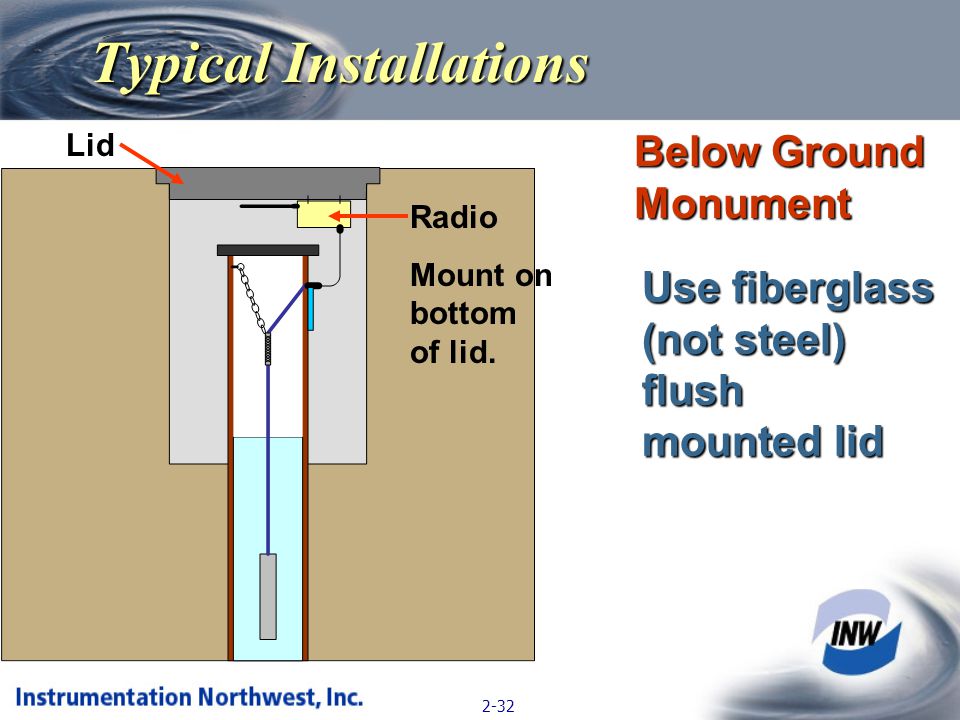
Use fiberglass (not steel) flush mounted lid Typical Installations Below Ground Monument Lid Radio Mount on bottom of lid. 2-32
88
Typical Installations May need nearby repeater to increase transmission distance. Below Ground Monument 2-33

89
Installation 2-34

90
Software 2-35

91
Reports status of the system Software 2-36

92
Displays real time readings on demand Software 2-37

93
Controls rate and timing of data collection Software 2-38

94
Uploads and displays recorded data Software 2-39

95
Exports data to other programs Software 2-40

96
Exports data to other programs Software 2-41

97
Conclusion Sensors + Connection Tools + Software Equals Better Information Better Decisions & Better Project Management 2-42

98
Clu-In 9/12/08 BURGE UNIVERSAL PLATFORM TCE, Cr(VI), Explosives, SR 90, etc. 3-1
, Explosives, SR 90, etc. 3-1")
99
Clu-In 9/12/08 BURGE UNIVERSAL PLATFORM TCE, Cr(VI), Explosives, SR 90, etc. 3-2
, Explosives, SR 90, etc. 3-2")
100
Clu-In 9/12/08 CONTAMINANT FLUX MONITORING STEPS (Remediation Design/Effectiveness) Generate Initial Model (Seepage Velocity, Concentration Distributions) –Conventional Approaches –High Resolution Piezocone/MIP/Confirmation Install Customized 3D Monitoring Well Network Monitor Water Level and Concentrations (Dynamic) Track Flux Distributions (3D, Transects) Evaluate Remediation Effectiveness –Plume Status (Stable, Contraction, etc.) –Remediation Metric –Regulatory Metric? 3-3

101
Clu-In 9/12/08 GW Plume Characterization Strategy Wiedemeier et al., 1996 BC D 3D – Depth Specific Info; Wells or Continuous Profile 6 3-4

102
Clu-In 9/12/08 GW Plume Characterization Strategy Wiedemeier et al., 1996 BC D 3D – Depth Specific Info; Wells or Continuous Profile 6 3-5

103
Clu-In 9/12/08 SEEPAGE VELOCITY AND FLUX Seepage velocity ( ): K i where: K = hydraulic conductivity ( Piezocone ) = ------ (length/time) i = hydraulic gradient ( Piezocone )* = effective porosity ( Piezocone/Soil ) Contaminant flux (F): F = [X]where: = seepage velocity (length/time; m/s) (mass/length 2 -time; mg/m 2 -s) [X] = concentration of solute ( MIP, etc.)* (mass/volume; mg/m 3 ) * Dynamic Parameters 3-6
![Clu-In 9/12/08 SEEPAGE VELOCITY AND FLUX Seepage velocity ( ): K i where: K = hydraulic conductivity ( Piezocone ) = (length/time) i = hydraulic gradient ( Piezocone )* = effective porosity ( Piezocone/Soil ) Contaminant flux (F): F = [X]where: = seepage velocity (length/time; m/s) (mass/length 2 -time; mg/m 2 -s) [X] = concentration of solute ( MIP, etc.)* (mass/volume; mg/m 3 ) * Dynamic Parameters 3-6](http://images.slideplayer.com/15/4560514/slides/slide_103.jpg "Clu-In 9/12/08 SEEPAGE VELOCITY AND FLUX Seepage velocity ( ): K i where: K = hydraulic conductivity ( Piezocone ) = (length/time) i = hydraulic gradient ( Piezocone )* = effective porosity ( Piezocone/Soil ) Contaminant flux (F): F = [X]where: = seepage velocity (length/time; m/s) (mass/length 2 -time; mg/m 2 -s) [X] = concentration of solute ( MIP, etc.)* (mass/volume; mg/m 3 ) * Dynamic Parameters 3-6")
104
Clu-In 9/12/08 EXPEDITED FLUX APPROACH Plume Delineation MIP, LIF, ConeSipper, Waterloo APS, Field Lab, etc. 2D/3D Concentration Representations Hydro Assessment High-Res Piezocone (2D/3D Flow Field, K, head, eff. por.) LTM Network Design Well Design based on CPT Data Field Installations (Clustered Short Screened Wells) Surveys (Lat/Long/Elevation) GMS Interpolations (, F), Conceptual/Analytical Models LTM Flux Updates via Head/Concentration Conventional Data Automated Modeling 3-7
 LTM Network Design Well Design based on CPT Data Field Installations (Clustered Short Screened Wells) Surveys (Lat/Long/Elevation) GMS Interpolations (, F), Conceptual/Analytical Models LTM Flux Updates via Head/Concentration Conventional Data Automated Modeling 3-7.")
105
Clu-In 9/12/08 Future Conceptualization 3-8

106
Clu-In 9/12/08 Future Conceptualization 3-9

107
Clu-In 9/12/08 Future Conceptualization 3-10

108
Clu-In 9/12/08 Future Conceptualization 3-11

109
Clu-In 9/12/08 CURRENT/FUTURE HYDRO SENSORS/APPLICATIONS Current Sensors: TCE, Cr(VI), N-Explosives, SR 90, Nitrate, Geochemistry, Water Level, Vapor Chemistry, Pressure, Temp, etc. Future Sensors/Applications: Additional Organic Solutes Vapor Monitoring (USTs, Pipe Leaks, Intrusion, etc.) Perchlorate LTM/MNA On-The-Fly Model Update/Calibration Landfills Hydraulic Containment Others? 3-12
 Perchlorate LTM/MNA On-The-Fly Model Update/Calibration Landfills Hydraulic Containment Others")
110
Clu-In 9/12/08 ENCOURAGING DEVELOPMENTS New Sensors Available New Sensors Under Development (DHS, nano, etc.) New Compatible Technologies (Smart Dust, Motes, Pods, Retriever, Crossbow, INW, MachineTalker, etc.) Significant SONs for Sensors and Approach –DoD (SERDP) –DOE (STTR) –DHS (BAA, SBIR) –EPA (SBIR) Telecommunications & DB Standards 3-13
 New Compatible Technologies (Smart Dust, Motes, Pods, Retriever, Crossbow, INW, MachineTalker, etc.) Significant SONs for Sensors and Approach –DoD (SERDP) –DOE (STTR) –DHS (BAA, SBIR) –EPA (SBIR) Telecommunications & DB Standards 3-13")
111
Clu-In 9/12/08 Gain Precision - True Risks and Strategic Options Lower Long-Term Site Management Costs Simultaneous Multi-Site Monitoring (Web) Monitoring at Practical Time Steps Automated Responses VALUE PROPOSITION 3-14
 Monitoring at Practical Time Steps Automated Responses VALUE PROPOSITION 3-14")
112
Clu-In 9/12/08 CONCLUSIONS Single-Deployment Solutions Now Possible Triad Based CPT Approaches (e.g., LIF, MIP, HRP, W APS, etc.) Save Time/Cost and Lead to Exceptional Plume and Hydraulic Characterization Highly Resolved 2D and 3D Distributions of Head, Gradient, K, Effective Porosity, and Seepage Velocity Now Possible Using HRP and GMS When Know Concentration Distribution (e.g., via MIP, Conesipper, etc.), 3D Distributions of Contaminant Flux Possible Using GMS Exceptional Capabilities for Plume “Architecture” and Monitoring Network Design for Remediation Design and Evaluation New Paradigm - LTM and Remediation Performance Monitoring via Sensors and Automation (4D) 3-15
 Save Time/Cost and Lead to Exceptional Plume and Hydraulic Characterization Highly Resolved 2D and 3D Distributions of Head, Gradient, K, Effective Porosity, and Seepage Velocity Now Possible Using HRP and GMS When Know Concentration Distribution (e.g., via MIP, Conesipper, etc.), 3D Distributions of Contaminant Flux Possible Using GMS Exceptional Capabilities for Plume Architecture and Monitoring Network Design for Remediation Design and Evaluation New Paradigm - LTM and Remediation Performance Monitoring via Sensors and Automation (4D) 3-15")
113
Clu-In 9/12/08 ACKNOWLEDGEMENTS EPA – Clu-In Logistical Support (Michael Adam, Jean Balent, Triad COP) SERDP – Funded Advanced Fuel Hydrocarbon Remediation National Environmental Technology Test Site (NETTS) ESTCP – Funded HRP/LIF/MIP/GeoVIS/etc. Demonstrations NAVFAC ESC – HRP/LIF/GeoVIS Manpower, oversight, matching efforts Field and Technical Support – Project Advisory CommitteeDorothy Cannon (NFESC) Jessica Chau (U. Conn.)Kenda Neil (NFESC) Gary Robbins (U. Conn.)Richard Wong (Shaw I&E) Ross Bagtzoglou (U. Conn.)Dale Lorenzana (GD) Merideth Metcalf (U. Conn.)Kent Cordry (GeoInsight) Tim Shields (R. Brady & Assoc.)Ian Stewart (NFESC) Craig Haverstick (R. Brady & Assoc.)Alan Vancil (SWDIV) Fred Essig (R. Brady & Assoc.)Dan Eng (US Army) Jerome Fee (Fee & Assoc.)MANY OTHERS!!! Dr. Lanbo Liu and Ben Cagle (U. Conn.) 3-16
 Jessica Chau (U. Conn.)Kenda Neil (NFESC) Gary Robbins (U. Conn.)Richard Wong (Shaw I&E) Ross Bagtzoglou (U. Conn.)Dale Lorenzana (GD) Merideth Metcalf (U. Conn.)Kent Cordry (GeoInsight) Tim Shields (R. Brady & Assoc.)Ian Stewart (NFESC) Craig Haverstick (R. Brady & Assoc.)Alan Vancil (SWDIV) Fred Essig (R. Brady & Assoc.)Dan Eng (US Army) Jerome Fee (Fee & Assoc.)MANY OTHERS!!. Dr. Lanbo Liu and Ben Cagle (U. Conn.)")
114
Clu-In 9/12/08 THANK YOU! For More Info: Mark Kram, Ph.D. (GT) 805-844-6854 Gregg Gustafson (INW) 425-822-4564
 Gregg Gustafson (INW)")
115
Clu-In 9/12/08 After viewing the links to additional resources, please complete our online feedback form. Thank You Links to Additional Resources Feedback Form 3-18

Similar presentations


 to carry drill cuttings to surface Hollow-stem.>")


