Download presentation
Presentation is loading. Please wait.

1
Dietary Interventions for Insulin Resistance and the Metabolic Syndrome Lisa M. Neff, MD Northwestern University Comprehensive Center on Obesity

2
“Dietary Interventions for Insulin Resistance and the Metabolic Syndrome” Background –Metabolic Syndrome –Dietary Patterns and Insulin Sensitivity Pilot Study Design and Data Future Directions

3
The Metabolic Syndrome: NCEP/ATPIII/AHA Diagnostic Criteria Individuals must have 3 or more of the following: –Abdominal obesity Waist circumference > 40” in men or > 35” in women –High triglycerides ≥ 150 mg/dL –Low HDL cholesterol < 40 mg/dL in men or < 50 mg/dL in women –High blood pressure ≥ 130/85 mmHg –High fasting glucose ≥ 100 mg/dL

4
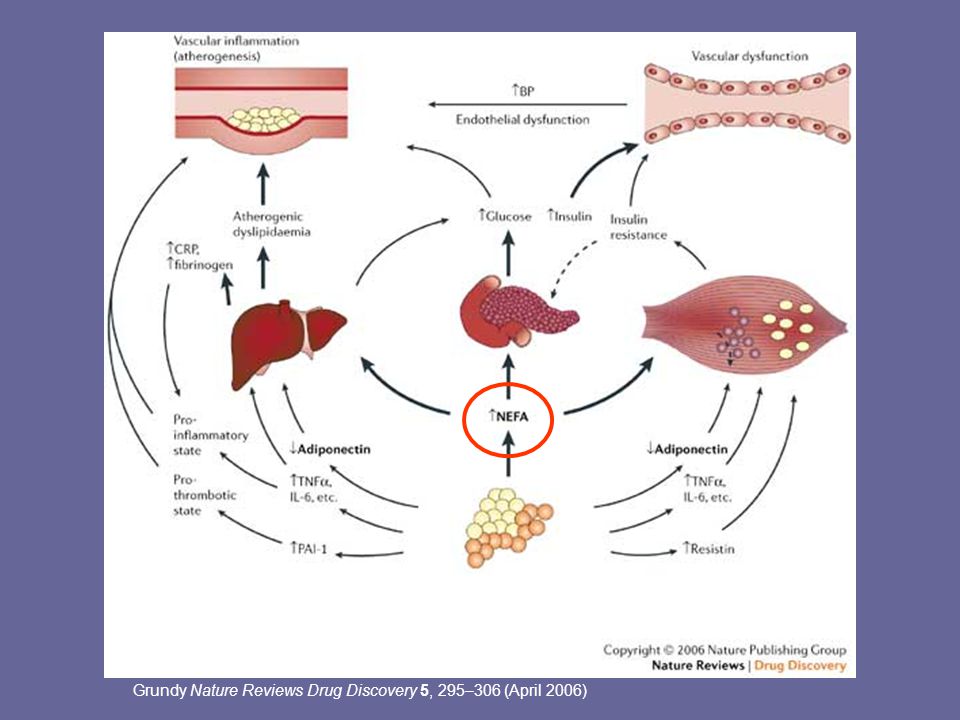
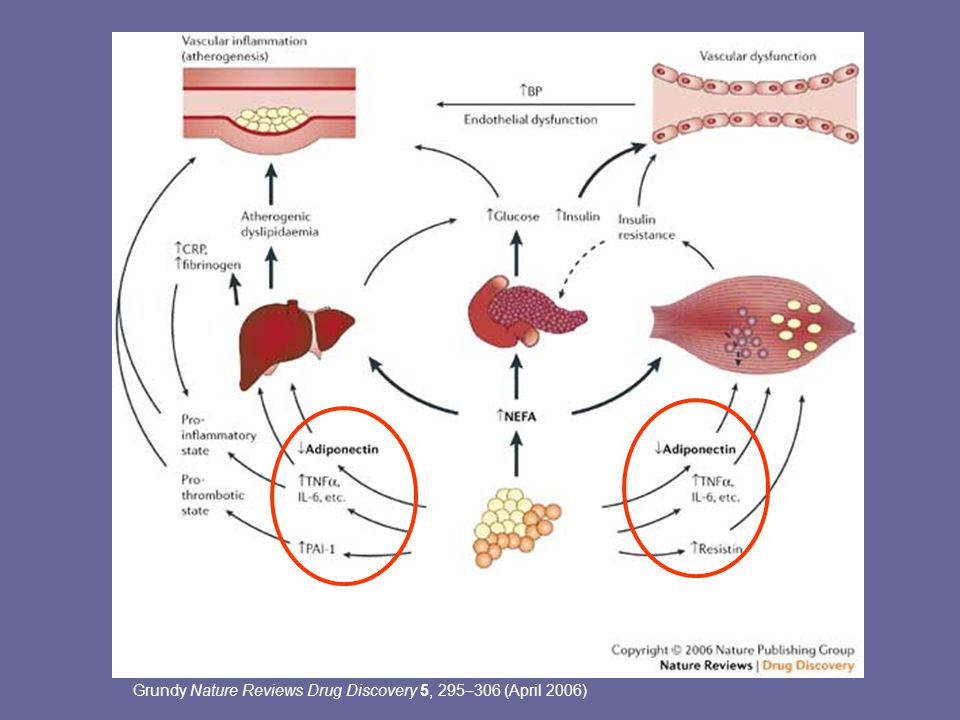
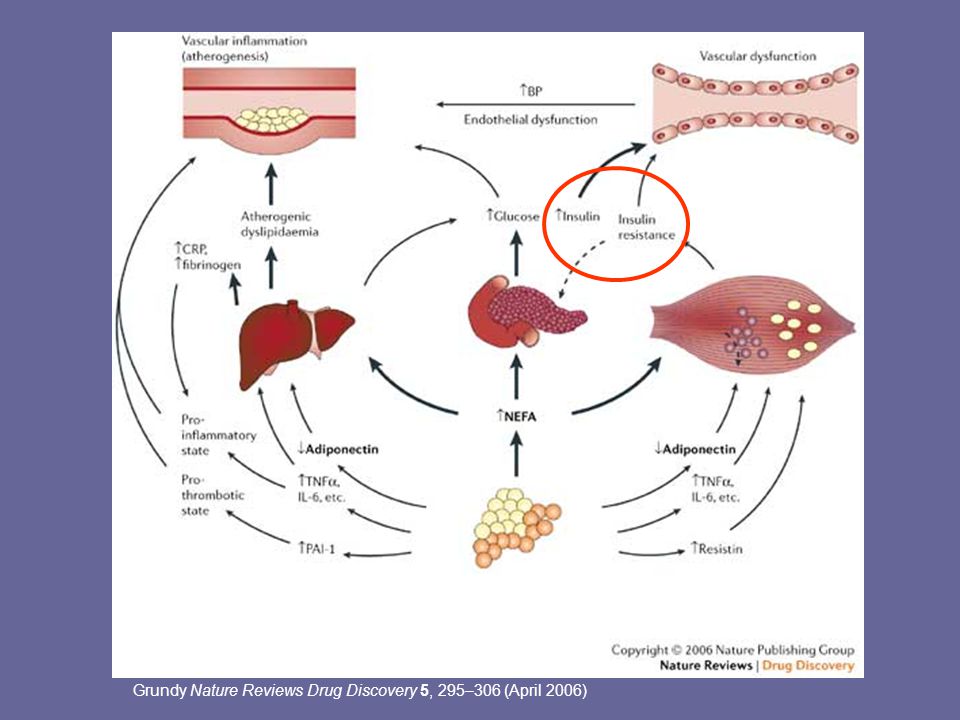
Dyslipidemia Hypertension Polycystic ovary disease Sleep apnea Non-alcoholic fatty liver disease Cancer Hyperuricemia & gout Insulin resistance Inflammation Prothrombotic state Endothelial dysfunction Cardiovascular disease Diabetes Abdominal Obesity

5
Grundy Nature Reviews Drug Discovery 5, 295–306 (April 2006)
")
9
Is there an optimal dietary pattern for individuals with the Metabolic Syndrome?

10
Dietary Components Which May Affect Insulin Resistance ↓ IR Whole grains Fruits and vegetables Low fat dairy products Magnesium Calcium Dietary fiber Omega-3 fatty acids Low GI foods ↑ IR Saturated fat Salt (deficiency or excess) Alcohol (>30g/day)
 Alcohol (>30g/day)")
11
Dietary Components Which May Affect Insulin Resistance ↓ IR Whole grains Fruits and vegetables Low fat dairy products Magnesium Calcium Dietary fiber Omega-3 fatty acids Low GI foods DASH Diet

12
The DASH Diet: Dietary Approaches to Stop Hypertension Originally conceived as the optimal diet for hypertension High in fruits and vegetables (typically 10 servings/day or more), whole grains, and low fat dairy products(2-3 servings/day or more) Moderate amounts of nuts, beans, fish and poultry Limited red meat, fried foods, and sweets High in calcium, magnesium, potassium, vitamins, phytochemicals, and fiber Low in cholesterol, saturated fat, sugars, and sodium
, whole grains, and low fat dairy products(2-3 servings/day or more) Moderate amounts of nuts, beans, fish and poultry Limited red meat, fried foods, and sweets High in calcium, magnesium, potassium, vitamins, phytochemicals, and fiber Low in cholesterol, saturated fat, sugars, and sodium")
13
The DASH Diet: Epidemiologic Studies Increased intake of fruits, vegetables, and low fat dairy products is associated with: –Increased insulin sensitivity –Reduced risk of metabolic syndrome –Reduced risk of Type 2 diabetes –Reduced risk of hypertension High intakes of calcium and magnesium are associated with: –Increased insulin sensitivity –Reduced risk of metabolic syndrome –Reduced risk of Type 2 diabetes

14
The DASH Diet: Epidemiologic Studies In the Nurses Health Study, adherence to a DASH-style diet is associated with: –A lower risk of CHD (fatal and non-fatal) (RR=0.76) –A lower risk of stroke (RR=0.82) –Lower plasma levels of CRP and IL-6 Fung et al. Arch Intern Med. 2008;168(7):713-20.
:")
15
Magnesium and Metabolic Syndrome Magnesium appears to play a role in: –carbohydrate metabolism Mg++ is a cofactor for several glycolytic enzymes, including hexokinase, phosphofructokinase, and pyruvate kinase –insulin action Low intracellular Mg++ impairs the tyrosine kinase activity of the insulin receptor –modulating vascular tone and blood pressure Low intracellular Mg++ may affect calcium channel activity, raising intracellular Ca++, which has a vasoconstrictive effect –thrombosis Magnesium may alter platelet reactivity or aggregation

16
Magnesium and Metabolic Syndrome In healthy human subjects, experimental magnesium deficiency increases: (Nadler JL, Hypertension 1993, Nadler JL, Diabetes Care 1992) –Insulin resistance –Basal and angiotensin-II stimulated aldosterone levels –Thromboxane A2 levels –Platelet reactivity In diabetics with hypomagnesemia, magnesium supplementation improves insulin sensitivity and reduces platelet reactivity (Rodriguez-Moran, Diabetes Care 2003; Nadler JL, Diabetes Care 1992) In a canine model of stent thrombosis, IV magnesium administration reduced thrombus formation (Rukshin V, Circulation 2002)
 –Insulin resistance –Basal and angiotensin-II stimulated aldosterone levels –Thromboxane A2 levels –Platelet reactivity In diabetics with hypomagnesemia, magnesium supplementation improves insulin sensitivity and reduces platelet reactivity (Rodriguez-Moran, Diabetes Care 2003; Nadler JL, Diabetes Care 1992) In a canine model of stent thrombosis, IV magnesium administration reduced thrombus formation (Rukshin V, Circulation 2002)")
17
Calcium and Metabolic Syndrome Calcium appears to play a role in: –insulin action High levels of intracellular Ca++ may impair insulin signaling –modulating vascular tone and blood pressure High levels of intracellular Ca++ may have a vasoconstrictive effect

18
Calcium and Metabolic Syndrome In hypertensive patients, oral calcium supplementation: –reduces intracellular calcium levels and may improve insulin sensitivity (Sanchez M, Hypertension 1997) –may produce modest improvements in systolic blood pressure (Allender PS, Ann Intern Med 1996; Bucher HC, JAMA 1996) Amlodipine therapy reduces intracellular Ca++, improves glycemic control, and increases insulin sensitivity (Beer NA, J Clin Endo Metab 1993, Ueshiba, Horm Metab Res 2003)
 –may produce modest improvements in systolic blood pressure (Allender PS, Ann Intern Med 1996; Bucher HC, JAMA 1996) Amlodipine therapy reduces intracellular Ca++, improves glycemic control, and increases insulin sensitivity (Beer NA, J Clin Endo Metab 1993, Ueshiba, Horm Metab Res 2003)")
19
The DASH Diet: Clinical Trials The DASH Diet: Lowers blood pressure in normotensive and hypertensive adults (Appel, NEJM 1997, Sacks, NEJM 2001) Reduces LDL cholesterol (Obarzanek, AJCN 2001) Reduces Framingham risk score (Maruther, Circulation 2009)
 Reduces LDL cholesterol (Obarzanek, AJCN 2001) Reduces Framingham risk score (Maruther, Circulation 2009)")
20
The DASH Diet: Clinical Trials The DASH Diet: May produce greater weight loss than standard low-fat diets (Azadbakht, Diabetes Care 2005, Ard, Diabetes Care 2004) May reduce fasting glucose and improve insulin sensitivity more than standard weight loss diets (Azadbakht, Diabetes Care 2005, Ard, Diabetes Care 2004) To our knowledge, no studies have examined the effects of the DASH diet on insulin sensitivity and glucose metabolism under controlled feeding conditions or during weight stability.
 May reduce fasting glucose and improve insulin sensitivity more than standard weight loss diets (Azadbakht, Diabetes Care 2005, Ard, Diabetes Care 2004) To our knowledge, no studies have examined the effects of the DASH diet on insulin sensitivity and glucose metabolism under controlled feeding conditions or during weight stability.")
21
The DASH Diet: Clinical Trials The DASH Diet: May increase antioxidant capacity and reduce oxidative stress (Lopes, Hypertension, 2003) May increase levels of adiponectin, the anti-inflammatory and insulin-sensitizing adipokine (Lien, Obesity, 2006) May reduce inflammatory markers such as C-reactive protein (Lien, Obesity, 2006)
 May increase levels of adiponectin, the anti-inflammatory and insulin-sensitizing adipokine (Lien, Obesity, 2006) May reduce inflammatory markers such as C-reactive protein (Lien, Obesity, 2006)")
22
The DASH Diet: Caveats The DASH diet may also –reduce HDL cholesterol, like other low-fat diets (Obarzanek, AJCN, 2001) –Increase TG (mean of 18 mg/dL), like other high carbohydrate diets (Erlinger, Circulation, 2003)
 –Increase TG (mean of 18 mg/dL), like other high carbohydrate diets (Erlinger, Circulation, 2003)")
23
Ludwig, D. S. JAMA 2002;287:2414-2423. Foods with similar carbohydrate content can affect blood glucose levels differently Glycemic Index

24
Potato Instant oatmeal White bread Watermelon Basmati rice Stoneground whole wheat bread Raisins Pineapple Kidney beans Chocolate ice cream Oatmeal made with steel-cut oats Spaghetti, al dente

25
Glycemic Index and Obesity High Glycemic Index Meal Postprandial Hyperglycemia Hyperinsulinemia Relative Lipogenesis Reactive Hypoglycemia OBESITY Counterregulatory Hunger ↑ Food Intake Hormones

26
Glycemic Index and Diabetes High Glycemic Index Meal Postprandial Hyperglycemia ↑ FFA Hyperinsulinemia Glucotoxicity Lipotoxicity Relative INSULIN Reactive RESISTANCE Hypoglycemia BETA CELL FAILURE Counterregulatory Hormones

27
The Low Glycemic Index Diet: Epidemiologic Studies In some but not all studies, low GI diets are associated with: –Increased insulin sensitivity –Reduced adiposity –Reduced risk of metabolic syndrome –Reduced risk of type 2 diabetes

28
The Low Glycemic Index Diet: Clinical Trials Low GI diets: –Reduce postprandial glucose levels in normal individuals and people with diabetes (Ludwig, JAMA, 2002) –Produce modest improvements in HbA1c in patients with diabetes (Brand-Miller, Diabetes Care, 2003) –May or may not affect insulin sensitivity (improvements noted in 2 of 7 studies)
 –Produce modest improvements in HbA1c in patients with diabetes (Brand-Miller, Diabetes Care, 2003) –May or may not affect insulin sensitivity (improvements noted in 2 of 7 studies)")
29
The Low Glycemic Index Diet: Clinical Trials Low GI diets: –May be beneficial for weight management, particularly in individuals with features of the metabolic syndrome (Pittas, Diabetes Care, 2005) –May reduce LDL cholesterol and TG and increase HDL (Luscombe, EJCN, 1999 and Pereira, JAMA, 2004) –May reduce inflammatory markers such as C- reactive protein (Pereira, JAMA, 2004) and IL-6 (Kallio, AJCN, 2008) –May increase antioxidant capacity (Botero, Obesity, 2009)
 –May reduce LDL cholesterol and TG and increase HDL (Luscombe, EJCN, 1999 and Pereira, JAMA, 2004) –May reduce inflammatory markers such as C- reactive protein (Pereira, JAMA, 2004) and IL-6 (Kallio, AJCN, 2008) –May increase antioxidant capacity (Botero, Obesity, 2009)")
30
Questions Does the DASH diet or the low GI improve insulin sensitivity, in the absence of weight loss? Does the DASH diet or the low GI diet improve other features of the metabolic syndrome (such as dyslipidemia and inflammation), in the absence of weight loss? Do these dietary patterns and weight loss have synergistic effects?
, in the absence of weight loss. Do these dietary patterns and weight loss have synergistic effects .")
31
Pilot Study Overview 15-week feasibility study with 18 volunteers Three different study diets –DASH Diet –Low Glycemic Index Diet –American-Style Diet All food provided by Bionutrition for 13 weeks

32
Pilot Study Overview Inclusion criteria: ages 18-45, BMI ≥27, with: –fasting insulin ≥ 9 uIU/mL –OR fasting glucose ≥ 100 mg/dl –OR 2-hour OGTT ≥ 140 mg/dl AND –≥2 other features of the metabolic syndrome Abdominal obesity High triglycerides Low HDL Prehypertension or hypertension

33
Study Overview Run-in Phase on Usual Diet Testing #1 on American Diet Wt Stable on American Diet Wt Stable on DASH Diet Wt Stable on Low GI Diet 2 weeks Outpatient 3-4 days Inpatient 2 weeks Inpatient 8 weeks Outpatient Weight loss phase Wt Stable on DASH Diet Wt Stable on American Diet Wt Stable on Low GI Diet Testing #2 Testing #3 2 weeks Inpatient 50% kcal reduction

34
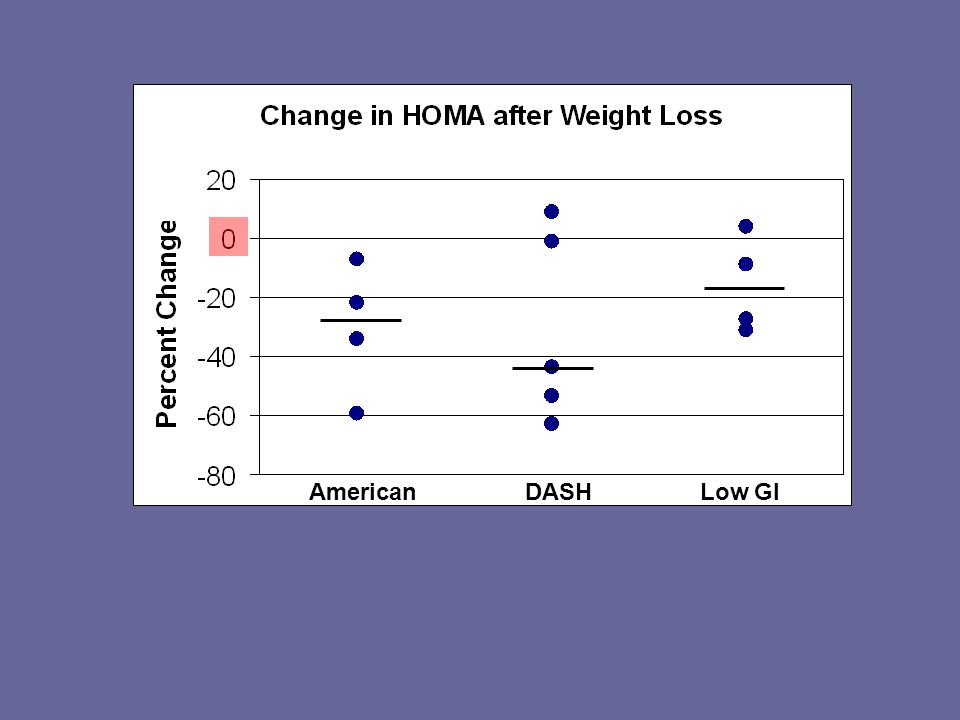
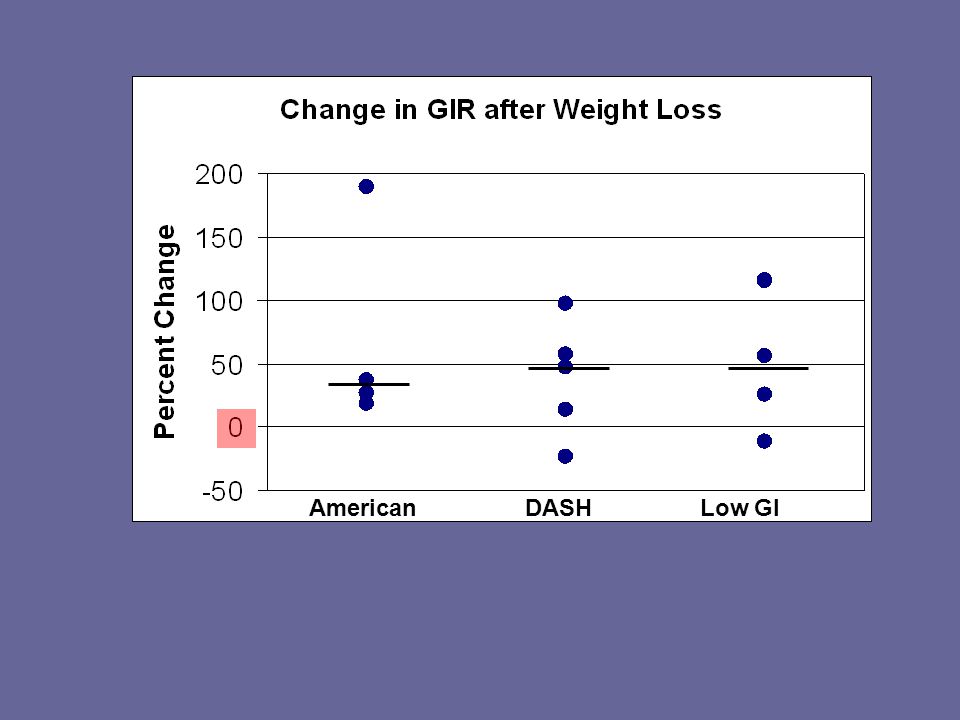
Measures of Insulin Sensitivity HOMA – –Used to assess hepatic insulin sensitivity –a lower score indicates better insulin sensitivity OGTT – –Used to assess whole body insulin sensitivity –Frequent blood sampling for 3 hours following the consumption of 75 grams of glucose –The Area Under the Curve (AUC) was calculated for glucose and insulin using the trapezoidal method Hyperinsulinemic Euglycemic Clamp – –A measure of peripheral insulin sensitivity –High insulin infusion rate: 80 mU/m 2 body surface area –Variable infusion rate of dextrose to keep blood glucose levels in the range of 90-100 mg/dl. –A higher glucose infusion rate (GIR) indicates better insulin sensitivity
 indicates better insulin sensitivity.")
35
Other Testing ParameterTesting/Procedures LipidsTotal, LDL-, and HDL-cholesterol, TG, Lipoprotein subclass analysis by NMR spectroscopy Blood pressure24-hour BP monitor InflammationCRP, IL-6, TNF-α, IL-10, PAI-1 Other labsAdiponectin, free fatty acids Body composition Air displacement plethysmography Energy metabolism Indirect calorimetry

36
Composition of the Study Diets Data are for a 1600 kcal diet DASHLow GIAmerican Carbohydrate (% of kcal) 574052 Fat (% of kcal) 253032 Saturated fat (% of kcal) 610 Protein (% of kcal) 183016
 Fat (% of kcal) Saturated fat (% of kcal) 610 Protein (% of kcal)")
37
Composition of the Study Diets Data are for a 1600 kcal diet DASHLow GIAmerican Calcium (mg) 1150850545 Magnesium (mg) 374250232 Potassium (mg) 377127801986 Sodium (mg) 118511802356
 Magnesium (mg) Potassium (mg) Sodium (mg)")
38
Composition of the Study Diets Data are for a 1600 kcal diet DASHLow GIAmerican Cholesterol (mg) 121191150 Fiber (g) 312116 GI 553858
 Fiber (g) GI")
39
Composition of the Study Diets Data are for a 1600 kcal diet DASHLow GIAmerican Fruit Intake (Servings/Day) 533* Vegetable Intake (Servings/Day) 422 Dairy Intake (Servings/Day) 21.51 * predominantly juice and juice drinks
 533* Vegetable Intake (Servings/Day) 422 Dairy Intake (Servings/Day) * predominantly juice and juice drinks")
40
Baseline Characteristics of 18 Enrolled Volunteers who Completed ≥ 2 Testing Periods Gender 50% female, 50% male Race/Ethnicity 1 (6%) Non-Hispanic White 8 (44%) Hispanic 8 (44%) Black 1 (6%) Asian Age Mean 33.5 +/- 6.9 yrs (range 22-45) BMI 38.4 +/- 7.4 kg/m 2 (range 30-56)
 Non-Hispanic White 8 (44%) Hispanic 8 (44%) Black 1 (6%) Asian Age Mean /- 6.9 yrs (range 22-45) BMI /- 7.4 kg/m 2 (range 30-56)")
41
Baseline Metabolic Characteristics of 18 Enrolled Volunteers who Completed ≥ 2 Testing Periods 100% had elevated fasting insulin levels and abdominal obesity. 28% had fasting hyperglycemia. 67% had low HDL levels. 44% had hypertriglyceridemia. 39% had prehypertension or hypertension. 50% had elevated CRP levels.

42
Baseline Parameters by Study Diet Assignment: Median (range) American (n=5) Low GI (n=7) DASH (n=6) BMI (kg/m2)34.2 (33-48)34.0 (30-56)35.7 (32-48) Waist Circ (cm) 116 (111-142)117 (104-145)119 (114-153) Steps/Day during Run-In 11,216 (8609-12,146) 6,001 (5085-13,196) 9,052 (2655-23,436)
 American (n=5) Low GI (n=7) DASH (n=6) BMI (kg/m2)34.2 (33-48)34.0 (30-56)35.7 (32-48) Waist Circ (cm) 116 ( )117 ( )119 ( ) Steps/Day during Run-In 11,216 ( ,146) 6,001 ( ,196) 9,052 ( ,436)")
43
Baseline Metabolic Parameters by Study Diet Assignment: Median (range) American (n=5) Low GI (n=7) DASH (n=6) Fasting Glucose (mg/dL) 87 (86-98)95 (87-149)93 (84-132) Fasting Insulin (uIU/mL) 12.8 (7-20)17.2 (9-26)14.2 (10-21) HbA1c (%)5.5 (5.1-5.8)6.0 (5.2-8.3)5.9 (5.0-7.2)
 American (n=5) Low GI (n=7) DASH (n=6) Fasting Glucose (mg/dL) 87 (86-98)95 (87-149)93 (84-132) Fasting Insulin (uIU/mL) 12.8 (7-20)17.2 (9-26)14.2 (10-21) HbA1c (%)5.5 ( )6.0 ( )5.9 ( )")
44
Baseline Metabolic Parameters by Study Diet Assignment: Median (range) American (n=5) Low GI (n=7) DASH (n=6) Total Cholesterol (mg/dL) 217 (179-249)196 (135-236)207 (143-301) TG (mg/dL)131 (72-237)112 (68-220)183 (77-285) HDL (mg/dL) 38 (33-47)36 (26-55)39 (33-58) LDL (mg/dL)133 (124-169)116 (68-178)121 (83-200)
 American (n=5) Low GI (n=7) DASH (n=6) Total Cholesterol (mg/dL) 217 ( )196 ( )207 ( ) TG (mg/dL)131 (72-237)112 (68-220)183 (77-285) HDL (mg/dL) 38 (33-47)36 (26-55)39 (33-58) LDL (mg/dL)133 ( )116 (68-178)121 (83-200)")
45
Baseline Metabolic Parameters by Study Diet Assignment: Median (range) American (n=5) Low GI (n=7) DASH (n=6) 24h Mean Systolic BP (mmHg) 114 (98-142)124 (94-138)116 (108-140) 24h Mean Diastolic BP (mmHg) 60 (59-80)75 (55-87)72 (68-79) CRP (mg/dL)0.6 (0.1-1.0)1.2 (0.2-1.4)1.0 (0.5-4.1) IL-6 (pg/mL)2.0 (0.7-6.1)4.2 (1.8-6.5)3.7 (1.3-5.5) Mean IL-6 level in healthy volunteers is 1.77 pg/mL.
 American (n=5) Low GI (n=7) DASH (n=6) 24h Mean Systolic BP (mmHg) 114 (98-142)124 (94-138)116 ( ) 24h Mean Diastolic BP (mmHg) 60 (59-80)75 (55-87)72 (68-79) CRP (mg/dL)0.6 ( )1.2 ( )1.0 ( ) IL-6 (pg/mL)2.0 ( )4.2 ( )3.7 ( ) Mean IL-6 level in healthy volunteers is 1.77 pg/mL.")
46
Subjects’ Baseline Diets vs American Diet American (at 3200 kcal) Study volunteers (mean at baseline) Carbohydrate (% of kcal) 5248 Fat (% of kcal) 3237 Saturated fat (% of kcal) ~1112 Protein (% of kcal) 16
 Study volunteers (mean at baseline) Carbohydrate (% of kcal) 5248 Fat (% of kcal) 3237 Saturated fat (% of kcal) ~1112 Protein (% of kcal) 16")
47
Comparison of Baseline and American Diets American (at 3200 kcal) Study volunteers (mean reported intake during run-in) Calcium (mg) 1055964 Magnesium (mg) 462179 Potassium (mg) 38482087 Sodium (mg) 43874043
 Study volunteers (mean reported intake during run-in) Calcium (mg) Magnesium (mg) Potassium (mg) Sodium (mg)")
48
Comparison of Baseline and American Diets American (at 3200 kcal) Study volunteers (mean intake during run-in) Cholesterol (mg)313383 Fiber (g)3019
 Study volunteers (mean intake during run-in) Cholesterol (mg) Fiber (g)3019")
49
Comparison of 3200 kcal American Diet and Average US Intake American (at 3200 kcal) Average American Intake (NHANES) Fruit Intake (Servings/Day) 5.7*1.1 Vegetable Intake (Servings/Day) 4.12.0 Dairy Intake (Servings/Day) 1.91-1.5 * predominantly juice and juice drinks
 Average American Intake (NHANES) Fruit Intake (Servings/Day) 5.7*1.1 Vegetable Intake (Servings/Day) Dairy Intake (Servings/Day) * predominantly juice and juice drinks")
50
Weight Stability Phase Data Subjects consumed the study diet for two weeks prior to testing. Our goal for weight stability was +/-1% of initial weight. Volunteers wore pedometers for 1 week in each phase and were asked to keep activity levels constant. For this phase, reliable data were available for 5 volunteers in each group.

51
American DASH Low GI Weight Stability Median Change (kg): - 0.1 -0.7 0
:")
52
American DASH Low GI Weight Stability Median Change (steps): -907 -40 1976
:")
53
American DASH Low GI Weight Stability Median Δ (mg/dl): 2 -6 0
:")
54
American DASH Low GI Weight Stability Median Δ (uIU/ml): -3 -4 0
:")
55
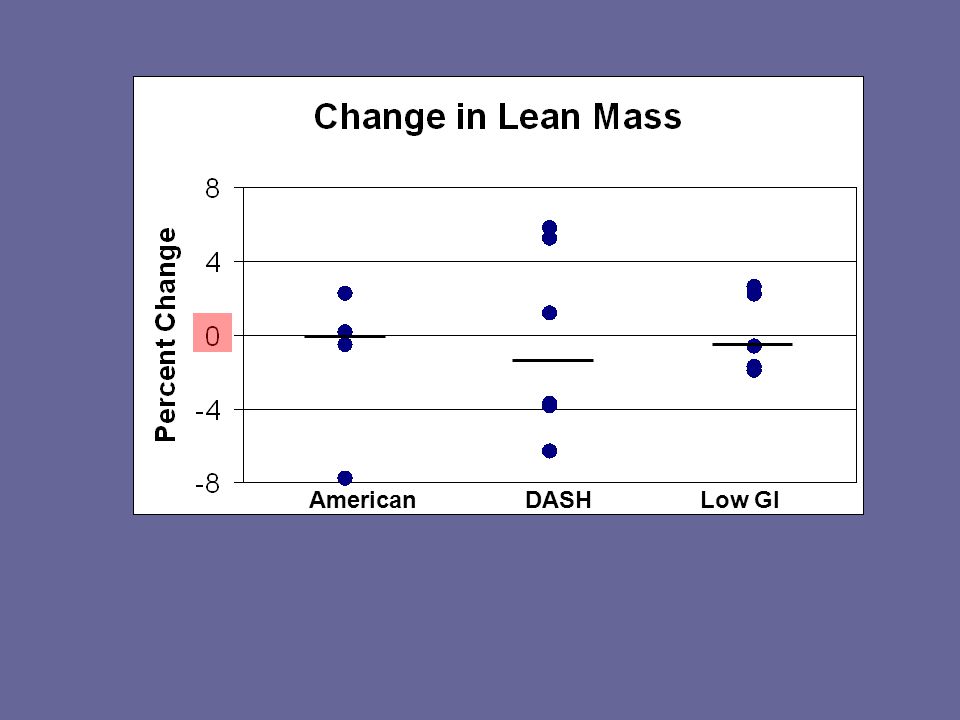
American DASH Low GI Weight Stability Median Δ: -0.6 -1.0 0

56
American DASH Low GI Weight Stability Median Δ: 39 -23 20

57
American DASH Low GI Weight Stability Median Δ: -13 -43 -2

58
American DASH Low GI Weight Stability Median Δ (umol/L): 1 -8 3
:")
59
American DASH Low GI Weight Stability Median Δ (mg/kg/min): 0.4 0.4 0.9
:")
60
American DASH Low GI Weight Stability Median Δ (mg/dl): -7 -9 -3
:")
61
American DASH Low GI Weight Stability Median Δ (mg/dl): -5 -7 1
:")
62
American DASH Low GI Weight Stability Median Δ (mg/dl): -9 -17 6
:")
63
American DASH Low GI Weight Stability Median Δ (mg/dl): 0 -0.3 0.1
:")
64
American DASH Low GI Weight Stability Median Δ (pg/ml): 0.5 -0.4 0.2
:")
65
American DASH Low GI Weight Stability Median Δ (mmHg): 1 -7 -5
:")
66
American DASH Low GI Weight Stability Median Δ (mmHg): - 1 -2 -4
:")
67
Potential Issues Our small n limits our ability to reach conclusions about the diets. At higher kcal levels, our American Diet was better than many of our volunteers’ baseline diets. Our American Diet group tended to be healthier and more active at baseline than the volunteers in the other groups. Although weight change was generally very small in all groups, DASH volunteers tended to have more weight loss.

68
Potential Issues Physical activity tended to increase in the Low GI group from Run-In to Weight Stability. Premenopausal women were included in the study; testing likely occurred during different phases in the menstrual cycle. We relied on calculated GI to develop our low GI diet. We used a basic clamp technique, so we are unable to confirm suppression of gluconeogenesis.

69
Summary of Weight Stability Data Improvements in insulin sensitivity and other metabolic syndrome parameters are possible as a result of dietary changes Hepatic and whole-body IS may improve more with a DASH diet Peripheral IS improved similarly with all three diets The DASH diet may have a more favorable effect on inflammation The low GI diet may have a more favorable effect on HDL Both the DASH and a low-sodium low GI diet may reduce blood pressure after only two weeks

70
Post Weight Loss Data Subjects consumed the 50%-reduced calorie study diet for 8 weeks Weight was re-stabilized at the lower weight for two weeks before testing.

71
American DASH Low GI Median Δ (kg): - 10.6 -10.6 -5.0
:")
72
American DASH Low GI

76
Median Δ (%): 0 -0.2 -0.2
:")
77
American DASH Low GI ↑

78
Future Directions

79
New Study (n = 39) Wt Stable on Western Diet Testing #1 Wt Stable on Western Diet Wt Stable on DASH Diet Wt Stable on Low GI Diet Testing #2 Age range 18-65, no premenopausal women Physical activity and sleep will be controlled New procedures to limit weight change to < 1%, Bod Pods will be done at both timepoints 2 weeks Inpatient 2 weeks Inpatient
 Wt Stable on Western Diet Testing #1 Wt Stable on Western Diet Wt Stable on DASH Diet Wt Stable on Low GI Diet Testing #2 Age range 18-65, no premenopausal women Physical activity and sleep will be controlled New procedures to limit weight change to < 1%, Bod Pods will be done at both timepoints 2 weeks Inpatient 2 weeks Inpatient")
80
Acknowledgements Jan Breslow, MD Jeanne Walker, NP Suzanne Magnotta, MS, RD RUH Bionutrition Dept. Inpatient and Outpatient Nursing Staff Rogosin Institute Laboratory Our dedicated volunteers Study funding from the Rockefeller University CTSA Pilot Grant Program Salary support from the KL2 Clinical Scholars’ Program

81
THANK YOU FOR YOUR ATTENTION!

Similar presentations


![LIFESTYLE MODIFICATIONS FOR PREVENTING HEART DISEASE [e.g. HEART ATTACKS] [ primary prevention of coronary artery disease ] DR S. SAHAI MD [Med.], DM [Card]](/19/5810187/big_thumb.jpg "LIFESTYLE MODIFICATIONS FOR PREVENTING HEART DISEASE [e.g. HEART ATTACKS] [ primary prevention of coronary artery disease ] DR S. SAHAI MD [Med.], DM [Card]>")

