Download presentation
Presentation is loading. Please wait.

1
Economic and Social Cost of Crime
Crime and Justice User Day Joe Perman: Assistant Economist, Scottish Government Economic and Social Cost of Crime Application in Criminal Careers

2
Purpose What data we use What we use the cost estimates for
Total costs – useful to know?? Value for money of interventions e.g Who should we target with limited resources What else could we be doing?

3
Data sources Economic and Social Costs of Crime
Scottish Crime and Justice Survey Reconviction Rates in Scotland Police Recorded and Cleared Up Crime Criminal Proceedings in Scottish Courts About taking estimates from England and Wales, and applying them to Scottish offending data to estimate the economic and social costs of crime To show you the range of data we use

4
Anticipation Consequence Response Economic and Social Costs of Crime
Security Insurance Consequence Property, lost output, health services, emotional and physical impact Response Criminal Justice System (courts, police, prisons, etc)
")
6
Multipliers We may have data on the number of police recorded crime or convictions – but we are interested in the actual incidence of crime i.e. including those which are not reported or recorded for various reasons

7
CONVICTION RATE CLEAR-UP RATE POLICE RECORDED CRIME RATE ACTUAL CRIME RATE

8
1 2 4 1 3 4 9 388 SERIOUS ASSAULT SHOPLIFTING

9
How we get there Charges proved from Criminal Proceedings
Police clear up rate Police recorded crimes Scottish Crime and Justice Survey (and business surveys, research)
")
10
Table of multipliers and costs
Crime/offence group Scotland crime/Offence name Conviction Cleared up Recorded Actual incidence Unit cost (£2010/11) Non-sexual crimes of violence Murder 1 £ ,736,998 Serious assault 2 3 11 £ ,504 Robbery and assault with intent to rob 5 6 £ ,670 Other non-sexual crimes of violence 14 £ ,591 Crimes of indecency Rape & attempted rape 17 31 176 £ ,487 Indecent assault etc 7 12 116 £ ,111 Other crimes of indecency £ ,137 Crimes of dishonesty Housebreaking 4 16 36 £ ,891 Theft by OLP 20 63 £ Theft by from a motor vehicle (OLP) 70 £ ,022 Theft of a motor vehicle & contents including taking & driving 8 18 19 £ ,927 Theft by shoplifting 61 £ Other theft 23 Other crimes of dishonesty 13 Fire-raising, vandalism etc Fire-raising 25 148 £ ,031 Vandalism, etc 138 Miscellaneous offences Minor assault £ ,913 Minor assault of an emergency worker £ ,714 Breach of the peace Drunkenness Other miscellaneous offences Other crimes Crimes against public justice Handling an offensive weapon Drugs
 Non-sexual crimes of violence. Murder. 1. £ 1,736,998. Serious assault £ 25,504. Robbery and assault with intent to rob £ 8,670. Other non-sexual crimes of violence. 14. £ 9,591. Crimes of indecency. Rape & attempted rape £ 83,487. Indecent assault etc £ 31,111. Other crimes of indecency. £ 2,137. Crimes of dishonesty. Housebreaking £ 3,891. Theft by OLP £ 755. Theft by from a motor vehicle (OLP) 70. £ 1,022. Theft of a motor vehicle & contents including taking & driving £ 4,927. Theft by shoplifting. 61. £ 131. Other theft. 23. Other crimes of dishonesty. 13. Fire-raising, vandalism etc. Fire-raising £ 1,031. Vandalism, etc Miscellaneous offences. Minor assault. £ 6,913. Minor assault of an emergency worker. £ 1,714. Breach of the peace. Drunkenness. Other miscellaneous offences. Other crimes. Crimes against public justice. Handling an offensive weapon. Drugs.")
11
An assumption too far? Multipliers fine at population level analysis, but what about small samples? Individuals? One conviction of housebreaking means we guess that person has actually broke into 9 Some people better at not getting caught? No control group – we are assuming that without intervention offending frequency would have remained at average rate seen over pre-intervention comparison period. However, offending may continued to increase, or project may have intervened at peak of offending and it would have naturally fallen anyway. Also, overall crime has been falling (x%), should this have been this control group?
, should this have been this control group")
12
Applications Total Cost of Crime
Value for Money of Criminal Interventions Reducing Reoffending Project Presumption against short term sentences Criminal careers Males, females, under/over 21 Persistent offenders vs long term prisoners

13
Total costs - Tree plot Based on police recorded crimes
Miscellaneous offences Crimes of indecency Crimes of dishonesty Crimes of violence Other crimes Vandalism and fire-raising Based on police recorded crimes

14
Breakdown of the costs of crime
This is taken from a wider analysis of the total costs of crime in Scotland. Used to illustrate the breakdown between in the economic and social costs and their relative magnitude. Wont be the exact same because of offence mix. The criminal justice system costs are nearly 50% police costs, with the next highest being prisons at around 20%. savings to the CJS £2.5 million Savings to wider society £8 million

15
Value for money of Criminal Justice Interventions
Ex-Post – evaluating interventions Ex-Ante – using historical offending data to look at “what if” scenarios Both aimed at identifying the value for money in policies aimed at reducing reoffending based on the costs of crime and therefore the potential savings from reducing it Costs of offending – and subsequent savings of reduced offending. Doesn’t look at other benefits – quality of life of offenders, employment opportunities, health, social services etc

16
Persistent Offenders Project
Decrease from 2,800 to 1,900 --> 32% fall

17
Persistent Offenders Project – Pre and post intervention crime rates

18
Persistent Offenders Project - Total Costs
Cost of crime Before After Savings £30 million £19 million £11 million Project Cost = £1million over the 3 years NET BENEFITS of £10 million

19
illustrative!! we are not implying causality
use the estimates to illustrate the potential savings available Magnitudes, rather than pounds and pence Should be used in conjunction with other quantitative and qualitative data

20
Presumption against short sentences
Don’t know the impact on reoffending by moving someone from custodial sentence to community sentence Differing characteristics etc Use breakeven analysis to find the reducing in offending needed to balance out the increased costs Increased costs Incarceration effect – not locked up so still able to offend

21
Reoffending Rates/Frequencies
Reconviction rate over time Average annual number of reconvictions Frequency gives much better information than just the binary yes/no

22
Custodial Cohort Costs
This is illustrated below in Figure 3 for the 3,262 annual unique offenders who are given short custodial sentences. The economic and social costs of reoffending for this cohort begin at almost £250 million in the first year and fall to around £75 million by year 10 as the average level of reoffending decreases. We can compare these ‘do nothing’ costs against the costs of a policy bringing about a change in sentencing and reoffending behaviour and use the difference to estimate any resulting costs and savings.

23
£6m 1% over a ten-year period, it only takes a marginal reduction in the frequency of reoffending (1%) for the increased costs of the change in sentencing behaviour to be balanced by the longer-term savings from reduced crime If offending reduced to levels of current community sentences we find that potential net benefits increase in each year, reaching a steady state level of nearly £290 million per annum after 10 years. Community sentences £4.25 million Custodial sentences £2.5 million Incarceration effect £4.25 million Net Costs £6 million per annum
 for the increased costs of the change in sentencing behaviour to be balanced by the longer-term savings from reduced crime. If offending reduced to levels of current community sentences we find that potential net benefits increase in each year, reaching a steady state level of nearly £290 million per annum after 10 years. Community sentences £4.25 million. Custodial sentences £2.5 million. Incarceration effect £4.25 million. Net Costs £6 million per annum.")
24
Criminal Careers Follow cohort over 10 years using unit level conviction data Split by age and gender to start with Only looking at the ‘average’ across each cohort, will be differing distinct ‘types’ within each groups

25
Criminal Careers Frequency of convictions

26
Cost of Reoffending After applying MULTIPLIERS and unit costs

27
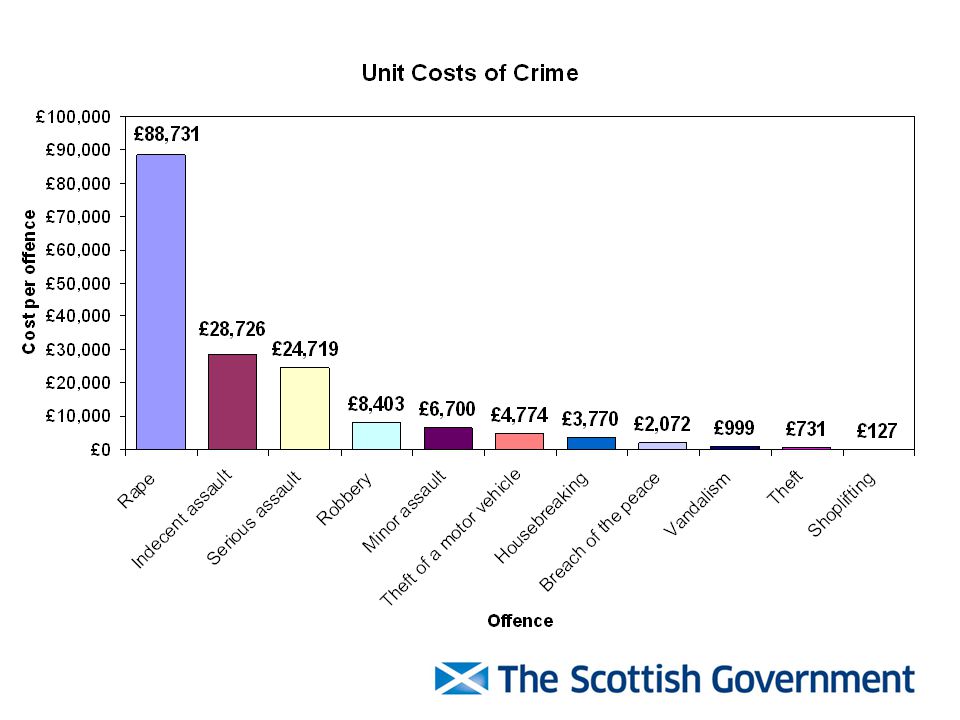
Average cost per offence

28
Persistent versus long term
Where should we focus limited resources The ‘serious’, high tariff long term prisoners are an easy target But what about the harder segment, low tariff, persistent offenders?

29
Frequency of convictions

30
Average cost per offender

31
Cost as a proxy for seriousness

32
Average cost per offender
Average per offender Number in segment Prolific (3 previous) £ ,000 20,365 Very short term (< 6 months) £ ,000 4,139 Long term (> 4 years) £ ,000 401 Long termers low average cost because already spend lots of money on them?? Bit far fetched.
 £ 180, ,365. Very short term. (< 6 months) £ 277,000. 4,139. Long term. (> 4 years) £ 147, Long termers low average cost because already spend lots of money on them Bit far fetched.")
33
Size does matter? Prolific (3+ previous) Very short termers
£3.9 billion Very short termers £1.1 billion Long termers £59 million Violence Dishonesty Damage Other Sexual When add in size of of target segment, the total Questions: those with 3 or more convictions will no doubt pass through prison at some point so is it nearly just same group. Where would be the best place to target them. Spread resources too thinly?

34
What next?? Defining the segments?
Where else could you see cost estimates being used? ???

Similar presentations

 Sydney Institute of Criminology.>")


 Falling crime:>")


