Download presentation
Presentation is loading. Please wait.

2
Voters and Voter Behavior Unit 2 – Chaps. 13/14

3
Political Participation Refers to the ways in which Americans get involved in politics ◦ We do very poorly ◦ Voter turnout very bad

4
1) People under 18 2) Convicted felons (10 states) 3) Clinically insane 4) Non-citizens Who doesn’t get to vote? Why vote? Civic duty – to be a good citizen In 2012 nearly 90 million people did not vote! Who? young, uneducated, unmarried, minority

5
Purposes of Elections Regular free elections ◦ guarantee mass political action ◦ enable citizens to influence the actions of their government Popular election confers legitimacy on a government that can be achieved no other way Regular elections also ensure that government is accountable to the people it serves

6
Purposes of Elections Electorate ◦ Citizens eligible to vote Mandate: ◦ A command, indicated by an electorate’s voters, for the elected officials to carry out their platforms ◦ Sometimes the claim of a mandate is suspect because voters are not so much endorsing one candidate as rejecting the other

7
Types of Elections Primary Election in which voters decide which of the candidates within a party will represent the party in the general election. Closed primary: a primary election in which only a party’s registered voters are eligible to vote Open primary: a primary in which party members, independents, and sometimes members of the other party are allowed to vote Blanket primary: a primary in which voters can cast votes back and forth between candidates from any party.

8
Initiative, Referendum, and Recall Initiative ◦ An election that allows citizens to propose legislation and submit it to the state electorate for popular vote Referendum ◦ An election whereby the state legislature submits proposed legislation to the state’s voters for approval Recall ◦ Voters can remove an incumbent from office by popular vote ◦ Are very rare

9
Conventional Political Participation Following and discussing politics Campaign activities – contributing money Voting Contacting public officials – letters, e- mails, phone calls Group activities (political parties, interest groups, etc.)
")
10
Unconventional Political Participation Boycotts Protests Picketing Rioting and violence – not happy with the process or no faith in the system (small minority)
")
11
Voting Eligibility Elimination of property requirements (1830) Elimination of racial discrimination in 15th Amendment (1870) Elimination of sexual discrimination in 19th Amendment (1920) Elimination of poll taxes in 24th Amendment (1964) Elimination of literacy tests in Voting Rights Act (1965) Elimination of several state registration laws in Voting Rights Act (1993) (Motor Voter Act – tied to Motor Registration) Reduction of voting age to 18 in 26th Amendment (1971)
 Elimination of racial discrimination in 15th Amendment (1870) Elimination of sexual discrimination in 19th Amendment (1920) Elimination of poll taxes in 24th Amendment (1964) Elimination of literacy tests in Voting Rights Act (1965) Elimination of several state registration laws in Voting Rights Act (1993) (Motor Voter Act – tied to Motor Registration) Reduction of voting age to 18 in 26th Amendment (1971)")
12
Voting Behavior What motivates people to participate? Why are Americans so apathetic about the voting process? Turnout – the proportion of voting-age public (about 40%) who regularly vote in American elections Turnout is important in a winner- takes-all system George W. Bush won Florida by 537 votes!
 who regularly vote in American elections Turnout is important in a winner- takes-all system George W. Bush won Florida by 537 votes!.")
13
Patterns in Voter Turnout Turnout: the proportion of the voting-age public that votes ◦ 40% of the eligible adult population votes ◦ 25% are occasional voters ◦ 35% rarely vote

14
Patterns in Voter Turnout Education: Voters tend to be more educated Income: Consistent voters have higher incomes Age: Younger people vote less Gender: Women vote at the same rate or slightly higher rate than men Young women – more likely Democrat Race and Ethnicity: ◦ Whites vote more regularly than African Americans – related to income and educational differences in the two groups ◦ Hispanics vote less than African Americans ◦ Have potential to wield much influence given their increasing size Interest in politics: Those interested in politics vote more Region: South/Midwest – Republican New England/West Coast – Democrats Cities – Democrats Rural - Republicans

15
Where do I belong?? ◦ Party identification is often a voter's central political reference symbol. ◦ Party identification generally come from one's parents. However, party ID can be affected by a number of factors such as education, peers, charismatic personalities, cataclysmic events, and intense social issues.

16
Political Identification by Group

17
Young People and Issues- 2012

18
Hispanic voters are becoming increasingly important.- 2008 Between 2000 and 2004, Hispanics accounted for half of the growth in the U.S. population. ◦ Out of every 100 Hispanics, 40 were voting age citizens, 23 were likely to be registered and only 18 were likely to vote. ◦ But on Super Tuesday in California 2008, Hispanics were 30% of the Democratic primary electorate, up from about 17% four years ago

19
State sizes are determined by the number of electoral votes.

20
Hispanic Population in the United States: 1970 to 2050 Source of Data and Year Hispanic Population (in millions) Percent Hispanic of the total population Census Year 1970 9.64.7% 1980 14.66.4% 1990 22.49.0% 2000 35.312.5% Projections 2010* 47.815.5% 2020* 59.717.8% 2030* 73.020.1% 2040* 87.722.3% 2050* 102.6 24.4% ote: *Projected population as of July 1SOURCE: U.S. Census Bureau, 1970, 1980, 1990, and 2000 Decennial Censuses; Population Projections, July 1, 2010 to July 1, 2050.

21
Importance of Religion-2004-08 In 2004 where an individual stood on religion was a good predictor of how he would vote. ◦ The more religiously observant groups turned out heavily for George Bush ◦ The less observant ones for John Kerry. The fastest growing Christian denominations are evangelical, and they gave Mike Huckabee a boost in Iowa and in the South on Super Tuesday. But the number of people with no religious affiliation is growing. ◦ These individuals are now about 16% of the population, up from 8% in the 1980s. ◦ They're reliable Democratic voters. Mike Huckabee

23
More Likely to be a Democrat Women Poor “Blue Collar” Workers – hourly workers Young Jewish Urban Students Minorities Rustbelt resident- Blue states

24
More Likely to be a Republican Men Wealthy “White Collar” Workers – salaried workers Old Protestant- Evangelical Sunbelt resident- South and West (Red States) Highly educated Northern/Western European Ethnic Background Suburban Married w/children
 Highly educated Northern/Western European Ethnic Background Suburban Married w/children")
25
Reasons for Voting Duty and obligation of citizenship Belief that every vote counts Predicted closeness of an election Desire to influence elections & policy Identification with a party or candidate

26
Reasons NOT to vote Lack of interest, too busy Lack of faith in system Lack of choices between candidates Domination of area by one party Weather Lack of transportation Illness on voting day Failure to obtain absentee ballot Out of district on voting day

28
Political Knowledge

30
Voter Turnout 50%+ participation in presidential elections 33% for high state offices 33% + for congressional midterm elections 20% for lower state and all local elections 38% votes every two years in elections (core electorate) 2014 – 38%
 2014 – 38%")
31
Reasons to Vote for a Particular Candidate Party Affiliation Policy Vision Interest in a particular issue Personal Appeal

32
1) 2 states allow felons to vote from jail 2) 2 states require first time voters to show ID 3) 3 states require a photo ID 4) 18 states require some form of ID 5) 12 states require registration at least 30 days prior to the election Can states deter you from voting? Is this a problem?

33
Would you vote?

34
Efforts to Improve Voter Turnout Easier Registration and Absentee Voting Make Election Day a Holiday Strengthen Parties Other suggestions ◦ Holding fewer elections ◦ Proportional representation system for congressional elections ◦ Saturday or Sunday election day ◦ Making voting mandatory ◦ Tax credits for voting ◦ Election weeks rather than election days ◦ Internet voting – FRAUD CONCERNS

35
The Party Conventions Out-of-power party holds its convention first, usually in late July/August, followed in August/Sept by party holding the presidency Conventions were decision-making body in the 19 th century Today the convention is fundamentally different ◦ Nominations settled well in advance of the convention because of primaries

36
2012 National Conventions Democrats Republicans September 3 – 6, 2012 Charlotte, NC August 27 – 30, 2012 Tampa, FL

37
Primary or Caucus There are two ways to elect the party nominee for president They are held in each state and territories (but these guys don’t get to vote in the election) It is not in the Constitution and was created over time by the parties They are held between January and June before the November election Each party determines how many delegates are assigned to each state
 It is not in the Constitution and was created over time by the parties They are held between January and June before the November election Each party determines how many delegates are assigned to each state")
38
Primary or Caucus There are different systems: ◦ Winner-take-all primary - who gets the most votes in a state get all the delegates Democrats don’t use it because it is not representative ◦ Proportional representation primary – delegates assigned in proportion to the number of votes – if over 15% of the vote ◦ Caucus – party members meet in small groups to select delegates to the national convention

40
Primaries Caucuses ◦ More democratic ◦ More representative ◦ A rigorous test for the candidate ◦ Caucus participants more informed; more interactive and informative ◦ Unfair scheduling affects outcomes ◦ Frontloading (being first in the primary calendar) gives some primary states an advantage Frontloading is the tendency to choose an early date on the primary schedule
 gives some primary states an advantage Frontloading is the tendency to choose an early date on the primary schedule")
41
Primary voting can bring: Crossover voting: participation in the primary of a party with which the voter is not affiliated Raiding: An organized attempt by voters of one party to influence the primary results of the other party Runoff primary: a second primary election between the two candidates receiving the greatest number of votes in the first primary

42
2012 Primary Results http://www.cnn.com/election/2012/primaries.html

43
The Primaries and those Pesky Delegates (and Superdelegates) Democrats ◦ There are currently 4,049 total delegates to the Democratic National Convention, including 3,253 pledged delegates and 796 unpledged or superdelegates. The total number of delegate votes needed to win the nomination is 2,025. Republicans ◦ There are currently 2,380 total delegates to the Republican National Convention, including 1,917 pledged delegates and 463 unpledged delegates. The total number of delegate votes needed to win the nomination is 1,191. Each party holds a primary or a caucus in each state Then, the political elite from each party are selected as pledged delegates These delegates must vote as their state voted on first ballot Both parties have unpledged delegates as well who are not obligated to vote with state delegates

44
The Basic Structure of American Political Parties Unpledged (called Superdelegates in the Democratic Party) do not have to indicate a candidate preference and do not have to compete for their position. These are typically members of the national committee, elected officials like senators or governors, or party leaders

45
The Constitutional Basis for Presidential Elections The Constitution’s Framers doubted the public’s ability to directly elect its leaders Article II: Electors from each state vote directly for president 1804: The 12th Amendment changed the electoral process to a presidential/vice- presidential ticket Verifying the Electoral College vote in the House of Representatives, 1913

46
45 The Presidential Election Process The public votes for president in November every four years The members of the Electoral College cast the official votes for president the next month, in December President is sworn in at noon on Jan. 20 the following year

47
The Presidential Election Process Each state has a designated number of electors In most states, electoral votes are awarded on a “winner take all” basis; Nebraska and Maine use proportional distribution Out of 538 electoral votes, candidates need 270 to win election Electoral College votes by state

48
◦ Each state gets as many electors as members of Congress (538 total) ◦ These electors are encouraged to represent the vote of their state using a winner-take-all system. (If CA votes for GOP, all 55 electors vote GOP, even if the total popular vote was 51%- 49%) ◦ Magic number: 270 electoral votes are needed to become president. ◦ Representatives of each state who cast the final ballots that actually elect a president ◦ District of Columbia is given 3 electoral votes (23 rd Amendment) ◦ Vote of Electors First Monday after first Wednesday in December Counted before joint session of Congress in January by the Vice President. ◦ Founding Fathers wanted a way to prevent the people from outright electing the president...they were afraid of Joe Six Pack! What are electoral votes?
 ◦ Magic number: 270 electoral votes are needed to become president. ◦ Representatives of each state who cast the final ballots that actually elect a president ◦ District of Columbia is given 3 electoral votes (23 rd Amendment) ◦ Vote of Electors First Monday after first Wednesday in December Counted before joint session of Congress in January by the Vice President. ◦ Founding Fathers wanted a way to prevent the people from outright electing the president...they were afraid of Joe Six Pack. What are electoral votes .")
49
The Electoral College in the 19 th Century 12 th Amendment (1804) ◦ Attempt to remedy the confusion between the selection of vice presidents and presidents that emerged in the election of 1800 ◦ Provided for separate elections for each office, with each elector having only one vote to cast for each ◦ In event of a tie, the election still went to the House ◦ Top three candidates go to House ◦ Each state House delegation casts one vote
 ◦ Attempt to remedy the confusion between the selection of vice presidents and presidents that emerged in the election of 1800 ◦ Provided for separate elections for each office, with each elector having only one vote to cast for each ◦ In event of a tie, the election still went to the House ◦ Top three candidates go to House ◦ Each state House delegation casts one vote")
50
The Electoral College in the Twentieth and Twenty-First Centuries Electoral college crises ◦ At times a candidate can win the Electoral College vote without having won the popular vote Reapportionment matters ◦ Representation of states in the Electoral College is altered every ten years to reflect population shifts ◦ Party in power can work to earn more districts as new lines are drawn.

51
1.Winner of popular vote doesn’t always become president (1824, 1876, 1888, 2000) 2.Nothing requires electors to follow the votes of their states. 3.If no one wins majority of elector votes, H of R decides election. 4. Big “swing” states (OH, FL) become key to an election, candidates spend most time/$ there. Flaws in the system
 become key to an election, candidates spend most time/$ there. Flaws in the system.")
52
Electoral College 2008 Obama 69,456,897 365 McCain 59,534,814 173

54
Electoral votes – 332206 States won – 2624 Popular vote – 65,915,796: 60,933,500 Percentage – 51.1%47.2%

56
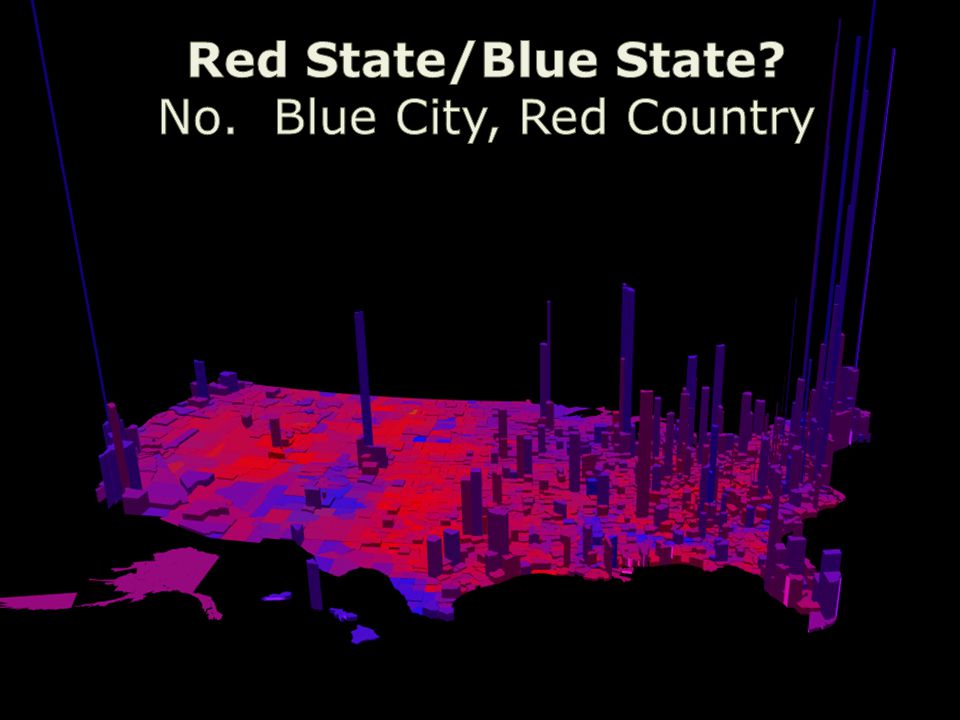
RED and BLUE states

57
Congressional Elections Very different from presidential elections ◦ Lesser known candidates, more difficulty getting media attention Incumbency Advantage (over 90% advantage) ◦ Better known, highly visible in the district ◦ Representatives can hire 18 permanent and 4 non- permanent aides ◦ Fundraising is easier ◦ Can use office resources (franking privilege, staff, travel, etc.) ◦ Can cite work already done in Washington ◦ Incumbency often scares of good challengers
 ◦ Better known, highly visible in the district ◦ Representatives can hire 18 permanent and 4 non- permanent aides ◦ Fundraising is easier ◦ Can use office resources (franking privilege, staff, travel, etc.) ◦ Can cite work already done in Washington ◦ Incumbency often scares of good challengers")
58
Senate: 1/3 of chamber up for election every 2 years (6 year terms) House: all 435 districts up for election every 2 years Incumbents reign supreme Most House districts considered safe for one of the parties—why? The parties help create the districts! Leads to many one-sided elections which decreases voter turnout and increases partisanship Congressional Elections

59
When incumbents lose it is generally due to: ◦ Redistricting Gerrymandering ◦ Scandals ◦ Presidential Coattails

61
Midterm Congressional Elections Election takes place in the middle of a presidential term ◦ President’s party usually loses seats in midterms ◦ Tendency for voters to punish the president’s party more severely in the sixth year of an eight year presidency - 6th year itch Retrospective voting Senate elections less inclined to the 6 th year itch

Similar presentations