Download presentation
Presentation is loading. Please wait.

1
Powertrain & Calibration 101
John Bucknell DaimlerChrysler Powertrain Systems Engineering December 4, 2006

2
Powertrain & Calibration Topics
Background Powertrain terms Thermodynamics Mechanical Design Combustion Architecture Cylinder Filling & Emptying Aerodynamics Calibration Spark & Fuel Transients & Drivability

3
What is a Powertrain? Engine that converts thermal energy to mechanical work Particularly, the architecture comprising all the subsystems required to convert this energy to work Sometimes extends to drivetrain, which connects powertrain to end-user of power

4
Characteristics of Internal Combustion Heat Engines
High energy density of fuel leads to high power to weight ratio, especially when combusting with atmospheric oxygen External combustion has losses due to multiple inefficiencies (primarily heat loss from condensing of working fluid), internal combustion has less inefficiencies Heat engines use working fluids which is the simplest of all energy conversion methods
, internal combustion has less inefficiencies. Heat engines use working fluids which is the simplest of all energy conversion methods.")
5
Reciprocating Internal Combustion Heat Engines
Characteristics Slider-crank mechanism has high mechanical efficiency (piston skirt rubbing is source of 50-60% of all firing friction) Piston-cylinder mechanism has high single-stage compression ratio capability – leads to high thermal efficiency capability Fair to poor air pump, limiting power potential without additional mechanisms
 Piston-cylinder mechanism has high single-stage compression ratio capability – leads to high thermal efficiency capability. Fair to poor air pump, limiting power potential without additional mechanisms.")
6
Reciprocating Engine Terms
Vc = Clearance Volume Vd = Displacement or Swept Volume Vt = Total Volume TC or TDC = Top or Top Dead Center Position BC or BDC = Bottom or Bottom Dead Center Position Compression Ratio (CR)
")
7
Further explanation of aspects of Compression Ratio

8
Reciprocating Engines
Most layouts created during second World War as aircraft manufacturers struggled to make the least-compromised installation

9
Thermodynamics Otto Cycle Diesel Cycle Throttled Cycle
Supercharged Cycle Source: Internal Comb. Engine Fund.

10
BMEP = IMEP – PMEP – FFMEP
Thermodynamic Terms MEP – Mean Effective Pressure Average cylinder pressure over measuring period Torque Normalized to Engine Displacement (VD) BMEP – Brake Mean Effective Pressure IMEP – Indicated Mean Effective Pressure MEP of Compression and Expansion Strokes PMEP – Pumping Mean Effective Pressure MEP of Exhaust and Intake Strokes FFMEP – Firing Friction Mean Effective Pressure BMEP = IMEP – PMEP – FFMEP
 BMEP – Brake Mean Effective Pressure. IMEP – Indicated Mean Effective Pressure. MEP of Compression and Expansion Strokes. PMEP – Pumping Mean Effective Pressure. MEP of Exhaust and Intake Strokes. FFMEP – Firing Friction Mean Effective Pressure. BMEP = IMEP – PMEP – FFMEP.")
11
Thermodynamic Terms continued
Work = Power = Work/Unit Time Specific Power – Power per unit, typically displacement or weight Pressure/Volume Diagram – Engineering tool to graph cylinder pressure

12
Indicated Work TDC BDC Source: Design and Sim of Four Strokes

13
Pumping Work TDC BDC Source: Design and Sim of Four Strokes

14
History of Internal Combustion
1878 Niklaus Otto built first successful four stroke engine 1885 Gottlieb Daimler built first high-speed four stroke engine 1878 saw Sir Dougald Clerk complete first two-stroke engine (simplified by Joseph Day in 1891) 1891 Panhard-Levassor vehicle with front engine built under Daimler license
 1891 Panhard-Levassor vehicle with front engine built under Daimler license.")
15
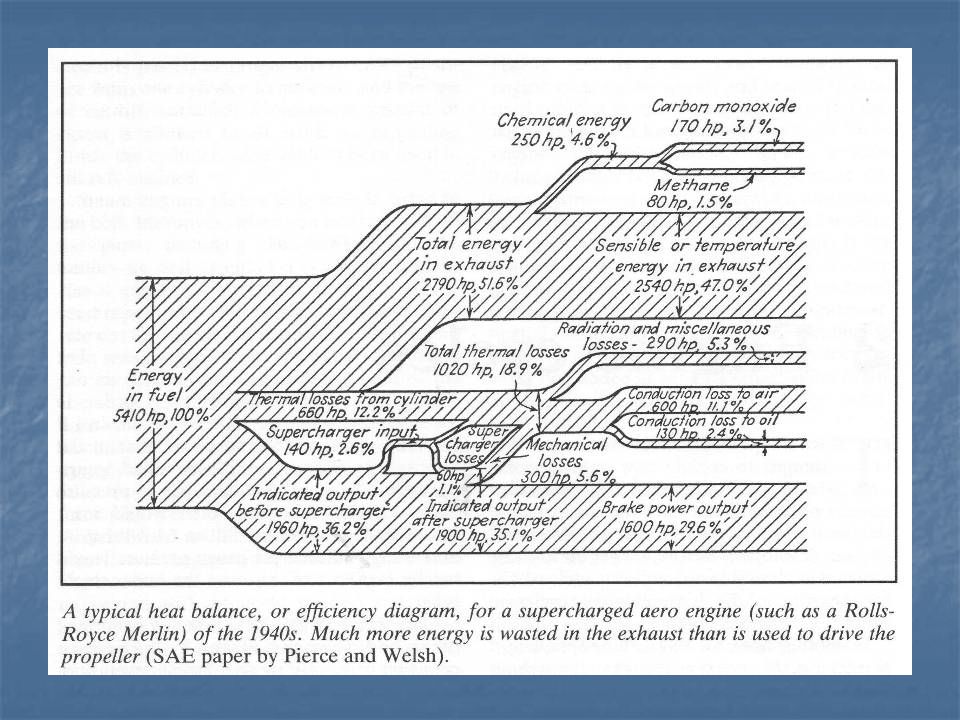
in Passenger Car Engines
Energy Distribution in Passenger Car Engines Source: SAE (Ricardo)
")
17
Source: Advanced Engine Technology
Using Exhaust Energy Highest expansion ratio recovers most thermal energy Turbines can recover heat energy left over from gas exchange Energy can be used to drive turbo-compressor or fed back into crank train Source: Advanced Engine Technology

18
Supercharging Increases specific output by increasing charge density into reciprocator Many methods of implementation, cost usually only limiting factor Source: Internal Comb. Engine Fund.

19
Mechanical Design

21
Two Valve Valvetrain Pushrod OHV (Type 5) HEMI 2-Valve (Type 5)
SOHC 2-Valve (Type 2)
")
22
Four Valve Valvetrain DOHC 4-Valve (Type 2) SOHC 4-Valve (Type 3)
Desmodromic

23
Valvetrain Specific Power = f(Air Flow, Thermal Efficiency)
Air flow is an easier variable to change than thermal efficiency 90% of restriction of induction system occurs in cylinder head Cylinder head layouts that allow the greatest airflow will have highest specific power potential Peak flow from poppet valve engines primarily a function of total valve area More/larger valves equals greater valve area

24
Combustion Terms Brake Power – Power measured by the absorber (brake) at the crankshaft BSFC - Brake Specific Fuel Consumption Fuel Mass Flow Rate / Brake Power grams/kW-h or lbs/hp-h LBT Fuelling - Lean Best Torque Leanest Fuel/Air to Achieve Best Torque LBT = FA or Lambda Thermal Enrichment – Fuel added for cooling due to component temperature limit Injector Pulse Width - Time Injector is Open

25
Combustion Terms continued
Spark Advance – Timing in crank degrees prior to TDC for start of combustion event (ignition) MBT Spark – Maximum Brake Torque Spark Minimum Spark Advance to Achieve Best Torque Burn Rate – Speed of Combustion Expressed as a fraction of total heat released versus crank degrees MAP - Manifold Absolute Pressure Absolute not Gauge (does not reference barometer)
 MBT Spark – Maximum Brake Torque Spark Minimum Spark Advance to Achieve Best Torque. Burn Rate – Speed of Combustion Expressed as a fraction of total heat released versus crank degrees. MAP - Manifold Absolute Pressure Absolute not Gauge (does not reference barometer)")
26
Combustion Terms continued
Knock – Autoignition of end-gasses in combustion chamber, causing extreme rates of pressure rise. Knock Limit Spark - Maximum Spark Allowed due to Knock – can be higher or lower than MBT Pre-Ignition – Autoignition of mixture prior to spark timing, typically due to high temperatures of components Combustion Stability – Cycle to cycle variation in burn rate, trapped mass, location of peak pressure, etc. The lower the variation the better the stability.

27
Engine Architecture Influence on Performance
Intake & Exhaust Manifold Tuning Cylinder Filling & Emptying Momentum Pressure Wave Aerodynamics Flow Separation Wall Friction Junctions & Bends Induction Restriction Exhaust Restriction (Backpressure) Compression Ratio Valve Events
 Compression Ratio. Valve Events.")
28
Intake Tuning for WOT Performance
Intake manifolds have ducts (“runners”) that tune at frequencies corresponding to engine speed, like an organ pipe Longer runners tune at lower frequencies Shorter runners tune at higher frequencies Tuning increases local pressure at intake valve thereby increasing flow rate Duct diameter is a trade-off between velocity and wall friction of passing charge
 that tune at frequencies corresponding to engine speed, like an organ pipe. Longer runners tune at lower frequencies. Shorter runners tune at higher frequencies. Tuning increases local pressure at intake valve thereby increasing flow rate. Duct diameter is a trade-off between velocity and wall friction of passing charge.")
29
Exhaust Tuning for WOT Performance
Exhaust manifolds tune just as intake manifolds do, but since no fresh charge is being introduced as a result – not as much impact on volumetric efficiency (~8% maximum for headers) Catalyst performance usually limits production exhaust systems that flow acceptably with little to no tuning
 Catalyst performance usually limits production exhaust systems that flow acceptably with little to no tuning.")
30
Tuned Headers Tuned Headers generally do not appear on production engines due to the impairment to catalyst light-off performance (usually a minimum of 150% additional distance for cold-start exhaust heat to be lost). Performance can be enhanced by 3-8% across 60% of the operating range.
. Performance can be enhanced by 3-8% across 60% of the operating range.")
31
Momentum Effects Pressure loss influences dictate that duct diameter be as large as possible for minimum friction Increasing charge momentum enhances cylinder filling by extending induction process past unsteady direct energy transfer of induction stroke (ie piston motion) Decreasing duct diameter increases available kinetic energy for a given mass flux Therefore duct diameter is a trade-off between velocity and wall friction of passing charge
 Decreasing duct diameter increases available kinetic energy for a given mass flux. Therefore duct diameter is a trade-off between velocity and wall friction of passing charge.")
32
Pressure Wave Effects Induction process and exhaust blowdown both cause pressure pulsations Abrupt changes of increased cross-section in the path of a pressure wave will reflect a wave of opposite magnitude back down the path of the wave Closed-ended ducts reflect pressure waves directly, therefore a wave will echo with same amplitude

33
Pressure Wave Effects con’t
Friction decreases energy of pressure waves, therefore the 1st order reflection is the strongest – but up to 5th order have been utilized to good effect in high speed engines (thus active runners in F1 in Y2K) Plenums also resonate and through superposition increase the amplitude of pressure waves in runners – small impact relative to runner geometry
 Plenums also resonate and through superposition increase the amplitude of pressure waves in runners – small impact relative to runner geometry.")
34
Effects of Intake Runner Geometry

35
Tuning in Production I4 Engine

36
Aerodynamics Losses due to poor aerodynamics can be equal in magnitude to the gains from pressure wave tuning Often the dominant factory in poorly performing OE components If properly designed, flow of a single-entry intake manifold can approach 98% of an ideal entrance on a cylinder head port (steady state on a flow bench)
")
37
Aerodynamics con’t Flow Separation
Literally same phenomenon as stall in wing elements – pressure in free stream insufficient to ‘push’ flow along wall of short side radius Recirculation pushes flow away from wall, thereby reducing effective cross-section: so-called “vena contracta” Simple guidelines can prevent flow separation in ducts – studies performed by NACA in the 1930s empirically established the best duct configurations

38
Aerodynamics con’t Wall Friction Junctions & Bends
Surface finish of ducts need to be as smooth as possible to prevent ‘tripping’ of flow on a macro level Junctions & Bends Everything from your fluid dynamics textbook applies Radiused inlets and free-standing pipe outlets Minimize number of bends Avoid ‘S’ bends if at all possible

39
Induction Restriction
Air cleaner and intake manifolds provide some resistance to incoming charge Power loss related to restriction almost directly a function of ratio between manifold pressure (plenum pressure upstream of runners) and atmospheric
 and atmospheric.")
40
Exhaust Restriction

41
Compression Ratio The highest possible compression ratio is always the design point, as higher will always be more thermally efficient with better idle quality Knock limits compression ratio because of combustion stability issues at low engine speed due to necessary spark retard Most engines are designed with higher compression than is best for low speed combustion stability because of the associated part-load BSFC benefits and high speed power

42
Valve Events Valve events define how an engine breathes all the time, and so are an important aspect of low load as well as high load performance Valve events also effectively define compression & expansion ratio, as “compression” will not begin until the piston-cylinder mechanism is sealed – same with expansion

43
Valve Event Timing Diagram
Spider Plot - Describes timing points for valve events with respect to Crank Position Cam Centerline - Peak Valve Lift with respect to TDC in Crank Degrees

44
Valve Events for Power Maximize Trapping Efficiency
Intake closing that is best compromise between compression stroke back flow and induction momentum (retard with increasing engine speed) Early intake closing usefulness limited at low engine speed due to knock limit Early intake opening will impart some exhaust blowdown or pressure wave tuning momentum to intake charge Maximize Thermal Efficiency Earliest intake closing to maximize compression ratio for best burn rate (optimum is instantaneous after TDC) Latest exhaust opening to maximize expansion ratio for best use of heat energy and lowest EGT (least thermal protection enrichment beyond LBT)
 Early intake closing usefulness limited at low engine speed due to knock limit. Early intake opening will impart some exhaust blowdown or pressure wave tuning momentum to intake charge. Maximize Thermal Efficiency. Earliest intake closing to maximize compression ratio for best burn rate (optimum is instantaneous after TDC) Latest exhaust opening to maximize expansion ratio for best use of heat energy and lowest EGT (least thermal protection enrichment beyond LBT)")
45
Valve Events for Power Minimize Flow Loss
Achieve maximum valve lift (max flow usually at L/D > ) as long as possible (square lift curves are optimum for poppet valves) Minimize Exhaust Pumping Work Earliest exhaust opening that blows down cylinder pressure to backpressure levels before exhaust stroke (advance with increasing engine speed) Earliest exhaust closing that avoids recompression spike (retard with increasing engine speed)
 as long as possible (square lift curves are optimum for poppet valves) Minimize Exhaust Pumping Work. Earliest exhaust opening that blows down cylinder pressure to backpressure levels before exhaust stroke (advance with increasing engine speed) Earliest exhaust closing that avoids recompression spike (retard with increasing engine speed)")
47
Engine Power and BSFC vs Engine Speed

48
Summary Component’s Relative Impact on Performance
Cylinder Head Ports & Valve Area Valve Events Intake Manifold Runner Geometry Compression Ratio Exhaust Header Geometry Exhaust Restriction Air Cleaner Restriction

49
Powertrain Closing Remarks
Powertrain is compromise Four-stroke engines are volumetric flow rate devices – the only route to more power is increased engine speed, more valve area or increased charge density More speed, charge density or valve area are expensive or difficult to develop – therefore minimizing losses is the most efficient path within existing engine architectures Highest average power during a vehicle acceleration is fastest – peak power values don’t win races

50
Break

51
Calibration What is it? Optimizing the control system (once hardware is finalized) for drivability, durability & emissions It’s just spark and fuel – how hard could it be? Knowledge of Thermodynamics, Combustion and Control Theory all play in Fortunately race engines have no emissions constraints and use race fuel (usually eliminates any knock) – therefore are relatively easy to calibrate
 – therefore are relatively easy to calibrate.")
52
Calibration Terms Stoichiometry – Chemically correct ratio of fuel to air for combustion F/A – Fuel/Air Ratio Mass ratio of mixture, a determination of richness or leanness. Stoichiometry = FA Lambda – Excess Air Ratio Stoichiometry = 1.0 Lambda Rich F/A – F/A greater than Stoichiometry Rich < 1.0 Lambda Lean F/A – F/A less than Stoichiometry Lean > 1.0 Lambda

53
Calibration Terms continued
Brake Power – Power measured by the absorber (brake) at the crankshaft BSFC - Brake Specific Fuel Consumption Fuel Mass Flow Rate / Brake Power grams/kW-h or lbs/hp-h LBT Fuelling – Lean Best Torque Leanest Fuel/Air to Achieve Best Torque LBT = FA or Lambda Thermal Enrichment – Fuel added for cooling due to exhaust component temperature limit Injector Pulse Width - Time Injector is Open
 at the crankshaft. BSFC - Brake Specific Fuel Consumption Fuel Mass Flow Rate / Brake Power grams/kW-h or lbs/hp-h. LBT Fuelling – Lean Best Torque Leanest Fuel/Air to Achieve Best Torque LBT = FA or Lambda. Thermal Enrichment – Fuel added for cooling due to exhaust component temperature limit. Injector Pulse Width - Time Injector is Open.")
54
Calibration Terms continued
Spark Advance – Timing in crank degrees prior to TDC for start of combustion event (ignition) MBT Spark - Maximum Brake Torque Minimum Spark Advance to Achieve Best Torque Burn Rate – Speed of Combustion Expressed as a fraction of total heat released versus crank degrees MAP - Manifold Absolute Pressure Absolute not Gauge (which references barometer)
 MBT Spark - Maximum Brake Torque Minimum Spark Advance to Achieve Best Torque. Burn Rate – Speed of Combustion Expressed as a fraction of total heat released versus crank degrees. MAP - Manifold Absolute Pressure Absolute not Gauge (which references barometer)")
57
Control System Types Alpha-N Speed-Density MAF
Engine Speed & Throttle Angle Speed-Density Engine Speed and MAP/ACT MAF Engine Speed and MAF

58
Alpha-N Fuel and spark maps are based on throttle angle – which is very non-linear and requires complete mapping of engine Good throttle response once dialed in Density compensation (altitude and temperature) is usually absent – needs to be recalibrated every time car goes out
 is usually absent – needs to be recalibrated every time car goes out.")
59
Speed-Density Fuel and spark maps are based on MAP – density of charge is a strong function of pressure, corrected by air temp and coolant temp therefore air flow is simple to calculate Less time-intensive than Alpha-N, once calibrated is good – most common type of control Needs less mapping – can do WOT line and mid-map then curve-fit air flow (spark needs a little more in-depth for optimal control)
")
60
MAF Fuel and spark maps are based on MAF – airflow measured directly
MAF sensor isn’t the most robust device Pressure pulses confuse signal, each application has to be mapped with secondary damped MAF sensor (usually a 55 gallon drum inline) Least noisy signal is usually at air cleaner – so separate transport delay controls need to be calibrated for transients and leaks need to be absolutely eliminated Boosted applications usually add a MAP as well
 Least noisy signal is usually at air cleaner – so separate transport delay controls need to be calibrated for transients and leaks need to be absolutely eliminated. Boosted applications usually add a MAP as well.")
61
Control System Components
Fuel System Injectors, Fuel pump & Regulator Basic Sensors Manifold Absolute Pressure (MAP) or Mass Air Flow (MAF) Crank Position (Rpm & TDC) Cam Position (Sync) Air Charge Temp (ACT) Engine Coolant Temp (ECT) Knock Sensor Lamda Sensor
 or Mass Air Flow (MAF) Crank Position (Rpm & TDC) Cam Position (Sync) Air Charge Temp (ACT) Engine Coolant Temp (ECT) Knock Sensor. Lamda Sensor.")
62
Fuel System Injectors Fuel Pump & Regulator
Volumetric flow rate solenoids, linear relationship between pulsewidth and flow for given pressure delta Battery offset is time necessary to open and close solenoid – time is fixed for any voltage Duty cycle is injector on time – it’ll go static above 95% Bernoulli relationship for different pressure deltas – allowing differing flow rates for a given injector High impedance injectors have lower dynamic range and lower amperage and thus less heat in controller Fuel Pump & Regulator Pressure needs to be sufficiently high to prevent vapour lock (>4bar) and low enough that engine can idle In-tank regulation adds least heat but has line-loss as flow rate increases, ie fuel pressure changes with flow Manifold-referenced regulation can help injectors achieve higher flow rates at elevated boost or lower flows at low vacuum – making calibration more complicated Bernoulli Effect of Fuel Pressure
 and low enough that engine can idle. In-tank regulation adds least heat but has line-loss as flow rate increases, ie fuel pressure changes with flow. Manifold-referenced regulation can help injectors achieve higher flow rates at elevated boost or lower flows at low vacuum – making calibration more complicated. Bernoulli Effect of Fuel Pressure.")
63
Sensors Manifold Absolute Pressure (MAP) Mass Air Flow (MAF)
A variable-resistance diaphragm with perfect vacuum on one side and manifold pressure on other Mass Air Flow (MAF) A heating element followed by a temperature-sensitive element. Heated element is maintained at a constant temperature and based upon the measured downstream temperature the mass flow rate can be determined Crank Position High resolution for spark advance, less-so for crank speed and with once-per-rev can indicate TDC Cam Position Low resolution for syncronization for sequential fuel injection and individual cylinder spark Air Charge Temp and Engine Coolant Temp Thermistors used for air density correction and startup enrichment
 A heating element followed by a temperature-sensitive element. Heated element is maintained at a constant temperature and based upon the measured downstream temperature the mass flow rate can be determined. Crank Position. High resolution for spark advance, less-so for crank speed and with once-per-rev can indicate TDC. Cam Position. Low resolution for syncronization for sequential fuel injection and individual cylinder spark. Air Charge Temp and Engine Coolant Temp. Thermistors used for air density correction and startup enrichment.")
64
Sensors, cont Knock Sensor
A piezoelectric load cell that measures structural vibration. Knock is a pressure wave that travels at local sonic velocity and ‘rings’ at a frequency that is a function of bore diameter (typically between 14-18kHz). When the structure of the engine (typically the block) is hit with this pressure wave it rings as well, but at a frequency that is a function of the structure (ie materials and geometry). A FFT analysis of different mounting positions (nodes not anti-nodes) is necessary to determine the ‘center frequency’ to listen for knock (which is measured via in-cylinder pressure measurements) without picking up other structure-borne noise.
. When the structure of the engine (typically the block) is hit with this pressure wave it rings as well, but at a frequency that is a function of the structure (ie materials and geometry). A FFT analysis of different mounting positions (nodes not anti-nodes) is necessary to determine the ‘center frequency’ to listen for knock (which is measured via in-cylinder pressure measurements) without picking up other structure-borne noise.")
65
Sensors, cont Lamda Sensor (EGO) Wide-band Lamda Sensor (UEGO)
Compares ambient air to exhaust oxygen content (partial pressure of oxygen). Sensor output is essentially binary (only indicates rich or lean of stoichiometry). Wide-band Lamda Sensor (UEGO) Compares partial pressure of oxygen (lean) and partial pressure of HmCn, H2 & CO (rich) with ambient. Gives output from ~0.6 to 2 Lamda. EGO Schematic UEGO Schematic
. Sensor output is essentially binary (only indicates rich or lean of stoichiometry). Wide-band Lamda Sensor (UEGO) Compares partial pressure of oxygen (lean) and partial pressure of HmCn, H2 & CO (rich) with ambient. Gives output from ~0.6 to 2 Lamda. EGO Schematic. UEGO Schematic.")
66
Calibration Goals Combustion & Thermodynamics Transients
Work, Power & Mean Effective Pressures Knock, Pre-Ignition Burn Rate Transients Wall film Thermal Enrichment Drivability

67
Knock Causes of Knock Knock = f(Time,Temperature,Pressure,Octane)
Time – Higher engine speeds or faster burn rates reduce knock tendency. Burn rate can come from multiple spark sources, more compact combustion chambers or increased turbulence Temperature – Reduced combustion temperatures reduce knock through reduced charge temperatures (cooler incoming charge or reduced residual burned gases), increased evaporative cooling from richer F/A mixtures and increased combustion chamber cooling Pressure – Lower cylinder pressures reduce knock tendency through lower compression ratio or MAP pressure Octane – Different fuel types have higher or lower autoignition tendencies. Octane value is directly related to knocking tendency
, increased evaporative cooling from richer F/A mixtures and increased combustion chamber cooling. Pressure – Lower cylinder pressures reduce knock tendency through lower compression ratio or MAP pressure. Octane – Different fuel types have higher or lower autoignition tendencies. Octane value is directly related to knocking tendency.")
68
Knock continued Effects of Knock
Disrupts stagnant gases that form boundary layer at edge of combustion chamber, increasing heat transfer to components and raising mean combustion chamber temp that can lead to pre-ignition Scours oil film off cylinder wall, leading to dry friction and increased wear of piston rings Shockwave can induce vibratory loads into piston pin, piston pin bore and top land - reducing oil film thickness and accelerating wear Shockwave can be strong enough to stress components to failure

69
In-cylinder Pressure Measurement
Piezoelectric pressure transducers develop charge with changes in pressure Installed in combustion chamber wall or spark plug to measure full-cycle pressures

70
Typical pressure probe installation
Passage drilled through deck face (avoiding coolant jacket)
")
71
Cylinder Pressure Trace No Knock

72
Cylinder Pressure Trace Knock Limit or Trace Knock - Best Power

73
Cylinder Pressure Trace Severe Damaging Knock

74
Pre-Ignition Effects of Pre-Ignition
Increases peak cylinder pressure by beginning heat release too soon Increased cylinder pressure also increases heat load to combustion chamber components, sustaining the pre-ignition (leading to ‘run-away pre-ignition’) Increases loads on piston crown and piston pin Sustained pre-ignition will typically put a hole in the center of the piston crown
 Increases loads on piston crown and piston pin. Sustained pre-ignition will typically put a hole in the center of the piston crown.")
75
Burn Rate Burn Rate = f(Spark, Dilution Rate/FA Ratio, Chamber Volume Distribution, Engine Speed/Mixture Motion/Turbulent Intensity) Spark Closer to MBT the faster the burn with trace knock the fastest Dilution Rate/FA Ratio Least dilution (exhaust residual or anything unburnable) fastest FA Ratio best rate around LBT Chamber Volume Distribution Smallest chamber with shortest flame path best (multiple ignition sources shorten flame path) Engine Speed/Mixture Motion/Turbulent Intensity Crank angle time for complete burn nearly constant with increasing engine speed indicating other factors speeding burn rate Mixture motion-contributed angular momentum conserved as cylinder volume decreases during compression stroke, eventually breaking down into vortices around TDC increasing kinetic energy in charge Turbulent Intensity a measure of total kinetic energy available to move flame front faster than laminar flame speed. More Turbulent Intensity equals faster burn.
 fastest. FA Ratio best rate around LBT. Chamber Volume Distribution. Smallest chamber with shortest flame path best (multiple ignition sources shorten flame path) Engine Speed/Mixture Motion/Turbulent Intensity. Crank angle time for complete burn nearly constant with increasing engine speed indicating other factors speeding burn rate. Mixture motion-contributed angular momentum conserved as cylinder volume decreases during compression stroke, eventually breaking down into vortices around TDC increasing kinetic energy in charge. Turbulent Intensity a measure of total kinetic energy available to move flame front faster than laminar flame speed. More Turbulent Intensity equals faster burn.")
76
Combustion & Thermodynamics Summary
Peak Specific Power LBT fuelling for best compromise between available oxygen and charge density MBT spark if possible, fast burn rate assumed at peak load Highest engine speed to allow highest compression ratio Highest octane Peak Thermal Efficiency at desired load Highest compression ratio will have best combustion, usually with highest expansion ratio for best use of thermal energy MBT spark with fastest burn rate 10% lean of stoichiometry will provide best compromise between heat losses and pumping work, but not used because of catalyst performance impacts in pass cars

77
Transient Fuelling Liquid fuel does not burn, only fuel vapour
Heat from somewhere must be used to make vapour – which is why up to 500% more fuel must be used on a cold start to provide sufficient vapour for engine to run (relationship between temperature and partial pressure of fuel fractions) Most of heat during fully warm operation comes from back side of intake valve and port walls Because of geometry a large portion of fuel wets wall – this film travels at some fraction of free stream. Therefore some fuel from every pulse goes into engine and some onto port wall. On a fast acceleration, additional fuel must be added to offset the slowly moving wall film. Opposite true on decels. If injector is positioned far upstream volumetric efficiency increases due fuel heat of vapourization cooling incoming charge, but a large amount of wall is wetted – leading to poor transient fuel control
 Most of heat during fully warm operation comes from back side of intake valve and port walls. Because of geometry a large portion of fuel wets wall – this film travels at some fraction of free stream. Therefore some fuel from every pulse goes into engine and some onto port wall. On a fast acceleration, additional fuel must be added to offset the slowly moving wall film. Opposite true on decels. If injector is positioned far upstream volumetric efficiency increases due fuel heat of vapourization cooling incoming charge, but a large amount of wall is wetted – leading to poor transient fuel control.")
78
Injector Targeting Bad Tip Location Better Tip Location Targets Valve
Targets Port Wall

80
Thermal Enrichment Durability
Combustion temperatures can reach 4000 deg K and drop to 1800 deg K before Exhaust Valve Opening (EVO) Materials must operate at sufficiently low temperature to maintain strength, so Exhaust Gas Temperature (EGT) limits must be adhered to for sufficient durability Usually 950 deg C runner temperature is acceptable for a developed package, as low as 800 deg C for undeveloped components may be necessary Primary path for cooling is additional fuel beyond LBT, as heat of vapourization cools the charge before ignition (pressure-charged engines primarily)
 Materials must operate at sufficiently low temperature to maintain strength, so Exhaust Gas Temperature (EGT) limits must be adhered to for sufficient durability. Usually 950 deg C runner temperature is acceptable for a developed package, as low as 800 deg C for undeveloped components may be necessary. Primary path for cooling is additional fuel beyond LBT, as heat of vapourization cools the charge before ignition (pressure-charged engines primarily)")
81
Drivability Throttle Response
Drivers expect some repeatability and resolution of thrust versus pedal position – some degree of spark mapping (retard) and pedal to throttle cam can help a driver’s confidence Usually least developed and of most importance is tip-in (throttle closed to small opening) where torque can come in as a step change
 and pedal to throttle cam can help a driver’s confidence. Usually least developed and of most importance is tip-in (throttle closed to small opening) where torque can come in as a step change.")
83
Closing Remarks Calibration is compromise
Best spark for drivability may not produce sufficient combustion stability or fuel consumption Best fuelling for drivability is voracious fuel consumer - decel fuel shut off can improve economy by 20% but has tip-in torque bumps without careful calibration

84
References Internal Combustion Engine Fundamentals, John B Heywood, 1988 McGraw-Hill The Design and Tuning of Competition Engines – Sixth Edition, Philip H Smith, 1977 Robert Bentley The Development of Piston Aero Engines, Bill Gunston, 1993 Haynes Publishing Design and Simulation of Four-Stroke Engines, Gordon P. Blair, 1999 SAE Advanced Engine Technology, Heinz Heisler, 1995 SAE Vehicle and Engine Technology, Heinz Heisler, 1999 SAE

85
Q & A

Similar presentations


 Engine Lab Instructor: M>")
 Patel Vidhi A.>")


![1 [Translation: In the name of Allah, the Most Merciful, the Most Kind.]](/14/4499775/big_thumb.jpg "1 [Translation: In the name of Allah, the Most Merciful, the Most Kind.]>")
 IGNITION SYSTEM DISTRIBUTORLESS IGNITION SYSTEM.>")