Download presentation
Presentation is loading. Please wait.

2
Globally averaged annual surface temperature Recent Temperature Trend See also National Climate Data Center (NCDC) Global AnalysisNational Climate Data Center (NCDC) Global Analysis 58F 57F 56F
 Global AnalysisNational Climate Data Center (NCDC) Global Analysis 58F 57F 56F")
3
Fig. 9.9 3rd ed

5
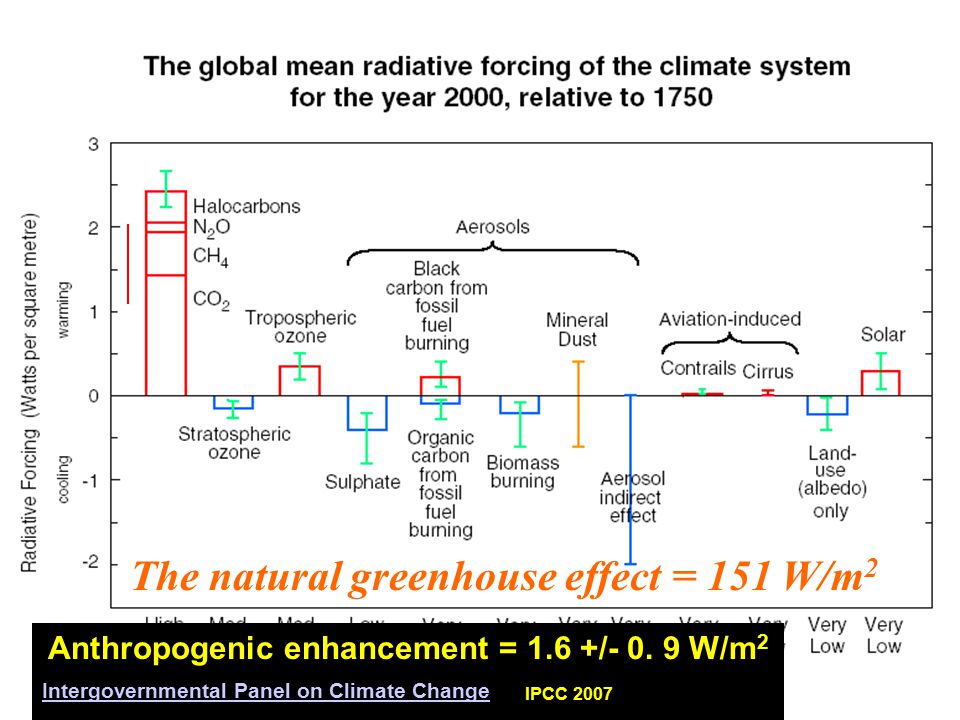
The natural greenhouse effect = 151 W/m 2 Radiative forcings Anthropogenic enhancement = 1.6 +/- 0. 9 W/m 2 IPCC 2007 Intergovernmental Panel on Climate Change

6
Since 1800 up 40% up 150% up 50% Past evidence of CO 2 and Earth’s climate?

7
millions of tons of carbon Emissions that would account for observed atmospheric CO 2 increase In 2007, China surpassed U.S. as leading emitter of CO 2

8
CO2 & Climate Use of fossil fuels as energy source

9
See Fig 14.9

10
Snowball Earth?

12
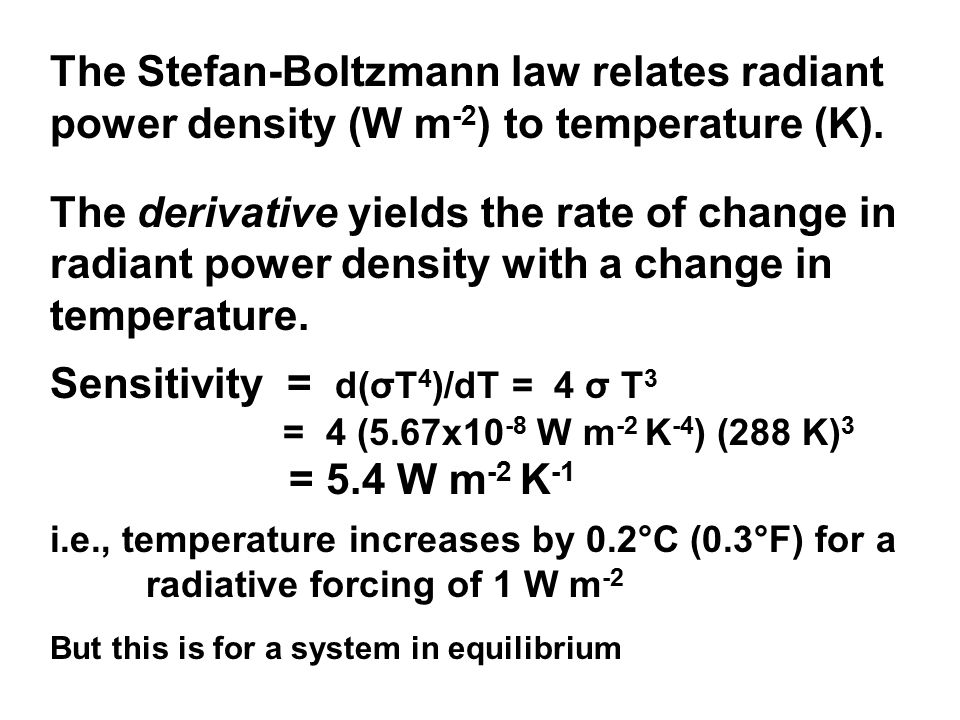
The Stefan-Boltzmann law relates radiant power density (W m -2 ) to temperature (K). The derivative yields the rate of change in radiant power density with a change in temperature. Sensitivity = d(σT 4 )/dT = 4 σ T 3 = 4 (5.67x10 -8 W m -2 K -4 ) (288 K) 3 = 5.4 W m -2 K -1 i.e., temperature increases by 0.2°C (0.3°F) for a radiative forcing of 1 W m -2 But this is for a system in equilibrium
/dT = 4 σ T 3 = 4 (5.67x10 -8 W m -2 K -4 ) (288 K) 3 = 5.4 W m -2 K -1 i.e., temperature increases by 0.2°C (0.3°F) for a radiative forcing of 1 W m -2 But this is for a system in equilibrium.")
13
A.Linear B.Non-linear C.Abrupt shift of “climate states” B The real response (sensitivity) to forcings depends on system inertia and feedbacks
 to forcings depends on system inertia and feedbacks")
14
0 6 3 oFoF 9 predicted warming by 2100 AD (degrees C)
")
15
Climate Change

18
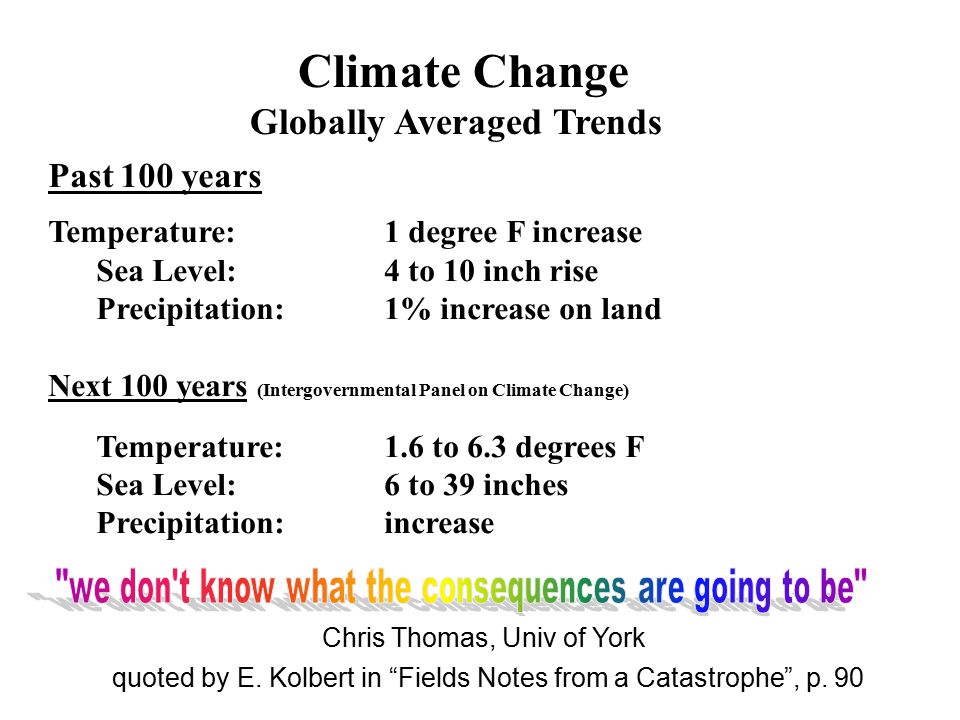
Climate Change Globally Averaged Trends Past 100 years Temperature:1 degree F increase Sea Level:4 to 10 inch rise Precipitation: 1% increase on land Next 100 years (Intergovernmental Panel on Climate Change) Temperature: 1.6 to 6.3 degrees F Sea Level:6 to 39 inches Precipitation:increase Climate change trends Chris Thomas, Univ of York quoted by E. Kolbert in “Fields Notes from a Catastrophe”, p. 90

19
Thus far we focused on “Global” averages Forecasts of Climate Change on Regional and Local Scales are much more uncertain BUT THAT’S WHAT MATTERS Regional scale

20
Observed Temperature Increase from 1880 to 2003 See also Fig 14.3

21
predicted warming by 2100 AD (degrees C) Fig 15.12
 Fig 15.12")
22
Fig. 9.14 3 rd ed Observed trends 1900-2000

23
Predicted by 2100 Changes to clouds (cloudiness, precipitation) is greatest uncertainty WINTER SUMMER
 is greatest uncertainty WINTER SUMMER")
24
Albany Miami Los Angeles

26
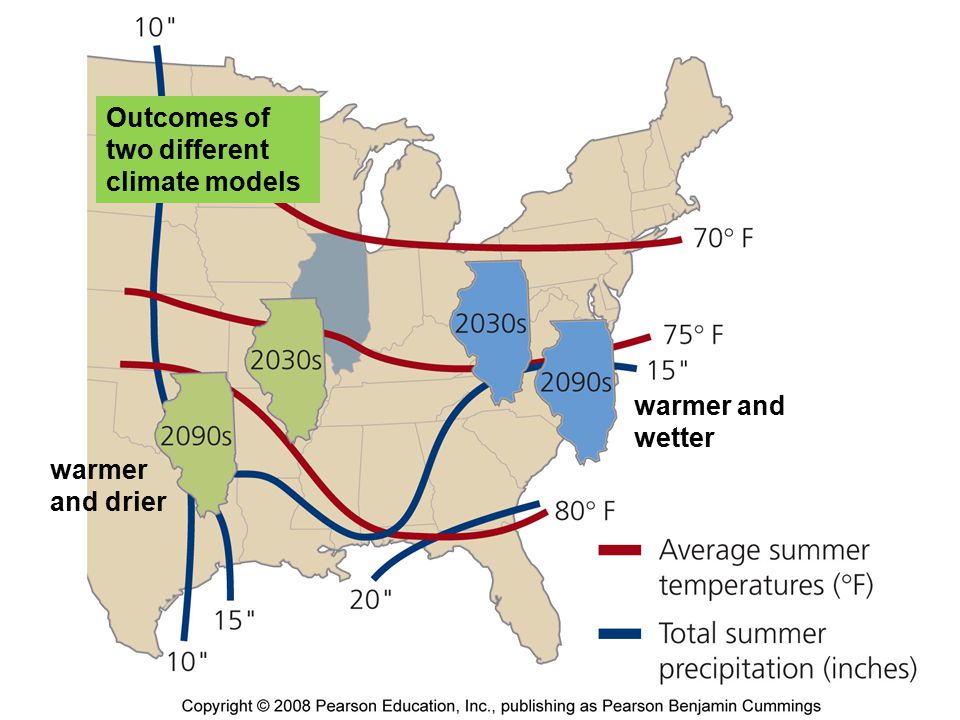
warmer and wetter warmer and drier Outcomes of two different climate models

27
e.g. hydropower dams e.g. wind farms

28
Disruptions of Climate Change Water Resources Water Supply Water Demand Recreation IrrigationHydropower Water Quality Flood ControlNavigation Agriculture Crop choice Crop yields Food distribution Human Health, Safety & Settlement Diseases/Illnesses Displaced Populations Unusual weatherAir Quality Ecosystem Resources ForestsFisheries/Wildlife Disruptions

29
What should/can we do about it?

30
End (or reduce) anthropogenic GHG emissions Response? Response to Global Warming? Adaptation [“Deal” with it] Geo-engineering [“Treat” it] Mitigation [“Cure” it or at least slow it down ] Protect- build sea wall Retreat/abandon - move inland Accommodate - change practices to suit new conditions Cause an anthropogenic cooling to offset warming Augment removal of greenhouse gases (e.g. carbon dioxide) Venice
 Venice.")
32
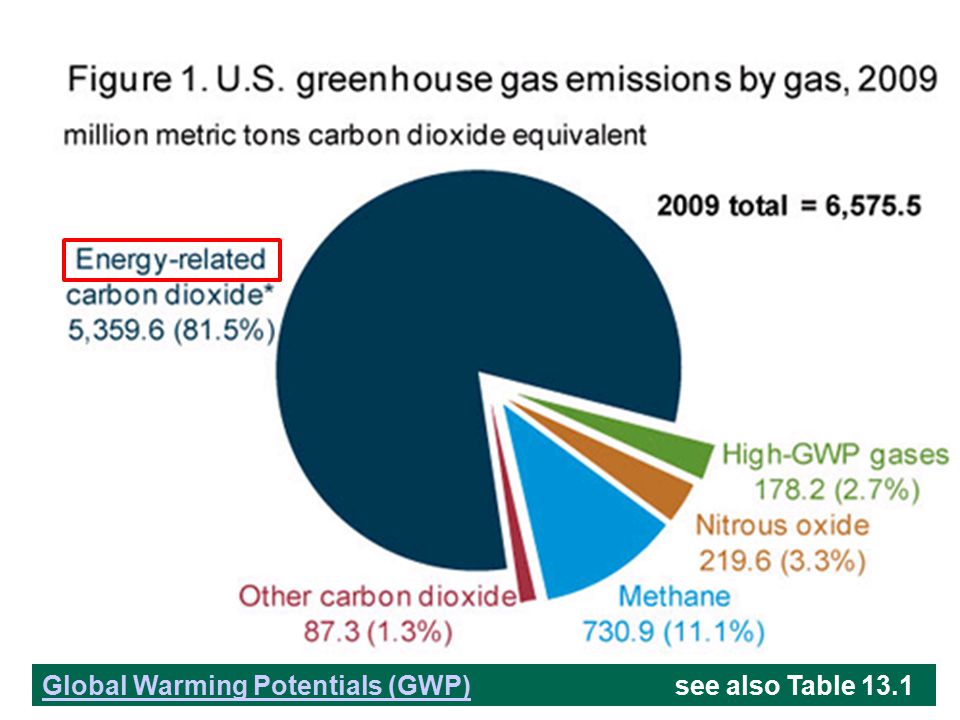
Global Warming Potentials (GWP)Global Warming Potentials (GWP) see also Table 13.1
Global Warming Potentials (GWP) see also Table 13.1")
33
Sources of CO 2 emissions in U.S. (by sector) Fig. 16.5
 Fig. 16.5")
34
1. Don’t Worry The CO 2 Problem?

35
1. Don’t Worry The CO 2 Problem? i) won’t be a problem ii) just adapt to changes, if any iii) use geoengineering if problems develop
 won’t be a problem ii) just adapt to changes, if any iii) use geoengineering if problems develop.")
36
Chemical & Engineering News Nov. 23, 2009

37
2. Increase Uptake (geoengineering) i)afforestation / reforestation ii)ocean biomass stimulation (fertilization) iii)filters The CO 2 Problem?
 i)afforestation / reforestation ii)ocean biomass stimulation (fertilization) iii)filters The CO 2 Problem .")
38
1.Don’t Worry The CO 2 Problem? 3. Reduce Emissions (mitigation) 2. Increase Uptake (geoengineering) (adaptation) (be happy)
 (adaptation) (be happy).")
Similar presentations


 –The hotter they.>")


