Download presentation
Presentation is loading. Please wait.

1
Brazil’s innovation and research strategy models as drivers for development: Achievements, Problems and Challenges The 16th Conference of China Association for Science and Technology Kunming, Yunnan, China May 23, 2014 Helena Nader – President Presented by: Aldo Malavasi - General Secretary Brazilian Society for the Advancement of Science – SBPC

2
Evolution of Brazilian graduate programs and research achievements “Between 1997 and 2007 the number of Brazilian papers in indexed, peer-reviewed journals more than doubled to 19,000 a year. Brazil now ranks 13th in publications, according to Thomson Reuters, having surpassed the Netherlands, Israel, and Switzerland. Brazil's universities awarded twice as many Ph.D.s this year as they did in 2001, and thousands of new academic jobs have opened up on 134 new federal campuses.” (Science, Dec. 3, 2010)
.")
3
Scientific Papers Brazil, Latin America and the World Science 330:1306, 2010

4
Published Papers in ISI indexed Journals 2013 Source: Thomson Reuters. InCites, 2014. RankCountryPapers % of total papers in the world 1USA378.62527,0 2CHINA219.28115,6 3GERMANY102.2717,3 4ENGLAND94.6606,8 5JAPAN78.4475,6 6FRANCE70.7325,0 7CANADA62.8044,5 8ITALY61.9634,4 9SPAIN55.0963,9 10AUSTRALIA53.2963,8 11INDIA51.6603,7 12SOUTH KOREA51.0513,6 13BRAZIL38.5232,7 14NETHERLANDS37.5702,7 15RUSSIA29.0772,1 16TAIWAN27.6992,0 17SWITZERLAND27.3251,9 18TURKEY25.5101,8 19IRAN25.4151,8 20SWEDEN24.4161,7

5
Brazil’s published papers according to the area of knowledge (2009-2013) Source: Thomson Reuters. InCITIES. 2014. Nr.AreasPapersCitationsImpact% world 1Clinical Medicine36.354139.7793,83,1 2Plant & Animal Science21.26945.5042,16,6 3Agricultural Sciences19.84933.8561,711,0 4Chemistry13.69757.8834,21,9 5Physics11.37068.2976,02,1 6Social Sciences, General9.28815.1401,62,4 7Biology & Biochemistry8.22334.7754,22,6 8Engineering7.86223.6913,01,6 9Environment/Ecology5.95124.1204,13,2 10Pharmacology & Toxicology5.51020.2973,73,2 11Neuroscience & Behavior5.34928.8375,42,3 12Materials Science4.91216.9733,51,6 13Molecular Biology & Genetics4.17121.9115,32,1 14Mathematics3.7246.2071,72,0 15Immunology3.52020.1755,73,1 16Microbiology3.34413.9464,23,7 17Geosciences3.26713.4114,11,8 18Psychiatry/Psychology2.4578.4173,41,4 19Computer Science2.1685.2122,41,5 20Space Science1.56311.6377,42,3 21Economics & Business1.2381.5871,31,1 22Multidisciplinary2493.00712,12,0

6
Nr.ÁreaBrazil Latin AmericaWorld Brasil relative to Latin America (%) 1 Agricultural Sciences4.0105.73637.81169,9 2 Clinical Medicine7.56711.049256.69968,5 3 Pharmacology & Toxicology1.1231.81136.53862,0 4 Neuroscience & Behavior1.1952.00850.09759,5 5 Molecular Biology & Genetics1.0161.73042.81458,7 6 Materials Science1.1131.98673.55356,0 7 Plant & Animal Science4.7798.61166.49355,5 8 Psychiatry/Psychology54798838.01855,4 9 Chemistry3.0635.738155.99953,4 10 Computer Science5681.06634.24553,3 11 Multidisciplinary831563.60253,2 12 Microbiology7721.45319.48653,1 13 Social Sciences, General1.7673.33781.51453,0 14 Biology & Biochemistry1.8223.48868.96752,2 15 Physics2.5034.828112.94051,8 16 Immunology8311.61924.37551,3 17 Mathematics8381.73140.57348,4 18 Environment/Ecology1.4613.30643.23444,2 19 Engineering1.8144.175114.45643,4 20 Economics & Business27969424.29640,2 21 Geosciences7361.96542.33637,5 22 Space Science3671.41713.90025,9 Published papers from Brazil, Latin America and the world according to the areas of knowledge (2013) Source: Thomson Reuters. InCITIES. 2014.

7
NºAreas % Brasil in world scientific published papers 20092010201120122013 1 Agricultural Sciences11,010,911,610,810,6 2 Plant & Animal Science6,26,46,56,77,2 3 Microbiology3,63,33,73,94,0 4 Immunology2,73,13,03,23,4 5 Environment/Ecology2,83,13,43,23,4 6 Pharmacology & Toxicology3,53,13,33,23,1 7 Clinical Medicine3,03,13,23,12,9 8 Biology & Biochemistry2,5 2,6 9 Space Science1,92,62,32,22,6 10 Neuroscience & Behavior2,52,32,22,32,4 11 Molecular Biology & Genetics1,92,1 2,22,4 12 Multidisciplinary1,51,32,12,3 13 Physics2,01,92,02,32,2 14 Social Sciences, General2,4 2,52,72,2 15 Mathematics1,82,02,11,92,1 16 Chemistry1,9 1,81,92,0 17 Geosciences1,71,81,91,7 18 Computer Science1,31,41,5 1,7 19 Engineering1,61,5 1,6 20 Materials Science1,71,61,41,61,5 21 Psychiatry/Psychology1,41,51,31,51,4 22 Economics & Business1,1 1,01,1 Fonte: Thomson Reuters. InCITIES. 2014. Percentage of Brazil’s published papers according to the area of knowledge with respect to the world production (2009 to 2013)
.")
8
Achievements Brazilian leadership in S&T&I Aerospace (airplane industry # 4 world) Agriculture (orange, soybeans, sugarcane, tropical fruits and cereals) Animal production (cattle, pig and poultry) Automation: banks (before Internet); elections (results in few hours) Biofuels (ethanol and biodiesel) Cellulose and Paper Industry Insect biological control Oil production in very deep water Tropical diseases and Public Health
 Agriculture (orange, soybeans, sugarcane, tropical fruits and cereals) Animal production (cattle, pig and poultry) Automation: banks (before Internet); elections (results in few hours) Biofuels (ethanol and biodiesel) Cellulose and Paper Industry Insect biological control Oil production in very deep water Tropical diseases and Public Health")
9
Highlights on Brazilian Science Production The basis of Brazilian scientific research is heavily oriented to agriculture, ecology and infectious diseases. Brazil is world leader in papers related to sugar, coffee and orange. The cattle industry produces 33% of the cattle embryos in the world. The research in these areas is growing steadily enough in order to put Brazil in a good position to approach the global concerns with food security, climate change and conservancy.

10
World Ranking of published papers and citations (1996 – 2012 SCImago) RankCountry DocumentsCitable documentsCitationsSelf-Citations Citations/ Document H index 1United States 7.063.3296.672.307129.540.19362.480.42520,451.380 2China 2.680.3952.655.27211.253.1196.127.5076,17385 3United Kingdom 1.918.6501.763.76631.393.2907.513.11218,29851 4Germany 1.782.9201.704.56625.848.7386.852.78516,16740 5Japan 1.776.4731.734.28920.347.3776.073.93412,11635 6France 1.283.3701.229.37617.870.5974.151.73015,60681 7Canada 993.461946.49315.696.1683.050.50418,50658 8Italy 959.688909.70112.719.5722.976.53315,26588 9Spain 759.811715.4528.688.9422.212.00813,89476 10India 750.777716.2324.528.3021.585.2487,99301 11Australia 683.585643.0289.338.0612.016.39416,73514 12Russian Federation 586.646579.8143.132.050938.4715,52325 13South Korea 578.625566.9534.640.3901.067.25210,55333 14Netherlands 547.634519.25810.050.4131.701.50221,25576 15Brazil 461.118446.8923.362.4801.151.28010,09305 16Taiwan 398.720389.4113.259.864790.10310,41267 17Switzerland 395.703377.0167.714.4431.077.44222,69569 18Sweden 375.891361.5696.810.4271.104.67720,11511 19Poland 346.611339.7122.441.439652.9568,25302 20Turkey 306.926291.8141.935.431519.6758,24210 http://www.scimagojr.com/countryrank.php
 RankCountry DocumentsCitable documentsCitationsSelf-Citations Citations/ Document H index 1United States , China , United Kingdom , Germany , Japan , France , Canada , Italy , Spain , India , Australia , Russian Federation , South Korea , Netherlands , Brazil , Taiwan , Switzerland , Sweden , Poland , Turkey ,")
11
World Ranking of published papers and citations (2012 - SCImago) RankCountry Documents Citable documents CitationsSelf-Citations Citations/ Document H index 1Switzerland 395.703377.0167.714.4431.077.44222,69569 2Netherlands 547.634519.25810.050.4131.701.50221,25576 3United States 7.063.3296.672.307129.540.19362.480.42520,451.380 4Sweden 375.891361.5696.810.4271.104.67720,11511 5Canada 993.461946.49315.696.1683.050.50418,50658 6United Kingdom 1.918.6501.763.76631.393.2907.513.11218,29851 7Australia 683.585643.0289.338.0612.016.39416,73514 8Germany 1.782.9201.704.56625.848.7386.852.78516,16740 9France 1.283.3701.229.37617.870.5974.151.73015,60681 10Italy 959.688909.70112.719.5722.976.53315,26588 11Spain 759.811715.4528.688.9422.212.00813,89476 12Japan 1.776.4731.734.28920.347.3776.073.93412,11635 13South Korea 578.625566.9534.640.3901.067.25210,55333 14Taiwan 398.720389.4113.259.864790.10310,41267 15Brazil 461.118446.8923.362.4801.151.28010,09305 16Poland 346.611339.7122.441.439652.9568,25302 17Turkey 306.926291.8141.935.431519.6758,24210 18India 750.777716.2324.528.3021.585.2487,99301 19China 2.680.3952.655.27211.253.1196.127.5076,17385 20Russian Federation 586.646579.8143.132.050938.4715,52325 http://www.scimagojr.com/countryrank.php
 RankCountry Documents Citable documents CitationsSelf-Citations Citations/ Document H index 1Switzerland , Netherlands , United States , Sweden , Canada , United Kingdom , Australia , Germany , France , Italy , Spain , Japan , South Korea , Taiwan , Brazil , Poland , Turkey , India , China , Russian Federation ,")
12
Highlights on Brazilian Science Production

13
RankCountryScorePercentage Rank 1Switzerland66.692.1 2Sweden61.461.7 3United Kingdom61.258.1 4Netherlands61.182.2 5United States of America60.339.7 6Finland59.553.1 7Hong Kong (China)59.423.4 8Singapore59.414.8 9Denmark58.345.3 10Ireland57.960.2 11Canada57.652.4 12Luxembourg56.677.3 13Iceland56.479.4 14Israel56.073.7 15Germany55.872.3 16Norway55.643.2 17New Zealand54.536.8 18Korea, Republic of53.333.3 19Australia53.118.0 20France52.856.0 30Slovenia47.351.0 35China44.790.7 39Costa Rica41.594.3 40Lithuania41.426.2 52Uruguay38.168.7 56Argentina37.786.0 60Colombia37.444.6 63Mexico36.860.9 64Brazil36.351.7 142Yemen19.312.7 Innovation in the World Global Innovations Index Cornell University,INSEAD,and WIPO (2013): The Global Innovation Index 2013: The Local Dynamics of Innovation, Geneva, Ithaca,and Fontainebleau.
 Singapore Denmark Ireland Canada Luxembourg Iceland Israel Germany Norway New Zealand Korea, Republic of Australia France Slovenia China Costa Rica Lithuania Uruguay Argentina Colombia Mexico Brazil Yemen Innovation in the World Global Innovations Index Cornell University,INSEAD,and WIPO (2013): The Global Innovation Index 2013: The Local Dynamics of Innovation, Geneva, Ithaca,and Fontainebleau.")
14
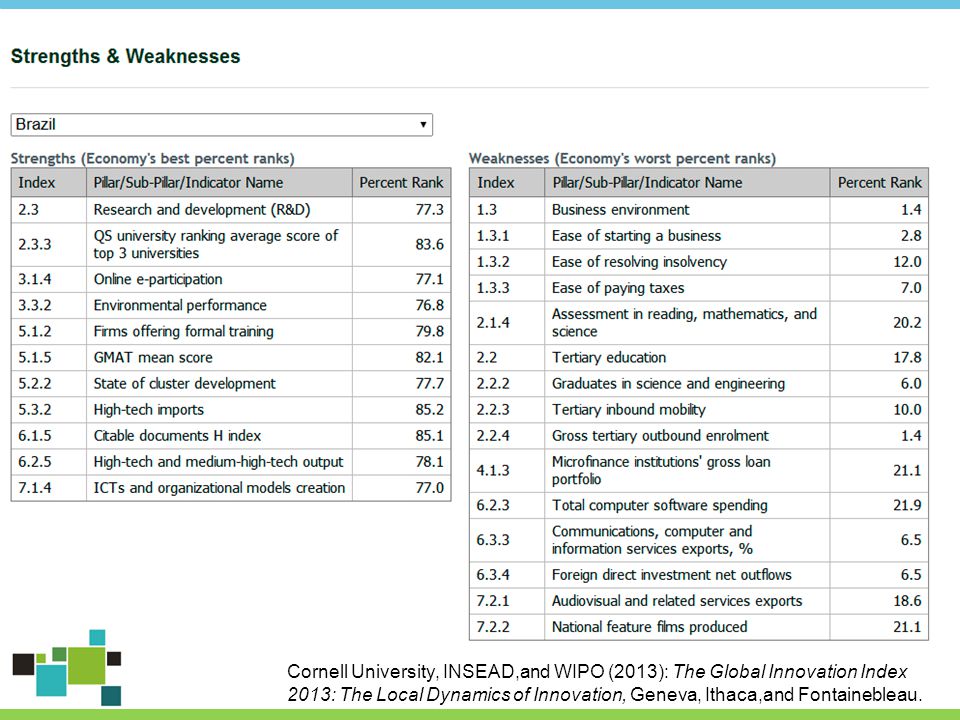
The Framework of Global Innovation Index 2014 Cornell University, INSEAD,and WIPO (2013): The Global Innovation Index 2013: The Local Dynamics of Innovation, Geneva, Ithaca,and Fontainebleau.
: The Global Innovation Index 2013: The Local Dynamics of Innovation, Geneva, Ithaca,and Fontainebleau.")
16
Fonte: UNESCO SCIENCE REPORT 2010 Chalenges: Number of Researchers

17
Natural Sciences and Engineering, per selected region / countries: 2008 or last available data Chalenges: number of scientists or engineers Source: National Science Board, Science and Engineering Indicators 2012

18
The fourth age of research J. Adams, Nature 497: 557-60, 2014

19
Problems to be solved Continuous public budget cuts on the financing sources allocated to Science, Technology and Innovation. Low investments from the private sectors. Backwardness on basic education, particularly in high school level, which directly affects the quality of learning processes at universities, and consequently, scientific productivity. Lack of English proficiency that makes internationalization a difficult task to accomplish.

20
Challenges (1) – Efforts on Education Although great efforts have been undertaken in order to promote great advancements on graduate programs in the past 30 years, there is a large distortion among Brazilian regions To continue the expansion policy of the national graduate educational system. Duplicate in 5 years the number of Physics and Chemistry teachers. Duplicate in 10 years the number of undergraduate courses in engineering, physics, chemistry and in the areas of pharmacology and drugs A strong policy to enhance the quality of engineering and exact sciences

21
Challenges (2) stronger policies Solid policies and investments to enhance technology and innovation, which result in jobs and wealth. Continuous growth of scientific production. Higher number of registered and licensed patents, start-ups, among others related to technology and innovation.

22
Towards a new contract between Science and Society 1.Science is in transition 2.Communication and Education 3.Scientific literacy 4.North-South issues 5.Economy for Sustainable Development 6.Science Policy, Ethics in Science and Scientific Integrity 7.Integrating Issues of Science and Society 8.Office of Government Relations Global Scenario

23
Investments in Science, Technology and Innovation are priority in times of economic crisis 1.The investments in S,T&I are essential for the sustainable development of nations and should be promoted as the best response to economic crisis.

24
Science education contributes to democracy and the political agenda of nations 1.Science education of the population and the popularization of science should be encouraged, enlarging and encouraging scientists to participate in this process; and 2.The use of new information technologies should be made available globally, stimulating initiatives that contribute to "education beyond school."

25
1.It should be encouraged, through international organizations and binational and multinational agreements, the formation of networks of international scientific collaboration within a multidisciplinary perspective to address challenges common to many regions of the planet; 2.Alongside the scientific activity directed to these great challenges, it must be promoted innovation in economics and public administration, social inclusion and the promotion of a culture of peace for reducing violence; and 3.The research frontier, result of human curiosity, should be strengthened and expanded globally, even though it that does not produce obvious applications in the present: the history of science shows that scientific and technological revolutions arise from this type of research. XXI Century encompasses great challenges for science

26
Thank you

Similar presentations


 recognizes the Academy as an International Non-Government Association.>")


 “European R&D Benchmarking (2002)” Science, Technology and Innovation Policy Student Presentations Students: Miguel.>")


