Download presentation
Presentation is loading. Please wait.

1
Nonrenewable Energy Resources
Chapter 17 Chapter 7 [chapter opener image] Copyright © 2014 John Wiley & Sons, Inc. All rights reserved.

2
Which appliances use the most electricity per year?

3
Energy What is the difference between renewable and nonrenewable energy sources? What percent of the world’s energy comes from nonrenewable energy sources? Renewable energy sources?

4
Nonrenewable Energy Nonrenewable energy resources - fossil fuels (coal, oil, natural gas) and nuclear fuels Worldwide energy consumption

5
Energy Consumption: Worldwide vs. United States

6
Energy Consumption in the U.S.

7
Energy Consumption Human society depends on energy
Grow, store, cook food; warm/cool homes; extract/process natural resources, manufacture items; transportation Per capita consumption of energy is much higher in developed than developing countries In U.S.: 31% of total energy is for industry 41% consumed by buildings (homes and offices) 28% transportation In developing countries, industrial energy use is lower, and household use higher © 2014 John Wiley & Sons, Inc. All rights reserved.
 28% transportation. In developing countries, industrial energy use is lower, and household use higher. © 2014 John Wiley & Sons, Inc. All rights reserved.")
8
© 2014 John Wiley & Sons, Inc. All rights reserved.

9
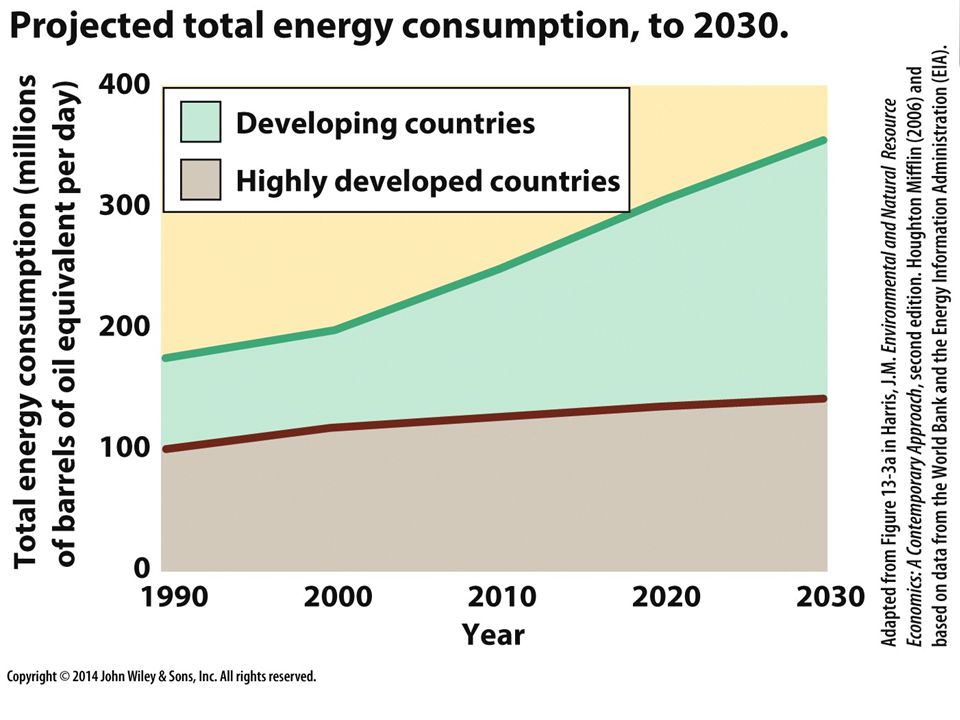
Energy Consumption Human society depends on energy
Global energy consumption increases almost every year (biggest increases in India and China) Developed nations use more but consumption is not increasing/relatively stable World’s energy requirements will increase as populations become larger and more affluent © 2014 John Wiley & Sons, Inc. All rights reserved.
 Developed nations use more but consumption is not increasing/relatively stable. World’s energy requirements will increase as populations become larger and more affluent. © 2014 John Wiley & Sons, Inc. All rights reserved.")
11
Developed Countries

13
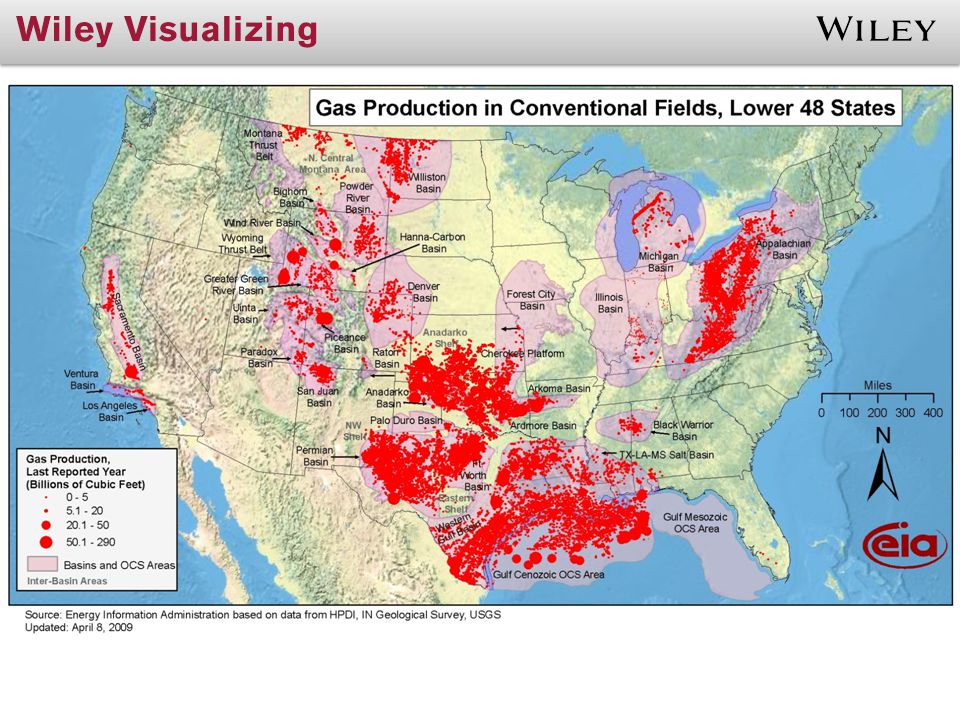
Coal Most abundant fossil fuel Mostly found in Northern Hemisphere
U.S., Russia, China, Australia, India, Germany, South Africa have largest deposits U.S. has 25% of world’s coal deposits At the current rate of production and consumption, the U.S. reserves will last for about 180 more years Used to produce electricity and steel Consumption has surged in recent years Esp. in China and India © 2014 John Wiley & Sons, Inc. All rights reserved.

14
© 2014 John Wiley & Sons, Inc. All rights reserved.

15
Where is most coal produced in the United States?

16
Coal in the World Where in the world is coal found?

17
Source: U.S. Energy Information Administration, International Energy Outlook 2013, July 2013, Tables 6, 9, and 12.

18
World Coal Consumption by Region
?id=4390

19
Coal Formed primarily from the remains of trees, ferns, and other plant materials that were preserved million years ago There are 3 categories of coal: Lignite – least desirable because of its high moisture content Bituminous – most widely used because it is most abundant and easiest to mine Anthracite – has the highest energy content and is cleanest burning, but is hard to obtain

20
Coal

21
Coal Cole (not coal)
")
22
About 90% of U.S. coal mines extract bituminous coal
Coal Reserves in the U.S. About 90% of U.S. coal mines extract bituminous coal lignite anthracite bituminous

23
Coal Characteristics Ash consists of inorganic matter from the Earth’s crust: limestone, iron, aluminum, clay, silica, and trace elements

24
Coal Coal mining Surface mining Subsurface mining (deep underground)
Within 30 meters of the surface First removes soil, subsoil, and overlying rock strata 60% of U.S. coal is obtained this way Usually safer for miners, less expensive Disrupts the land extensively Strip mining—one type of surface mining Vegetation, soil, and rock are ‘stripped away’ Trench is dug to extract coal Rubble dumped into nearby valleys Subsurface mining (deep underground) Approximately 40% of coal mined in the U.S. © 2014 John Wiley & Sons, Inc. All rights reserved.
 Approximately 40% of coal mined in the U.S. © 2014 John Wiley & Sons, Inc. All rights reserved.")
25
Coal © 2014 John Wiley & Sons, Inc. All rights reserved.

26
Surface Mining © 2014 John Wiley & Sons, Inc. All rights reserved.

27
Surface Mining https://www.youtube.com/watch?v=cocg1u0nwbI
© 2014 John Wiley & Sons, Inc. All rights reserved.

28
Coal Environmental impacts of coal mining:
Substantial effects on the environment Topsoil loss (from erosion or removal during mining) prevents restoration of site Landslides occur due to loss of soil-stabilizing vegetation © 2014 John Wiley & Sons, Inc. All rights reserved.
 prevents restoration of site. Landslides occur due to loss of soil-stabilizing vegetation. © 2014 John Wiley & Sons, Inc. All rights reserved.")
29
Coal Environmental impacts of coal mining:
Acid and toxic mineral drainage leaches from minerals exposed in mine waste Acid mine drainage—sulfuric acid and dangerous dissolved materials, such as lead, arsenic, and cadmium, wash from coal and metal mines into nearby lakes and streams Streams become polluted with silt runoff and acid mine drainage © 2014 John Wiley & Sons, Inc. All rights reserved.

30
Coal Environmental impacts of coal mining Mountaintop removal
One of most destructive mining methods Has leveled 15–25% of mountains in southern West Virginia Half the peaks in that area will be gone by 2020 Valleys and streams between mountains are obliterated; filled in with tailings and debris Also in Kentucky, Pennsylvania, Tennessee, Virginia hobet.php Surface Mining Control and Reclamation Act 1977—controlled abandoned surface mines Set standards for mines to follow during operation and reclamation © 2014 John Wiley & Sons, Inc. All rights reserved.

31
Electricity Generation

33
Fuels Used for Electricity Generation in the U.S.

34
Coal Environmental impacts of coal burning
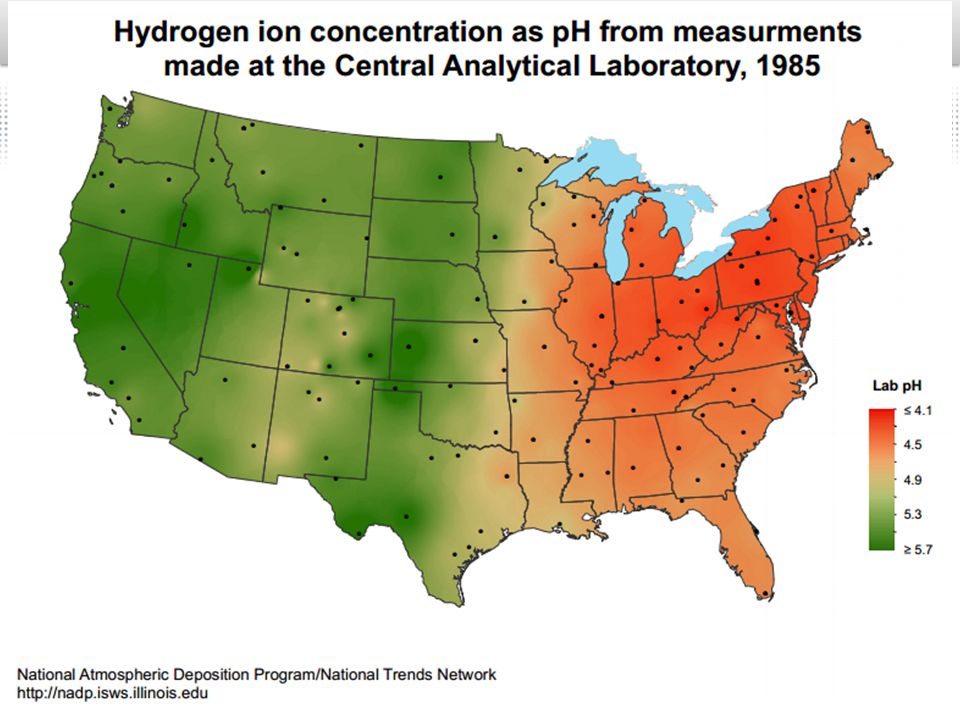
Contributes more air pollutants than oil or natural gas Coal-burning electric power plants produce 1/3 of all airborne mercury emissions When coal is burned it produces sulfur and nitrogen oxides, which react with water in the atmosphere and produce acid deposition Releases more CO2 into the atmosphere (per unit of heat produced) than other fossil fuels © 2014 John Wiley & Sons, Inc. All rights reserved.
 than other fossil fuels. © 2014 John Wiley & Sons, Inc. All rights reserved.")
35
Coal and the Environment
When burned, coal emits: Sulfur dioxide Nitrogen oxide Heavy metals (such as mercury and arsenic) Carbon dioxide (the greenhouse gas most responsible for global warming) © 2014 John Wiley & Sons, Inc. All rights reserved.
 Carbon dioxide (the greenhouse gas most responsible for global warming) © 2014 John Wiley & Sons, Inc. All rights reserved.")
36
Coal and the Environment
In many parts of the world, coal is burned using old technology Causes air, water, ground contamination Even though technology can remove particulates, sulfur, and mercury, we can’t fix the release of CO2 Large scale use of coal can be devastating Fly ash slurry spill destroyed houses and roads, and contaminated rivers which feed the Tennessee, Ohio, and Mississippi rivers © 2014 John Wiley & Sons, Inc. All rights reserved.

37
Coal Making coal cleaner
Scrubbers and other technologies can be used to remove sulfur and particulates from emissions In scrubbers, chemicals react with exhaust from burning coal and precipitate out the polluting emissions Fluidized-bed combustion Crushed coal is mixed with limestone to neutralize acidic compounds Produces fewer nitrogen oxides and removes sulfur Produces more heat per unit, so reduces CO2 emissions Clean Air Act of 1990 Provides incentives for utility companies to convert to clean coal technologies Fluidized-bed, CO2 capture © 2014 John Wiley & Sons, Inc. All rights reserved.

38
Results of the Clean Air Act
In 1990 alone, pollution reductions under the Clean Air Act prevented 205,000 early deaths Reductions in fine particle pollution between in U.S. cities led to improvements in average life expectancy at birth of approximately 7 months Reducing air pollution also improves crop and timber yields, a benefit worth an estimated $5.5 billion to those industries in 2010

39
Percent Change in U.S. Air Quality
Pollutant 1980 vs. 2013 Carbon Monoxide -84% Ozone -33% Lead -92% Nitrogen Dioxide -58% PM10 -34% Sulfur Dioxide -81%

42
Catalytic Converter SV0tY

43
Wet Scrubber

44
Fluidized Bed Combustion Chamber

45
Baghouse Filter

46
Advantages and Disadvantages of Coal
Energy-dense Contains impurities Plentiful Release impurities into air when burned Easy to exploit by surface mining Trace metals like mercury, lead, and arsenic are found in coal Technological demands are small Combustion leads to increased levels of sulfur dioxide and other air pollutants into the atmosphere. Economic costs are low Ash is left behind Easy to handle and transport Carbon is released into the atmosphere which contributes to climate change Needs little refining

47
Oil and Natural Gas Provide 56% of world’s energy
In U.S., supplies approximately 62% energy Coal 21% Nuclear power 9% Renewables 7% (hydropower, wind, solar) Liquid biofuels 1% © 2014 John Wiley & Sons, Inc. All rights reserved.
 Liquid biofuels 1% © 2014 John Wiley & Sons, Inc. All rights reserved.")
48
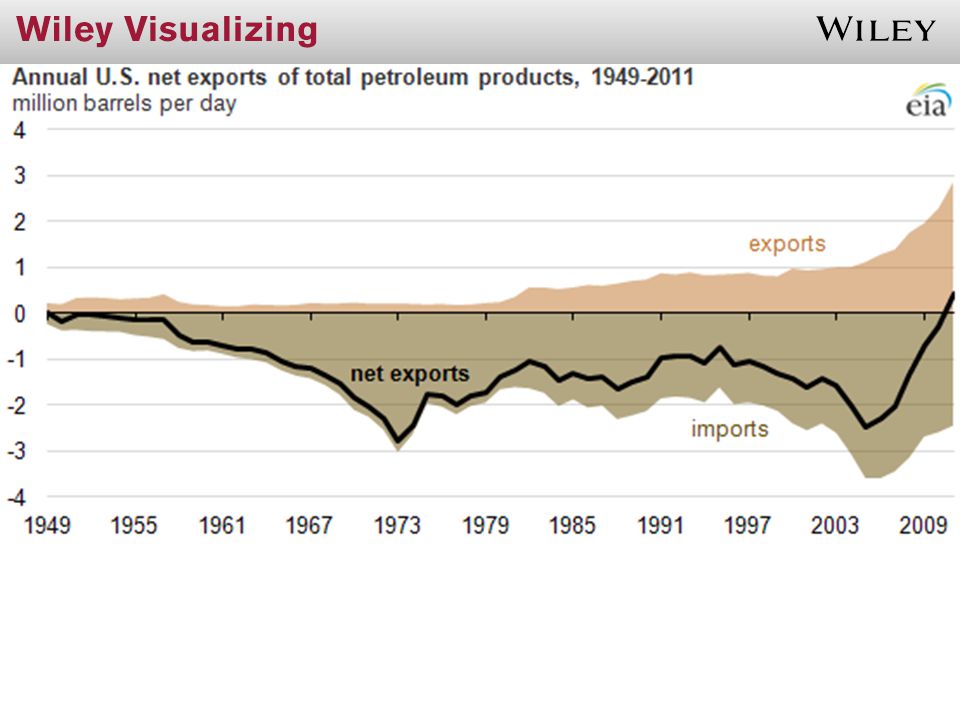
Oil and Natural Gas Petroleum, or crude oil
Liquid composed of hundreds of hydrocarbon compounds Refining separates crude oil into different products based on boiling points Gases, jet fuel, heating oil, diesel, asphalt Petrochemicals Oil is used to produce fertilizers, plastics, paints, pesticides, medicines, synthetic fibers © 2014 John Wiley & Sons, Inc. All rights reserved.

49
Petroleum

50
Oil in the U.S. When was the first U.S. commercial oil well drilled?
1859 Where was it drilled? Titusville, PA

51
What are the top oil producing states in the U.S.?

52
Petroleum Products What products can be made from petroleum?

53
Oil Refining http://www.howstuffworks.com/oil- refining2.htm
Xy9MKo&list=PLi_1unC2AWvDyoaErq3ql9l- 0x_zY9hc-

54
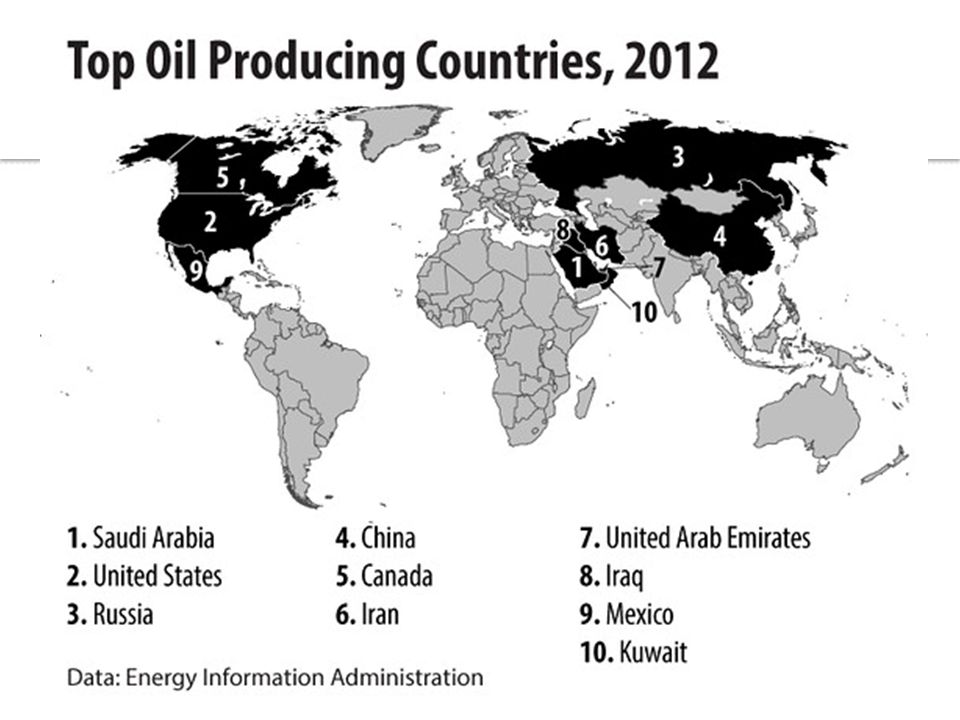
Which countries produce the most oil?

56
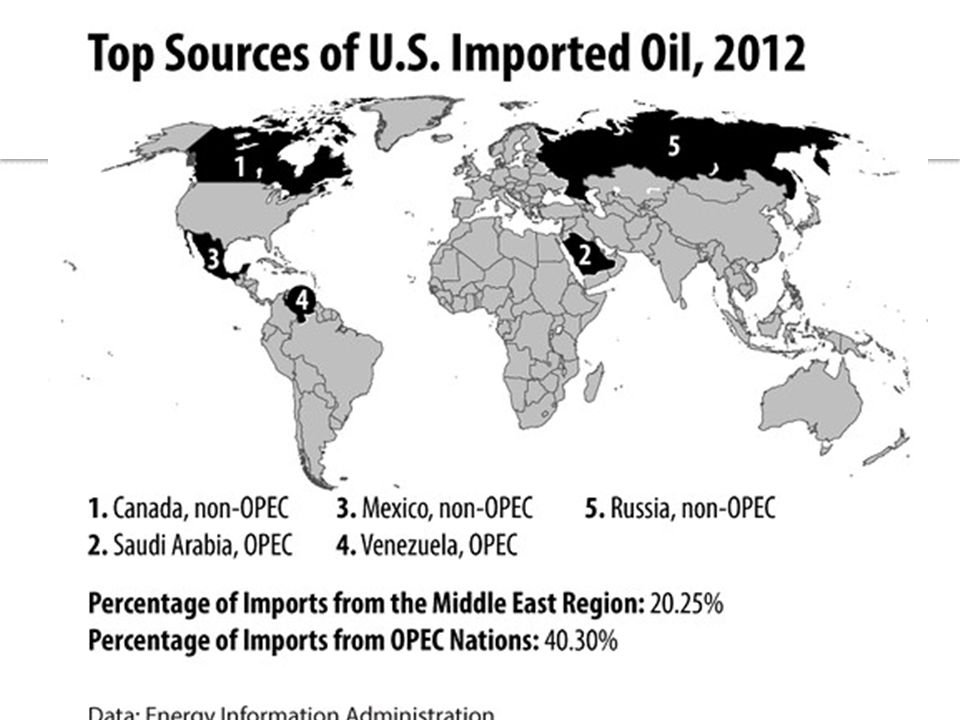
Which country does the U.S. import the most oil from?

58
© 2014 John Wiley & Sons, Inc. All rights reserved.

62
Which countries are in OPEC?

63
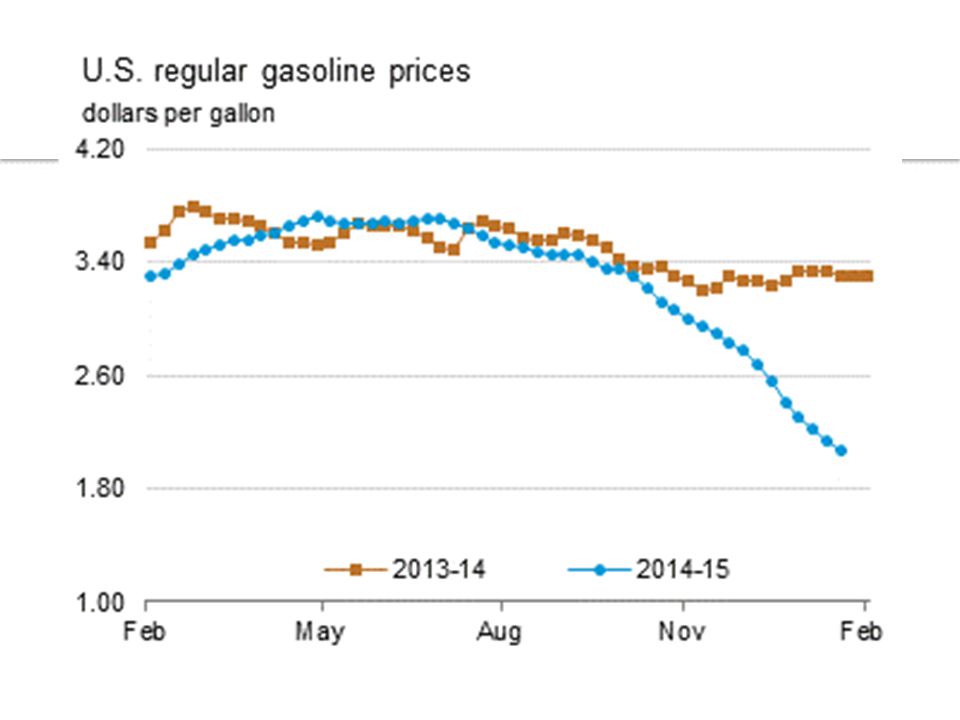
Price of Oil per Barrel (U.S.)
")
69
What we pay for in a gallon of gasoline
Source: Energy Information Agency

70
Oil and Natural Gas Natural gas Only a few hydrocarbons
Methane is used primarily for heating residential and commercial buildings, and generating electricity Ethane Propane Butane Liquefied petroleum gas Propane and butane are separated and stored in pressurized tanks as a liquid © 2014 John Wiley & Sons, Inc. All rights reserved.

71
Oil and Natural Gases Main disadvantage
Deposits are located far from where gas is needed Costs four times more to transport through pipelines than crude oil Must be compressed to form LNG and carried in specially refrigerated ships Then, must be returned to the gaseous state at regasification plants Only four plants in the U.S. At least 40 needed according to energy companies © 2014 John Wiley & Sons, Inc. All rights reserved.

72
Natural Gas Uses Electricity generation Transportation
Cogeneration Natural gas is used to produce electricity and steam; steam is used for heating water and spaces Transportation Fuels for cars, trucks, buses Environmental advantages over gasoline/diesel 33% less CO2; 80–93% fewer hydrocarbons; 70% less CO; 90% fewer toxic emissions, almost no soot In 2011, U.S. had 150,000 vehicles running on natural gas; 10 million globally Commercial cooling Residential and commercial air cooling Desiccant-based air cooling (air-drying system) Plastics and fertilizer production © 2014 John Wiley & Sons, Inc. All rights reserved.
 Plastics and fertilizer production. © 2014 John Wiley & Sons, Inc. All rights reserved.")
73
NATURAL GAS?

74
Where in the world is Natural Gas?

75
Where in the world is Natural Gas?
Source: Energy Information Agency

77
385 million years ago

79
Fracking http://www.youtube.com/watch?v=LAxsTJd7V CA
In PA: qt0

82
Advantages and Disadvantages of Natural Gas
Contains fewer impurities and therefore emits almost no sulfur dioxide or particulates When unburned, methane escapes into the atmosphere Emits only 60% as much carbon dioxide as coal Exploration of natural gas has the potential of contaminating groundwater

83
Reserves of Oil and Natural Gases
On every continent, but uneven distribution More than half of oil reserves in Persian Gulf Venezuela, Mexico, Russia, Kazakhstan, Libya, U.S. About half of natural gas reserves are in Russia and Iran Large oil deposits under continental shelves and adjacent deep-water areas Hydraulic fracturing (fracking) techniques have changed estimates of natural gas resources Environmental impacts of fracking different than other extraction methods Expensive, environmentally disruptive © 2014 John Wiley & Sons, Inc. All rights reserved.
 techniques have changed estimates of natural gas resources. Environmental impacts of fracking different than other extraction methods. Expensive, environmentally disruptive. © 2014 John Wiley & Sons, Inc. All rights reserved.")
84
Oil and Natural Gases How long will supplies last? Cannot predict
Technological breakthroughs, new reserves discovered, world consumption rates Most optimistic predictions Global oil production will peak around 2035 Natural gas is more plentiful, production will continue to rise for perhaps 10 more years after that © 2014 John Wiley & Sons, Inc. All rights reserved.

85
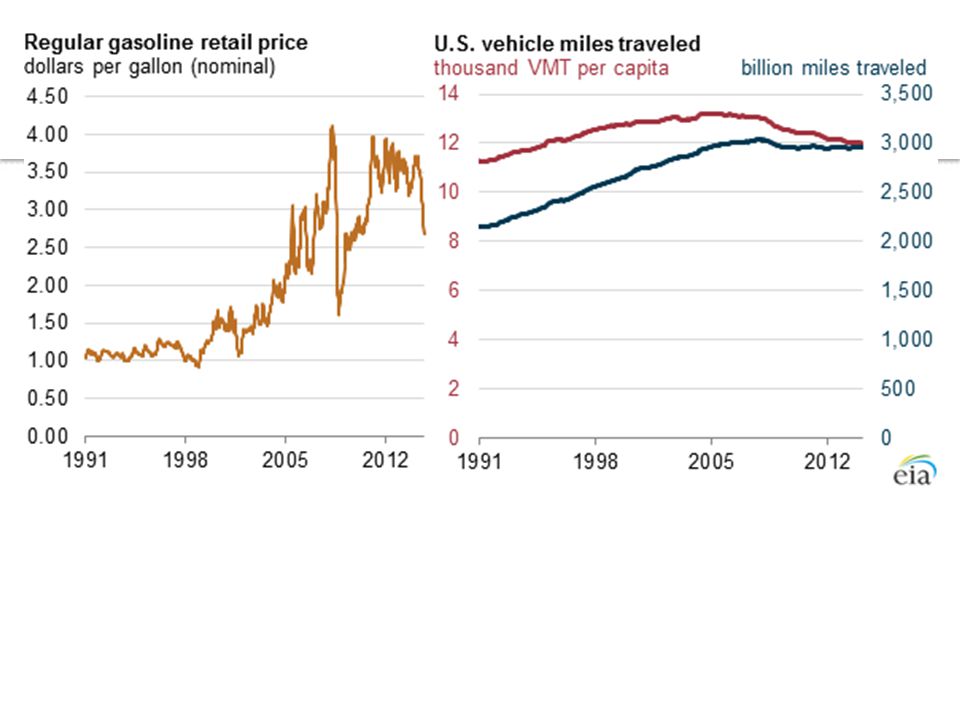
Environmental Impacts of Oil and Natural Gas
CO2 production contributes to global warming Each gallon of gas burned releases 9kg of CO2 to atmosphere Acid deposition Photochemical smog Nitrogen oxides (almost no sulfur oxides) Natural gas Relatively clean No sulfur Releases far less CO2 and hydrocarbons Almost no particulates compared to oil and coal Risks associated with transport Leaks and spills © 2014 John Wiley & Sons, Inc. All rights reserved.
 Natural gas. Relatively clean. No sulfur. Releases far less CO2 and hydrocarbons. Almost no particulates compared to oil and coal. Risks associated with transport. Leaks and spills. © 2014 John Wiley & Sons, Inc. All rights reserved.")
86
Major Oil Spills in the U.S.
Deepwater Horizon drilling platform explosion—2010 11 workers died 4 million barrels of crude oil spilled from the damaged well at the ocean floor in the Gulf of Mexico Fisheries disrupted, wildlife killed, extensive ecological damage occurred © 2014 John Wiley & Sons, Inc. All rights reserved.

87
Major Oil Spills in the U.S.
Exxon Valdez supertanker—1989 260,000 barrels/10.9 million gallons of crude oil Prince William Sound, along coast of Alaska 300,000 birds and 3500–5500 sea otters died Orca and harbor seal populations declined Salmon migration was disrupted Fishing season was halted After ‘completing’ the cleanup, shores were still contaminated and continued damage to birds, fishes, and mammals © 2014 John Wiley & Sons, Inc. All rights reserved.

88
Major Oil Spills in the U.S.
Oil Pollution Act of 1990 Liability for damages to natural resources resulting from oil spills, including a trust fund to pay for damages when responsible party cannot Requires double hulls on tankers entering U.S. waters by 2015 © 2014 John Wiley & Sons, Inc. All rights reserved.

89
Earth’s Largest Oil Spill
Persian Gulf War—1991 6 million barrels deliberately dumped into Persian Gulf Oil wells set on fire Lakes of oil spilled into the desert around wells May take a century or more for area to recover © 2014 John Wiley & Sons, Inc. All rights reserved.

90
Advantages and Disadvantages of Petroleum
Convenient to transport and use Releases carbon dioxide into atmosphere Relatively energy-dense Possibility of leaks when extracted and transported Cleaner-burning than coal Releases sulfur, mercury, lead, and arsenic into the atmosphere when burned

91
Nuclear Energy Atoms are composed of
Protons (+) Neutrons (0) Electrons (–) Protons and neutrons are in the nucleus, and electrons orbit the nucleus With fossil fuels, combustion releases energy from changes in the chemical bonds between atoms Nuclear energy comes from changes within the nuclei of atoms © 2014 John Wiley & Sons, Inc. All rights reserved.
 Neutrons (0) Electrons (–) Protons and neutrons are in the nucleus, and electrons orbit the nucleus. With fossil fuels, combustion releases energy from changes in the chemical bonds between atoms. Nuclear energy comes from changes within the nuclei of atoms. © 2014 John Wiley & Sons, Inc. All rights reserved.")
92
Nuclear Energy Two different types of nuclear reactions Fission Fusion
Splitting of nucleus into two smaller fragments, accompanied by the release of large amounts of energy E.g., a neutron crashes into a nucleus of uranium Used in nuclear power plants Fusion Two small atoms are combined to form a large atom of a different element E.g., process that powers the sun and other stars © 2014 John Wiley & Sons, Inc. All rights reserved.

93
Nuclear Energy Fission process in U-235 atoms
© 2014 John Wiley & Sons, Inc. All rights reserved.

94
Nuclear Fission

95
Nuclear Energy Conventional nuclear fission
Uranium ore is used in power plants Nonrenewable resource, 11% located in U.S. Three isotopes: U-238, U-235, U-234 Enrichment—the process of refining uranium ore to increase the concentration of U-235 to 3% so it’s usable in nuclear reactors Requires a lot of energy Processed into small pellets (each pellet contains the energy equivalent of 1 ton of coal) Pellets then placed into closed pipes called fuel rods Fuel rods are placed into groups of 200 to create fuel assemblies A reactor contains 150–250 fuel assemblies © 2014 John Wiley & Sons, Inc. All rights reserved.
 Pellets then placed into closed pipes called fuel rods. Fuel rods are placed into groups of 200 to create fuel assemblies. A reactor contains 150–250 fuel assemblies. © 2014 John Wiley & Sons, Inc. All rights reserved.")
96
Nuclear Energy Fission of U-235 releases an enormous amount of heat, which is used to convert water into steam Steam then drives a turbine, generating electricity Nuclear power plants use controlled nuclear reactions Bombs are uncontrolled nuclear reactions Nuclear reactors do not contain enough bomb-grade U-235 to cause a bomblike nuclear explosion © 2014 John Wiley & Sons, Inc. All rights reserved.

97
Nuclear Energy Nuclear reactor parts Reactor core—fission occurs here
Steam generator—heat from core is used here Turbine—uses steam to generate electricity Condenser—cools steam © 2014 John Wiley & Sons, Inc. All rights reserved.

98
Nuclear Energy and Fossil Fuels
Nuclear power production steadily increasing Concerns for climate change Increasing demand for energy In 2012, 435 nuclear power plants in 30 countries operating; 66 more under construction in 14 countries Supporters claim we need more nuclear energy Affects the environment less than fossil fuels Less pollution, no CO2 Decreases demand on foreign oil Nuclear energy generates radioactive waste Spent fuel, coolant fluids and gases Special measures for safe storage and disposal © 2014 John Wiley & Sons, Inc. All rights reserved.

99
Nuclear Energy in the World
Nuclear power plants generate about 20% of the United States’ electricity In comparison: 30% in Japan 30% in Germany 39% in South Korea 43% in Ukraine 46% in Sweden 75% in France

101
Which state is the most dependent on nuclear energy?

102
Source: Ventyx Velocity Suite / Energy Information Administration

103
Nuclear Power Plants in the U.S.

104
Nuclear Energy © 2014 John Wiley & Sons, Inc. All rights reserved.

105
Nuclear Energy Safety and accidents in nuclear power plants
Nuclear power plants cannot explode like bombs Meltdown—metal encasing uranium fuel can melt Water can boil off and release radioactivity Nuclear industry considers major accidents low probability risks, but public’s perception of risk is much higher Involuntary and potentially catastrophic People are distrustful of nuclear industry Consequences of accidents are drastic and long-lasting Worldwide, three major nuclear accidents have occurred since 1970 © 2014 John Wiley & Sons, Inc. All rights reserved.

106
Nuclear Energy Three Mile Island, USA
Most serious commercial reactor accident in U.S. 1979, Pennsylvania Partial meltdown of reactor core Most radioactive material was kept in containment building, did not escape No substantial environmental or human damage New regulations were put in place More frequent inspections Risk assessments Improved emergency and evacuation plans © 2014 John Wiley & Sons, Inc. All rights reserved.

107
Nuclear Energy Chernobyl, Ukraine
Severe accident at Chernobyl nuclear power plant in 1986 1-2 explosions ripped apart reactor and released large amounts of radioactive material into environment Radioactivity quickly spread to surrounding area and other parts of Europe Ultimately more than 170,000 people abandoned their homes Farmlands and forest contaminated in many areas of Ukraine, people cannot drink or eat local water, milk, meat, fish, fruits, or vegetables Mothers can’t nurse their babies—their milk is contaminated by radioactivity Increases in birth defects, leukemia, thyroid cancer, abnormal immune systems © 2014 John Wiley & Sons, Inc. All rights reserved.

108
Nuclear Energy Fukushima Daiichi, Japan
Tsunami following an underwater 9.0 earthquake in March 2011, disrupted normal and backup reactor cooling systems Three of six reactors had meltdowns Overheating led to hydrogen gas buildup and explosion in one reactor Contamination from accident extensive to both ocean and local land areas Neighboring areas permanently evacuated High radiation levels will limit seafood catches locally for decades © 2014 John Wiley & Sons, Inc. All rights reserved.

109
Nuclear Energy Link between nuclear energy and nuclear weapons
Fission is the process involved in both Countries with nuclear power plants have access to material for nuclear weapons Spent fuel is reprocessed into plutonium Leaders worried about terrorist groups and some nations (Iran, North Korea) © 2014 John Wiley & Sons, Inc. All rights reserved.
 © 2014 John Wiley & Sons, Inc. All rights reserved.")
110
Nuclear Energy Link between nuclear energy and nuclear weapons
Several hundred metric tons of plutonium available worldwide Security nightmare Just a few kilograms are necessary for bombs of the magnitude used to destroy Nagasaki and Hiroshima in WWII Security in U.S. at nuclear power plants and plutonium stockpiles increased substantially since 2001 © 2014 John Wiley & Sons, Inc. All rights reserved.

111
Radioactive Wastes Low-level High-level
Give off small amounts of radioactive energy Glassware, tools, paper, clothing, etc. Produced by power plants, nuclear medical facilities, university research labs Stored in four sites in the U.S. High-level Give off large amounts of radiation Produced during nuclear fission in reactors Fuel rods and assemblies, coolants, air and gases from reactor, reprocessing of spent fuel Among the most dangerous human-made hazardous wastes Difficult to store; toxic and produce considerable amounts of heat Secure storage must be guaranteed for thousands of years © 2014 John Wiley & Sons, Inc. All rights reserved.

112
Radioactive Wastes Recommended storage
Stable rock formations deep in the ground People object to having it stored under their homes/cities Currently no long-term centralized storage in U.S. Commercial nuclear power plants store spent fuel on-site, but none are designed for long-term storage No countries have successfully selected or developed long-term storage facilities for high- level nuclear waste as of 2012 © 2014 John Wiley & Sons, Inc. All rights reserved.

113
Nuclear Waste Management
The biggest obstacle to increased nuclear power in U.S. It will be decades before deep underground storage facilities are developed Nuclear Waste Policy Act—1982 Federal government has the burden of developing permanent sites for storage of radioactive waste Congress identified Yucca Mountain, NV as the only candidate for a storage facility In 2009 Obama administration withdrew support for this site—no new site has been identified Billions of dollars were spent on feasibility studies Transportation concerns were a major factor in canceling project Deep-underground storage is safest and best long-term option © 2014 John Wiley & Sons, Inc. All rights reserved.

114
EnviroDiscovery A nuclear waste nightmare
Over past three decades Soviet (now Russian) practices have violated international standards Billions of gallons of radioactive waste pumped directly underground Wastes dumped into the ocean, more than double of the waste of 12 nuclear nations combined Potential health and environmental hazards unknown © 2014 John Wiley & Sons, Inc. All rights reserved.
 practices have violated international standards. Billions of gallons of radioactive waste pumped directly underground. Wastes dumped into the ocean, more than double of the waste of 12 nuclear nations combined. Potential health and environmental hazards unknown. © 2014 John Wiley & Sons, Inc. All rights reserved.")
115
Decommissioning Nuclear Power Plants
Nuclear power plants do not last forever Critical components become brittle or corroded and eventually the plants must be shut down and decommissioned International Atomic Energy Agency Three options for decommissioning Storage Utility company guards facility for 50–100 years while radioactive materials decay, making it safer to dismantle later Entombment Permanently encase plant in concrete Tomb would have to remain viable for years—not viable option Immediate dismantling Robotics make it feasible to dismantle ‘hot’ sections of plant © 2014 John Wiley & Sons, Inc. All rights reserved.

116
Advantages and Disadvantages of Nuclear Energy
No air pollution is produced Possibility of accidents Countries can limit their need for imported oil Disposal of the radioactive waste

117
What do you think? Should we build more nuclear power plants in the United States?

120
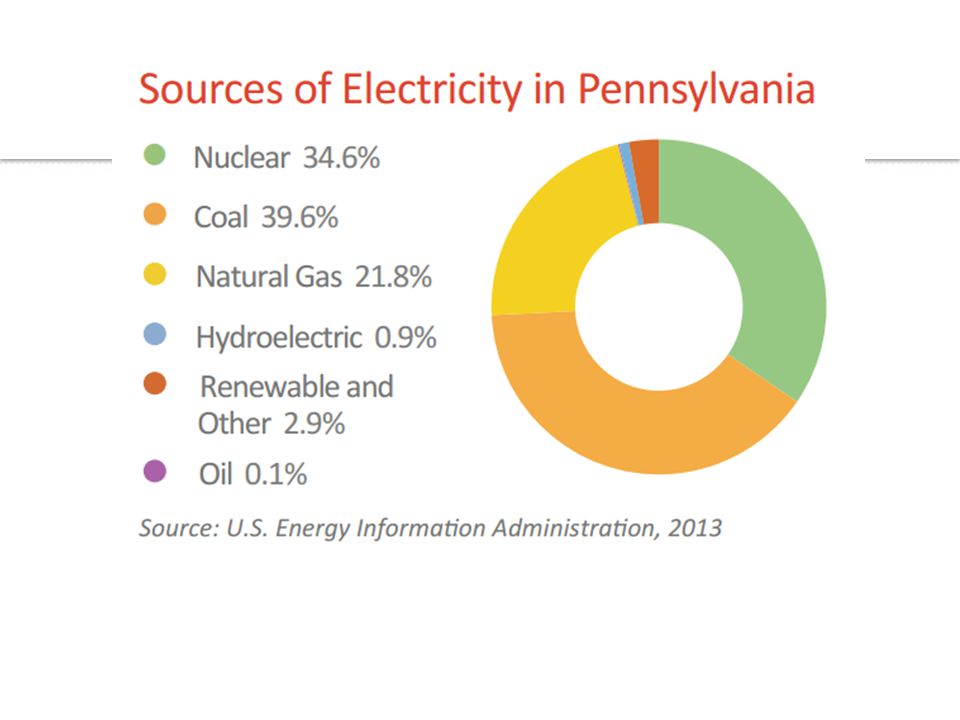
Benefits of Nuclear Energy in PA

121
Case Study The Arctic National Wildlife Refuge (ANWR)— 1980
“America’s Serengeti” Biologically rich-home to many species Fragile ecosystem Environment vs. economy conflict Proposed opening of area to oil exploration Supporters—economic considerations are main reason for drilling; make U.S. less dependent on foreign oil Detractors—money spent on exploration would be better spent on developing alternative, renewable fuel sources, and energy conservation Permanent threats to balance of nature in Alaskan wilderness © 2014 John Wiley & Sons, Inc. All rights reserved.

122
Case Study © 2014 John Wiley & Sons, Inc. All rights reserved.

Similar presentations


 and nuclear fuels. Nonrenewable Energy.>")


