Download presentation
Presentation is loading. Please wait.

1
Super Seeing from the AAT Peter Gillingham 26 th March 2003

2
1991 Herstmonceux Conference: “ Super Seeing from the AAT ? ” (Australian Antarctic Territory) We believed Antarctic plateau would offer extremely good seeing but likely upset by thermal mixing in boundary layer, something like 100 m deep. High temperature gradient in air near snow -> bad thermal inhomogeneity in even light wind. Likely better on plateau “domes” than at S Pole. DIMM and SODAR at S Pole confirmed this. SODAR showed boundary layer up to ~ 300m deep while, above that, scintillation and balloon thermometry indicated ~ 0.2 arcsec. Dome C SODAR Feb-June 2003 and DIMM summer 2003/4 indicate this site much better than South Pole and almost certainly better than Mauna Kea or any other mid-latitude site.
 We believed Antarctic plateau would offer extremely good seeing but likely upset by thermal mixing in boundary layer, something like 100 m deep. High temperature gradient in air near snow -> bad thermal inhomogeneity in even light wind. Likely better on plateau domes than at S Pole. DIMM and SODAR at S Pole confirmed this. SODAR showed boundary layer up to ~ 300m deep while, above that, scintillation and balloon thermometry indicated ~ 0.2 arcsec. Dome C SODAR Feb-June 2003 and DIMM summer 2003/4 indicate this site much better than South Pole and almost certainly better than Mauna Kea or any other mid-latitude site..")
3
~3% 0.4 arcsec PARANAL ~ 3% better than 0.4 arcsec (up to 1995) from DIMM measurements
 from DIMM measurements")
4
Seeing distribution from DIMM at the WHT site, Canary Islands. ~ 10% 0.4 arcsec

5
midnight

6
DIMM data during daytime, Dome C 21/22 Nov 2003 – Sun’s elevation ~ 17 to 5 to 25 deg. FWHM (arcsec) v local time. (with no correction for Zenith Distance) 18:0021:0000:00 03:0006:00 1.0 0.6 0.8 21 st Nov22 nd Nov 0.2 0.0 0.4
 v local time. (with no correction for Zenith Distance) 18:0021:0000:00 03:0006: st Nov22 nd Nov")
7
DIMM data during daytime, Dome C 21/22 Nov 2003 18:0021:0000:00 03:0006:00 1.0 0.6 0.8 21 st Nov22 nd Nov 0.2 0.0 0.4 < 0.4 arcsec, experienced ~ 3% of time at Paranal

8
DIMM data during daytime, Dome C 21/22 Nov 2003 18:0021:0000:00 03:0006:00 1.0 0.6 0.8 21 st Nov22 nd Nov 0.2 0.0 0.4 < 0.3 arcsec, experienced ~ 0.3% of time at Paranal

10
Best DIMM data so far from Dome C ( in daylight )
")
11
DIMM measures during daytime at Dome C 28 th Nov 2003 29 th Nov 2003 FWHM arcsec (not corrected for Zenith angle) v local time. 00:0006:0012:0000:0018:00 00:0006:0012:0000:0018:00

12
Temperature and wind speed data from Automated Weather Station at Dome C2. Nov. 2003. ( 3 metre above snow ~ 70 km from Dome C ) Periods in which DIMM measures were recorded
 Periods in which DIMM measures were recorded.")
13
18:0021:0000:00 03:0006:00 1.0 0.6 0.8 0.2 0.0 0.4 Comparison of DIMM measures from Dome C with simultaneous AWS measures from Dome C2 21/22 Nov 2003

14
2.0 0.0 00:0006:0012:0000:0018:0006:0012:0000:0018:00 1.0 0.8 0.0 0.4 1.2 1.6 Dome C DIMM seeing, arcsec FWHM, Nov 28 and 29 Temperature and wind speed from Dome C2 AWS

15
Temperature and wind speed record from AWS, Dome C2, Feb 1996

16
Temperature and wind speed record from AWS, Dome C2, July 1996

17
CT 2 data from SAODAR, for 7 th Feb., 2003, at 30 min intervals. Note build-up of returns when Sun was high. For 24 out of 41 sets of data, no significant returns at any height from 30 to 900 metres.

18
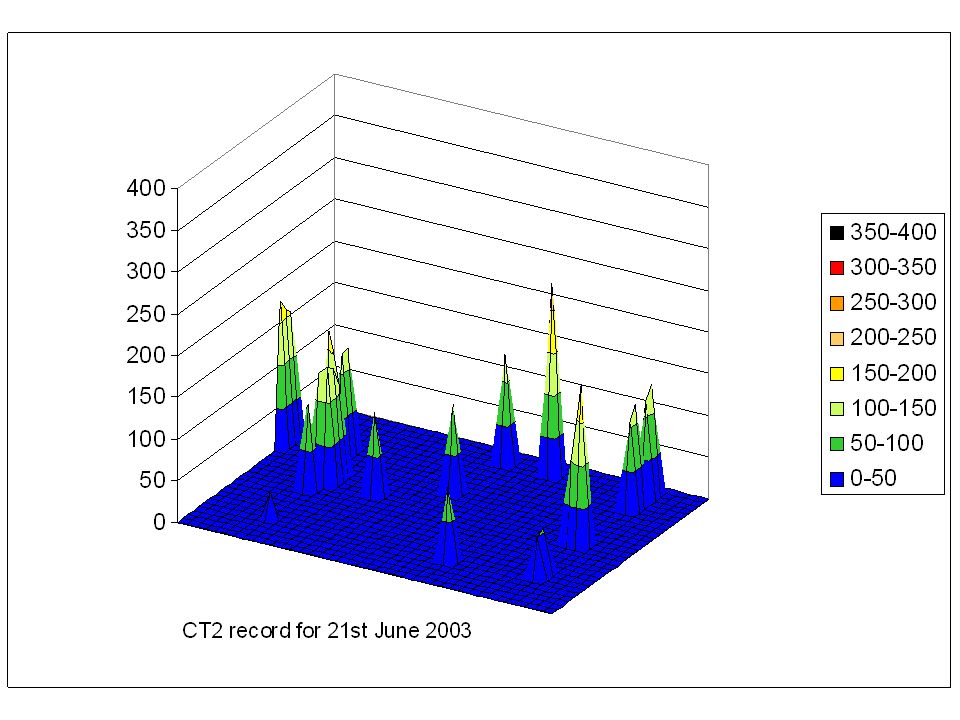
CT 2 data from SODAR for 21 st June 2003. For 30 out of 41 sets of data, no significant returns at any height.

21
Number of SODAR data sets each day, out of 41 at 30 min intervals, which gave no significant return at any height

22
Mean SODAR measures as a function of height, month by month at Dome C in 2003

23
Comparison of wind speed from Dome C2 AWS with that at 30 m height from SODAR at Dome C. Wind speed (m/s) from AWS at Dome C2, height ~ 3 m Wind speed (m/s) from SODAR at Dome C, height 30 m
 from AWS at Dome C2, height ~ 3 m Wind speed (m/s) from SODAR at Dome C, height 30 m.")
24
AWS data from Dome Fuji ~ 77 deg S 3810 m Jun 2003 Sep 2003 Aug 2003 Jul 2003

25
Super Seeing from the Antarctic Plateau? Is it now time to remove “?” ? YES !

Similar presentations


 and Andrei Tokovinine.>")


>")

>")


 and some unpublished results Hirofumi OKITA Astronomical Institute, Tohoku University.>")
