Download presentation
Presentation is loading. Please wait.

2
Demographics

3
Quick Facts about SPS 309 Employees 2160 Students Nearly 200,000 Intra-District miles traveled annually. 11 Languages represented in the district English, Spanish, Cherokee, Laos, Romanian, Hmong Indian Guajarati, Inuping, Hindi, Ukrainian, Russian 398,355 meals served last year. 70% Free and Reduced lunch Rate Household of 4 must earn less than $29,055 to qualify

4
5 Major Funds General Fund Building Fund Child Nutrition Fund Bond/Sinking Fund Activity Funds

5
General Fund Foundation and Salary Incentive Aid FY 10 $8,022,718.00 FY 11 $7,829,289.00 FY 12 $7,724,527.00

6
Funding Sources General Fund

7
Title IATitle IIA Title IA Neglected Title IIITitle IDTitle VIIITitle VIIJOMCarl D. PerkinsIDEA Federal Program Funding Sources FY 11 Federal Stabilization GSF FundsProject 782Title I A ARRA Title IANeg. ARRA Title IID Prof. Dev. Title IID Educ. Tech Title IVTitle I D ARRAIDEA ARRA

8
Title IATitle IIA Title IA Neglected Title IIITitle IDTitle VIIITitle VIIJOMCarl D. PerkinsIDEA Federal Program Funding Sources FY 12

9
Local Funding Streams and our Building Fund District I-001 has a valuation of $47,873,402 Building fund accrues 5 mills annually for Building Fund revenue Total Building Fund receipts from local Ad-Valorem: $239,367.01

10
Liberty Elementary 1966

11
Eastside Elementary 1975

12
Tommie Spear Middle School 1962

13
Sallisaw High School 1987

14
Where do the Funds Go?

15
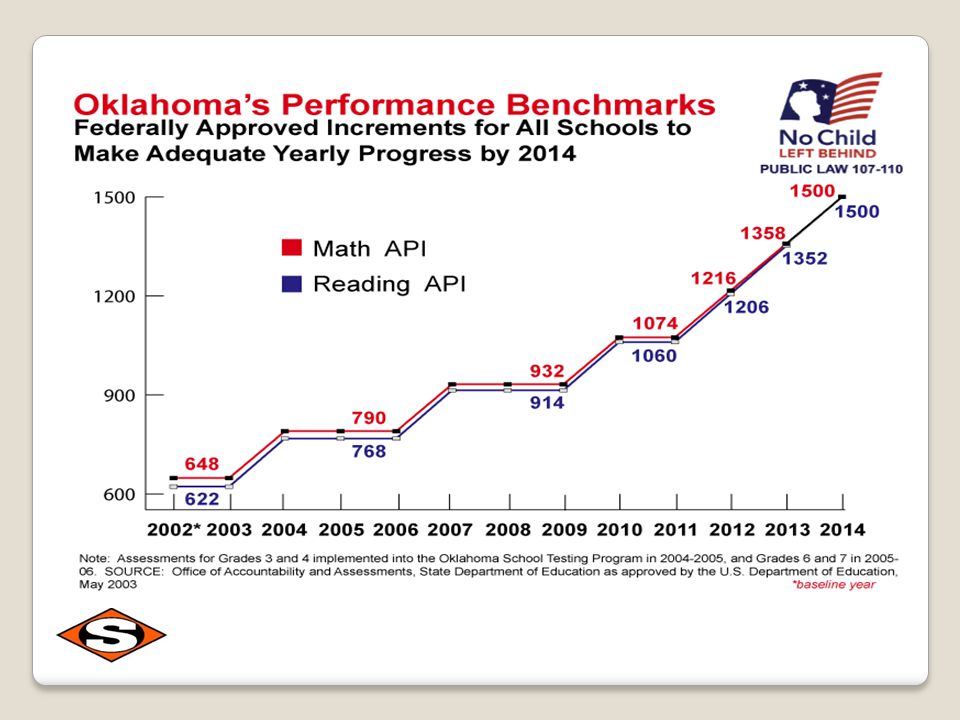
. What’s new at the Federal Level? Reauthorization of NCLB~ESEA

17
SALLISAW SCHOOLS (K-12) 1298 1346 1345 1184 1203 EASTSIDE 1365 1406 1418 1214 1242 LIBERTY 1262 1362 1391 1031 1174 TOMMIE SPEAR 1329 1383 1365 1244 1268 SALLISAW HS 1186 1267 1302 1114 1029 API Scores 2007 2008 2009 2010 2011
 EASTSIDE LIBERTY TOMMIE SPEAR SALLISAW HS API Scores")
18
School Grade Span OSTP School Academic Completion Excellence K-12 District K-12 80% 10% 10% High School 9-12 80% 10% 10% TSMS 6-8 90% 10% N/A Eastside 3-5 90% 10% N/A Liberty K-3 90% 10% N/A How is the Academic Performance Index (API) Calculated?
 Calculated")
19
Sallisaw Public Schools API comparison to State Avg. 2007200820092010 Sallisaw1298134613451184 State1252127912891092 Points Above State Avg. 46675692

20
Composite-------- 20.8 State Avg. (20.7) English------------- 21.3 Math -- --------------- 19.1 Reading ----------- 21.6 Science ------------ 20.5. Sallisaw ACT Scores
 English Math Reading Science Sallisaw ACT Scores.")
22
. What’s new at the State Level? SB 346 HJR 1002 HB 1456 Common Core State Standards

23
. P artnership for A ssessment of R eadiness for C ollege and C areers 48 of 50 States are Participating in CCSS 24 States are members of PARCC

24
. What’s new locally? o Increased Instructional time o Enhanced focus on literacy o New technology o Scholarship assistance, PFL Class o Website

25
.

Similar presentations


 January 2001 Re-authorization of the Elementary and Secondary Education Act (ESEA)>")
 Total Enrollment (EP 1-5): 1081 = 13% Total Enrollment.>")


 Academic Performance Index (API) SAIT Training September 27, 2007.>")