Download presentation
Presentation is loading. Please wait.

1
VVC Facilities Report June 2012 Strategic Planning For Student Success

2
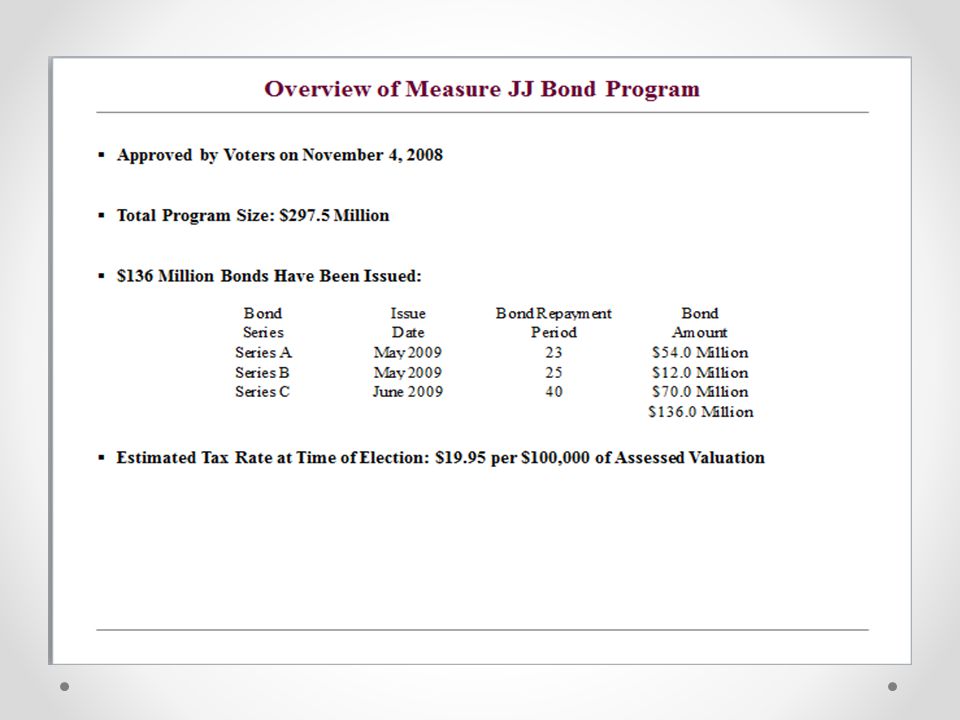
Bond Measure JJ

3
Victor Valley College Facilities Master Plan 2012 Status Report Findings From a Strategic Master Planning Process Incorporating: Facilities Master Plan Educational Master Plan Full Text Ballot Bond Measure JJ /Prop 39 2012 Room Use Analysis 2012 Five Year Plan 2012 Space Inventory Facilities Condition Index 2012 Praise Reports Facilities Committee Finance/Budget & Planning Committee Executive Cabinet College Council

4
Facility Capacities o Facility Shortfall Conclusions: 1. Laboratories (by a large margin): 70,542 ASF The challenge is to determine which disciplines have the greatest need for new and/or refurbished space. 2. Classrooms: 3,378 ASF The challenge is to determine where they would be best located to serve as many disciplines as possible. Victor Valley College Facilities Master Plan, 2012 Status Report
: 70,542 ASF The challenge is to determine which disciplines have the greatest need for new and/or refurbished space. 2. Classrooms: 3,378 ASF The challenge is to determine where they would be best located to serve as many disciplines as possible. Victor Valley College Facilities Master Plan, 2012 Status Report.")
5
Relative Need for Space by Instructional Discipline 2012 Laboratory Room Use 2012 data No Allocation Shown for Growth Victor Valley College Facilities Master Plan, 2011 Status Report Utilization Rate Shortfall (ASF) Automotive376% 19,303 Science / Health268% 9,962 Welding160% 1,725 Music127% 2,019
 Automotive376% 19,303 Science / Health268% 9,962 Welding160% 1,725 Music127% 2,019")
6
VVC Board Approved Projects June 14 th, 2011 Music Modernization New Science / Health Building Vocational Complex Expansion / Renovation One Stop Counseling/ Administration Modernization

12
Future Bond Outlook

17
Energy Saving Projects

18
Main Campus Solar SolFocus CPV System Performance 2011/12 MonthkWh GeneratedIncentive x $0.26+Avoided Cost=Total Savings July 262,985 $ 68,376 $ 38,659 $ 107,035 August 293,818 $ 76,393 $ 43,191 $ 119,584 September 219,285 $ 57,014 $ 32,235 $ 89,249 October 226,639 $ 58,926 $ 33,316 $ 92,242 November 152,707 $ 39,704 $ 22,448 $ 62,152 December 163,758 $ 42,577 $ 24,072 $ 66,649 January 180,566 $ 46,947 $ 26,543 $ 73,490 February 181,720 $ 47,247 $ 26,713 $ 73,960 March 212,278 $ 55,192 $ 31,205 $ 86,397 April 236,585 $ 61,512 $ 34,778 $ 96,290 May 291,740 $ 75,852 $ 42,886 $ 118,738 June 285,020 $ 74,105 $ 41,898 $ 116,003 Actual kWh 2,707,101 $ 703,846 $ 397,943 $ 1,101,789 Guaranteed 2,421,900 Estimated 2010/11 MonthkWh GeneratedIncentive x $0.26+Avoided Cost=Total Savings Actual kWh 2,539,764 $ 711,134 $ 322,552 $ 1,033,686 Guaranteed 2,421,900

20
R.P.S.T.C. Solar R.P.S.T.C. Solar System Performance 2011/12 MonthkWh GeneratedIncentive x $0.19+Avoided Cost=Total Savings March 40,550 $ 7,705 $ 6,051 $ 13,755 April 45,193 $ 8,587 $ 6,743 $ 15,330 May 55,729 $ 10,589 $ 8,315 $ 18,904 June 49,993 $ 9,499 $ 7,440 $ 16,939 Actual kWh 191,465 $ 36,378 $ 28,550 $ 64,928 Guaranteed 2,421,900 Estimated

21
R.P.S.T.C. Solar

22
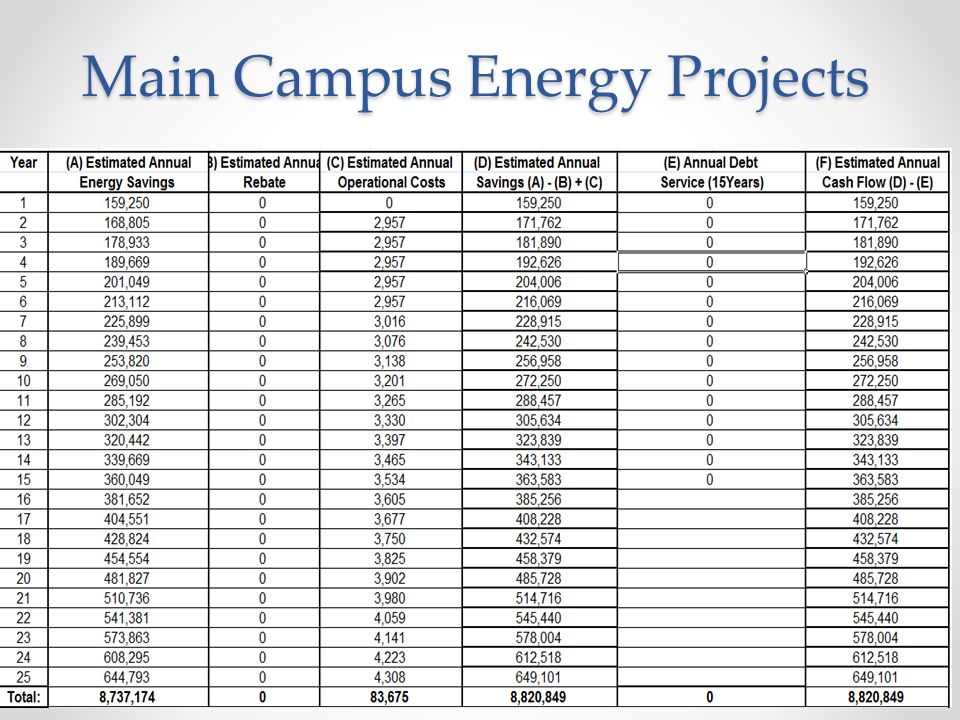
Main Campus Energy Projects

24
Utility Incentives

25
The Data Supports Construction of Lab space to better serve Instructional needs Board decision to construct Lab projects for Music, Science/ Health, and Vocational programs Shortage of Bond funding to support all projects and their secondary affects Sale of the remaining Bonds are still in question Cost of Construction will go back up VVC, at the direction of the Board, has been very successful in revenue generating energy projects relieving some strain on the general fund

26
The entire VVC team will continue to bring green, cost effective energy projects for the Boards consideration

28
Parking Lots 10 & 11

29
Child Care Parking Lot #12

30
Parking Lot #16

31
Benefits of Solar Covered Parking Structures Provides Solar Covered parking for students in Child Care, Lot #10 and #16 Under canopy lighting Produces approximately 350kW A/C power to offset the majority of power on 3 meters which equates to lower utility expenses Estimated 682,500 in annual kWh savings Years 1 to 5 Positive Cash Flow to Gen Fund Through Energy Cost Savings $ 770,000 Estimated SCE CSI rebates $ 474,340 Total Net Positive Cash Flow in Years 1 to 5: $ 1,244,340 Over 25-Year Life Cycle Total Net Positive Cash Flow : $ 7,939,586 VVC Investment $ 3,106,217

32
Cash Flow

40
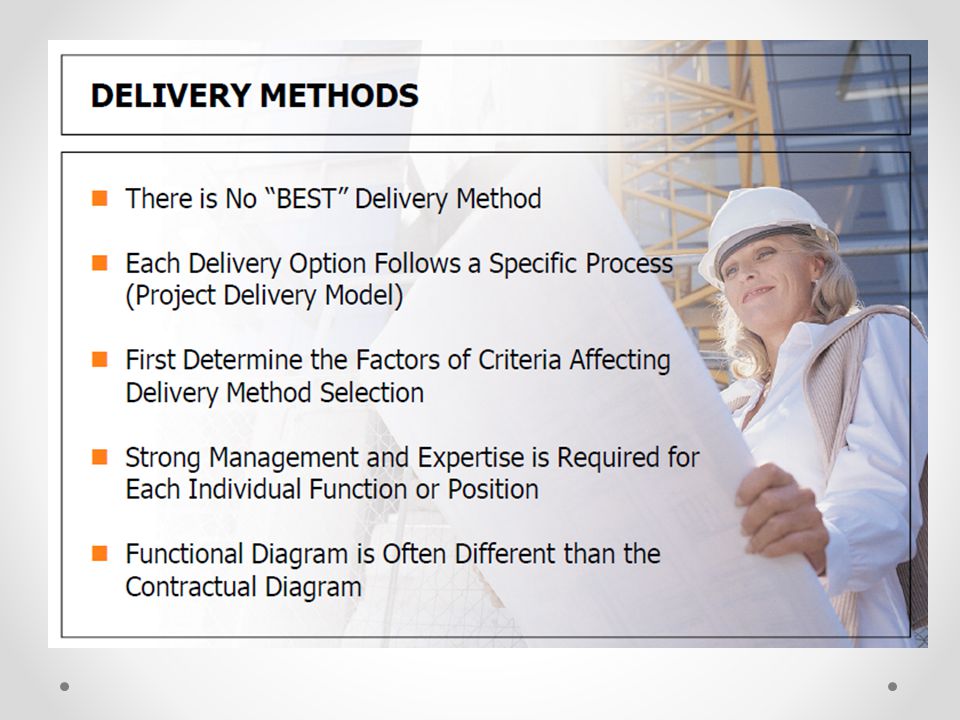
Traditional Design / Bid / Build

44
Construction Management Multi - Prime

48
Design / Build

Similar presentations


 The.>")


>")


