Download presentation
Presentation is loading. Please wait.

1
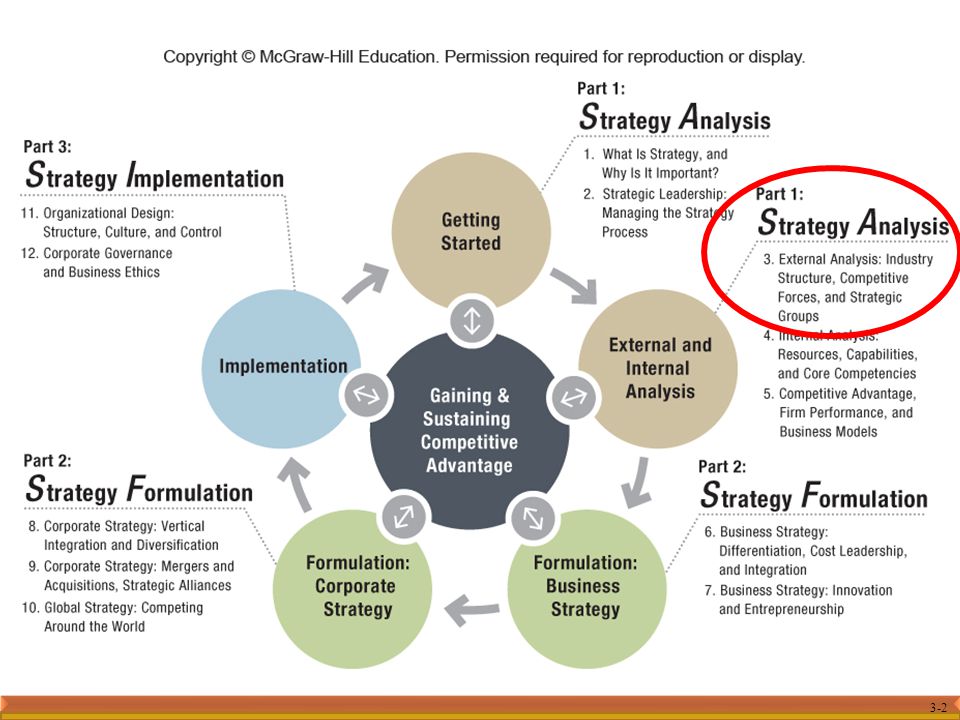
Chapter 3 External Analysis: Industry Structure, Competitive Forces, and Strategic Groups

3
Chapter Outline 3.1 The PESTEL Framework 3.2 Industry Structure and Firm Strategy: The Five Forces Model 3.3 Changes over Time: Industry Dynamics 3.4 Explaining Performance Differences within the Same Industry: Strategic Groups 3.5 Implications for the Strategist

4
Tesla Motors and the U.S. Automotive Industry
ChapterCase 3 Courtesy of Tesla Motors Tesla Motors and the U.S. Automotive Industry With high entry barriers, the BIG THREE – GM, Ford, and Chrysler – dominated the U.S. car market until the 1980s. There have been no new recent entrants due to the HIGH industry entry barriers. Tesla Motors’ Model S received outstanding market reception, and was awarded the 2013 MotorTrend Car of the Year.

5
EXTERNAL ANALYSIS PESTEL Framework INDUSTRY ANALYSIS Five Forces Model COMPETITOR ANALYSIS Strategic Group Mapping MACRO MICRO

6
3.1 The PESTEL Framework KEY CONCEPTS Managers mitigate threats and exploit opportunities by analyzing the external environmental forces. Factors are interdependent. Framework to scan, monitor, and evaluate important external factors/trends impacting a firm in its quest for competitive advantage.

7
Exhibit 3.1 The Firm Embedded in Its External Environment

8
How the Eurozone Crisis Is Hurting Companies
Strategy Highlight 3.1 How the Eurozone Crisis Is Hurting Companies The EU (European Union) began its formation in the early 1950s. Today – The euro is the common currency used by 17 of the 27 EU member states. 2009 – Several European countries took on too much debt and were unable to repay their credit obligations. Strict austerity programs were enacted. Banks tightened credit hampering firms worldwide.
 began its formation in the early 1950s. Today – The euro is the common currency used by 17 of the 27 EU member states – Several European countries took on too much debt and were unable to repay their credit obligations. Strict austerity programs were enacted. Banks tightened credit hampering firms worldwide.")
9
3.2 Industry Structure and Firm Strategy: The Five Forces Model
A group of (incumbent) firms that face the same set of suppliers and buyers Industry Analysis Identifies the industry's profit potential Derive implications for a firm’s strategic position within an industry Strategic Position A firm’s ability to create value (V) for customers while containing costs (C) Competitive Advantage = a large value gap (V - C)
 firms that face the same set of suppliers and buyers. Industry Analysis. Identifies the industry s profit potential. Derive implications for a firm’s strategic position within an industry. Strategic Position. A firm’s ability to create value (V) for customers while containing costs (C) Competitive Advantage = a large value gap (V - C)")
10
The Five Forces in the Airline Services Industry
Strategy Highlight 3.2 The Five Forces in the Airline Services Industry Low Entry Barriers Powerful Suppliers Powerful Buyers Strong Substitute Threat Intense Rivalry RESULTS – Low overall industry profit potential, thus an “unattractive” industry for investment.

11
INDUSTRY FORCES IMPACT FIRM PROFITABILITY
ATTRACTIVE INDUSTRY Sustainable Competitive Advantage Easier High profit potential The weaker the five forces UNATTRACTIVE INDUSTRY Sustainable Competitive Advantage Harder Low profit potential The stronger the five forces

12
ANALYZING INDUSTRY STRUCTURE USING FIVE – FORCES
Threat of New Entrants (and Entry Barriers) Absolute cost advantages Proprietary learning curve Access to inputs Government policy Economies of scale Capital requirements Brand identity Switching costs Access to distribution Expected retaliation Proprietary products Complementors Number of complements Relative value added Barriers to complement entry Engagement of complements Buyer perception of complements Complement exclusivity Industry value chain – from raw materials and other inputs, to channel to end consumer Supplier Power Supplier concentration Importance of volume to supplier Differentiation of inputs Impact of inputs on cost or differentiation Switching costs of firms in the industry Presence of substitute inputs Threat of forward integration Cost relative to total purchases in industry Degree of Rivalry Exit barriers Industry concentration Fixed costs/value added Industry growth Intermittent overcapacity Product differences Switching costs Brand identity Diversity of rivals Corporate stakes Buyer Power (Channel and End consumer) Bargaining leverage Buyer volume Buyer information Brand identity Price sensitivity Threat of backward integration Product differentiation Buyer concentration vs. industry Substitutes available Buyer’s incentives Threat of Substitutes Switching costs Buyer inclination to substitute Price-performance tradeoff of substitutes Varity of substitutes Necessity of product or service
 Absolute cost advantages. Proprietary learning curve. Access to inputs. Government policy. Economies of scale. Capital requirements. Brand identity. Switching costs. Access to distribution. Expected retaliation. Proprietary products. Complementors. Number of complements. Relative value added. Barriers to complement entry. Engagement of complements. Buyer perception of complements. Complement exclusivity. Industry value chain – from raw materials and other inputs, to channel to end consumer. Supplier Power. Supplier concentration. Importance of volume to supplier. Differentiation of inputs. Impact of inputs on cost or differentiation. Switching costs of firms in the industry. Presence of substitute inputs. Threat of forward integration. Cost relative to total purchases in industry. Degree of Rivalry. Exit barriers. Industry concentration. Fixed costs/value added. Industry growth. Intermittent overcapacity. Product differences. Switching costs. Brand identity. Diversity of rivals. Corporate stakes. Buyer Power (Channel and End consumer) Bargaining leverage. Buyer volume. Buyer information. Brand identity. Price sensitivity. Threat of backward integration. Product differentiation. Buyer concentration vs. industry. Substitutes available. Buyer’s incentives. Threat of Substitutes. Switching costs. Buyer inclination to substitute. Price-performance tradeoff of substitutes. Varity of substitutes. Necessity of product or service.")
13
The Threat of Entry Incumbent firms can benefit from several important sources of entry barriers: Economies of scale Network effects Customer switching costs Capital requirements Advantages independent of size Government policy Credible threat of retaliation

14
Strength & Degree of Competitive Rivalry
Exit barriers in the industry Quantity and variability of strength in competitive dynamics Stage if the industry life-cycle Industry fragmentation vs. consolidation Perceptions of customer switching costs

15
The Power of Suppliers Can demand higher prices for their inputs.
POWERFUL SUPPLIERS Can demand higher prices for their inputs. Capture part (sometimes a large part) of the economic value created. Signs of Strong Suppliers Suppliers industry is concentrated. They don’t depend heavily on the incumbent’s industry. Incumbent firms face high switching costs. Suppliers’ products are differentiated. Limited substitutes Suppliers have credible forward integration threats.
 of the economic value created. Signs of Strong Suppliers. Suppliers industry is concentrated. They don’t depend heavily on the incumbent’s industry. Incumbent firms face high switching costs. Suppliers’ products are differentiated. Limited substitutes. Suppliers have credible forward integration threats.")
16
The bargaining power of buyers impacts industry profit potential.
The Power of Buyers The bargaining power of buyers impacts industry profit potential. POWERFUL BUYERS Can demand a lower price or higher product quality Reduce industry profit potential: Through price discounts (limited revenue) Through increased quality / better service (higher costs) As they capture part of the economic value created Credible threat of backwards integration
 Through increased quality / better service (higher costs) As they capture part of the economic value created. Credible threat of backwards integration.")
17
The Threat of Substitutes
This threat derives from products/services fulfilling the needs of current customers from outside the industry. POWERFUL SUBSTITUTES: THE POWER OF SUBSTITUTES is HIGH when: Price-performance: Has an attractive trade-off The buyer’s switching cost is low Breadth/availability of substitute options Substitutes limit the price that industry competitors can charge for their products/services.

18
Exhibit 3.3 Industry Competitive Structures Along The Continuum From Fragmented To Consolidated

19
Adding a Sixth Force: The Strategic Role of Complements
A product, service, or competency that adds value when used in tandem with the original product offering Complementor – A firm that provides a good/service that leads customers to value your firm’s offering more when the two are combined Co-opetition – Cooperation by competitors to achieve a strategic objective

20
3.3 Changes over Time: Industry Dynamics
The static five forces model cannot determine the speed of change for an industry. As consolidated industries tend to be more profitable than fragmented ones, firms tend to change their industry structures toward being more consolidated through (horizontal) mergers and acquisitions. Industry Profitability Consolidation
 mergers and acquisitions. Industry Profitability Consolidation.")
21
Exhibit 3. 5 Strategic Groups and the Mobility Barriers in the U. S
Exhibit 3.5 Strategic Groups and the Mobility Barriers in the U.S. Domestic Airline Industry

22
3.4 Explaining Performance Differences Within the Same Industry: Strategic Groups
Firms in the same strategic group follow a similar strategy. Strategic group differences identify business-level strategies. Direct competitors – same strategic group firms. Intra-group rivalry exceeds inter-group rivalry: Rivalry among firms within a strategic group is more intense than the rivalry between strategic groups.

23
3.5 Implications for the Strategist
PESTEL analysis guiding consideration: How the external factors identified affect the firm’s industry environment Porter’s five forces model identifies industry profit potential and firm positioning for gaining and sustaining competitive advantage. Strategic group map helps to find performance differences within the focal industry.

24
ChapterCase 3 Consider This…
Courtesy of Tesla Motors Consider This… Recent dynamics in the automotive industry have lowered the profit potential, reducing its attractiveness. Tesla Motors has demonstrated how new technology can be used to circumvent entry barriers. However, incumbent firms are also introducing hybrid or all-electric cars, further increasing rivalry in the industry.

Similar presentations