Download presentation
Presentation is loading. Please wait.

1
Industry Overview Institute for Attractions Managers IAAPA Operations and Safety MarketingLeadershipFinance Revenue Operations

2
Program Goals To develop skills necessary to become a senior member of a management team To demonstrate an understanding of the complexities involved in business development and expansion in the industry To explore different issues and challenges facing people in the industry

3
Program Goals To apply critical leadership skills such as communication, decision-making, consensus-building, networking and negotiation To learn independently and cooperatively within groups to achieve success

4
Objectives Participants will: Make decisions based on information provided Define elements of five core content areas: Finance, Marketing, Revenue Operations, Leadership, and Safety Share insight into best practices in the industry Construct a personal plan of action

5
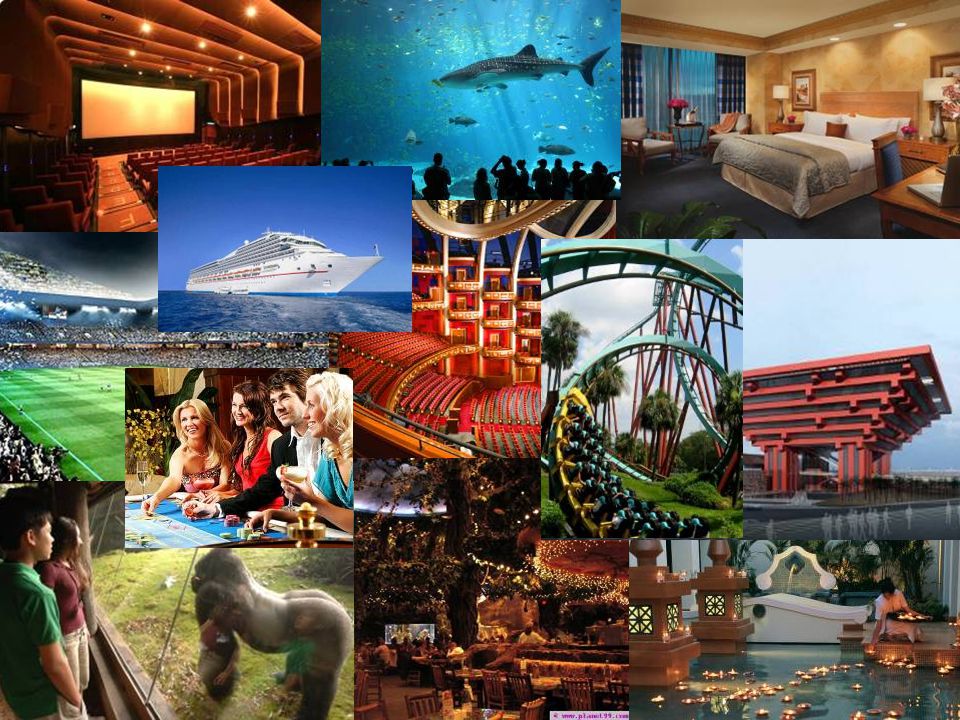
Themepark Industry: An Overview

6
What is the attraction industry?

8
No, it wasn´t all started with a mouse… The Theme Park concept was introduced by “the mouse” in 1955 with the opening of Disneyland…

9
USA-CanadaEuropeAsia/the PacificRest of the world 1950Start 1960DevelopmentStart 1970ExpansionDevelopmentStart 1980MaturityExpansionDevelopmentStart 1990ConcentrationAdaptationExpansionDevelopment 2000DiversificationRepositioningSelective growthExpansion Salvador Anton Clavé, 2007 Dynamics of Theme Park development by world region

10
European Pleasure Garden Theme Park Amusement Park Movie Park Salvador Anton Clavé, 2007

11
185.6 million Total theme park attendance for top 25 worldwide parks 121.4 million Total visits to the top 20 parks in North America 57.3 million Attendance for the top 20 European parks 65.5 million Total visits to the top 10 Asian parks 12.3 million Attendance to top 10 parks in Mexico and Latin America 20.7 million Top 20 worldwide waterparks attendance in 2009 12.8 million Total visitation to top 15 waterparks in US 2009 TEA/AECOM Report Theme parks of today

13
Size of the European Theme park industry 308 parks - 146 mio. visits €4,3 bn. total revenue, 47,000 FTE, €700 mio. in tax contribution and €8,6 bn. in total economic impact of onsite-spending. Size of the other European leisure industries Waterparks: 170 parks - 50 mio. visitors Zoos & Aquariums: 270 facilities - 140 mio. Visitors Museums: 19.000 museums - 460 mio visitors Theme parks of today

14
What will Theme Parks be like in 2020?

15
Theme Parks of tomorrow

16
Trends and tendencies Mature market Higher expectations Consolidation Building destinations Hybrids Branding rules Changed demographics

17
The European Consolidation !

19
Marketing Our product… a feeling! Differs from most other industies. Typically harder to market emotions and feelings Segments Ranging from children families over festival enthusiasts to seniors and businessmen. Marketing is typically local or regional Loyalty Special treatment for Annual card holders – or ambassadors New media New possibilities to create emotions outside the park

20
Leadership and Human Ressources Many professions Ride operators, security staff, architects, engineers, cooks, waiters, actors, singers, dancers, mucisians, cleaning staff, art directors, webdesigners, communication staff, nurses, zoo keepers, divers, veterinarians, lawyers, tailors, carpenters, painters, scenographers, lifeguards, electricians, blacksmiths, retail staff, firemen etc. All ages Children, students and seniors All vacancies Full times, part times, seasonals, internships Challenges Mass seasonal hiring Young people Need to hire and train employees quickly High turnover

21
Finance Attraction finance… … is very similar to all other industries. Rollercoaster Math Our industry operates with definitions like Annual Attendance, Gross Revenue, Per Capita, Revenue per capita etc. Amusement Parks Originally, many family-owned parks, high equity Now more consolidations - Merlin, CDA, etc. Higher debt share = demands for higher dividends Other attractions Often funded by public or semi-public Increased need to exist on traditional market conditions, which are difficult due to the mature market Increases the competition

22
Revenue operations Revenue types for a typical attraction park Food & Beverage (F&B), retail, games (skill games, arcades, paid attractions), lockers, parking, rental of strollers, wheelchairs, etc. Challenges Limited season Impulse purchase – and majority by the end of the day Limited repeat business

23
IAAPA 2009

24
Operations and safety What is the most safe recreation activity? Bowling – Amusement Rides – Fishing

25
Operations and safety Injury Risk The attractions industry is safer than most other forms of recreation Injury risk rates* for a variety of sports and recreation: Football: 343 Fixed-site amusement rides: 8 Basketball: 876 Bowling: 39 Fishing: 88 In 2007, over 300 million guests visited US amusement facilities; of the total 1,713 ride-related injuries, only 132 required overnight hospital treatment More than just ride safety… Food, employees, crowd safety, fire, risk of terror, animal hold etc. * Injuries per million activity participant days Source: National Safety Council Research and Statistical Services Group: “Fixed-Site Amusement Ride Injury Survey,” 2005 Update

Similar presentations


 2006 Pearson Education, Upper Saddle River, NJ, 07458. All Rights Reserved Chapter Nine: Destinations.>")
 2006 Pearson Education, Upper Saddle River, NJ, 07458. All Rights Reserved Chapter Eight: Attractions.>")


