Download presentation
Presentation is loading. Please wait.

1
Presented by Yuhua Jiao 2012-12-4

2
Outline Limitation of some network clustering methods Hierarchical Agglomerative Clustering – Method – Performance evaluation Results and Discussion – Data preparation – Empirical evaluation – Multi-resolution view of a physical interaction network

3
Background of network clustering Challenges in biological network analysis – Inference of structure of subgroups of related vertices – Prediction of possible links not represented in data Network clustering is a valuable approach for – summarizing the structure in large networks, – predicting unobserved interactions – predicting functional annotations

4
Common limitations for some network clustering algorithms Poor resolution of top-level clusters – Stochastic block models Over-splitting of bottom-level clusters – Hierarchical network model Requirements to pre-define the number of clusters prior to analysis – Stochastic block models An inability to jointly cluster over multiple interaction types

5
Hierarchical network model by Clauset, Moore, and Newman (CMN)
")
6
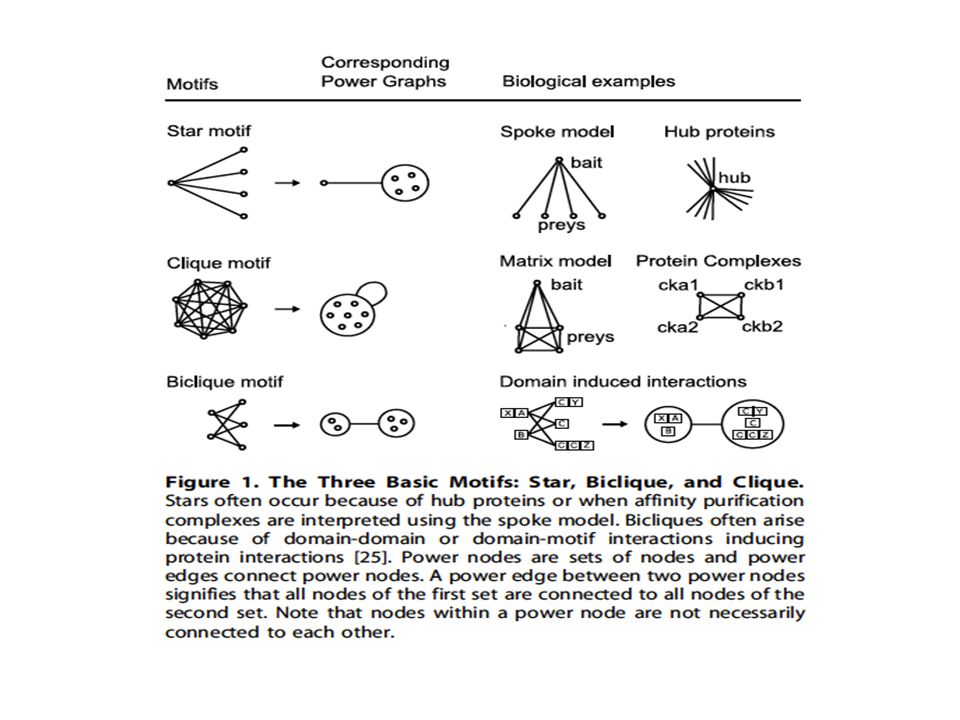
Hierarchical Agglomerative Clustering – An approximation for optimizing a network probability motivated by CMN. – Interactions with vertices outside a group often provide more information than within-group interactions. – Power Graph Analysis is a lossless transformation of biological networks into a compact, less redundant representation, exploiting the abundance of cliques and bicliques as elementary topological motifs.

8
HAC-Method Notation – Graph – Groups – Edges between groups – Total possible connections – Number of holes

9
For a given pair of group i and j, edges between groups are result of t ij independent Bernoulli trials. The probability of observed edges, conditioned on parameter θ ij The maximum likelihood estimate of θ ij is The maximum likelihood value of P ij ( θ ij ) is HAC-Method
 is HAC-Method.")
10
Given two groups: n i = 5 n j = 4 Probability density is The likelihood of the flat model An instance of flat model

11
HAC-Method Generalization to hierarchical model – Binary dendrogram T – Each node r in the dendrogram represents the joining of vertices in left sub-tree L(r) and vertices in right sub-tree R(r). – Er and hr are numbers of edges and holes crossing between the left and right sub-trees.

12
HAC-Agglomerative clustering Maximum likelihood guide tree – K top-level clusters – R total tree nodes – Merge clusters 1 and 2 into cluster 1’, defining a new model M’ 1 2 1’ Current top level

13
HAC-Agglomerative clustering

14
During the merging process, if clusters 1 and 2 are selected for merging and are both collapsed, the probability ratio is calculated, where the subscripts indicate edges and holes within and between groups. The merged cluster is collapsed if λ c ≥1. Clusters of two vertices are always merged because λ c = 1. HAC-Bayesian model selection for terminal clusters

15
Performance Evaluation Data preparation – BioGRID database (http://thebiogrid.org) – The graph is undirected and unweighted with no self edges. Other methods – Fast Modularity (CNM) – Variational Bayes modularity (VBM) – Graph Diffusion Kernel (GDK) – Heuristic merging scores Edge density (HAC-E) Combined edge density and shared neighbor density (HAC-ES) Decomposed Newman modularity Q from CNM (HAC-Q)
 – Variational Bayes modularity (VBM) – Graph Diffusion Kernel (GDK) – Heuristic merging scores Edge density (HAC-E) Combined edge density and shared neighbor density (HAC-ES) Decomposed Newman modularity Q from CNM (HAC-Q).")
16
Link Prediction Starting with a real-world network, training networks are generated by deleting a specified fraction of edges. A test set is defined by the held-out edges and a random choice of an equal number of holes. The trained group structure provides maximum likelihood estimates for edges within and between clusters (Eq. 9). For VBM and CNM, we estimated edge densities between all pairs of clusters and within all clusters. For hierarchical models, we estimated densities between all left and right clusters at all tree levels. For GDK, each pair’s diffusion was directly used to rank pairs. Finally we assessed precision and recall of pairs in the test set ranked by link probability or GDK score.
. For VBM and CNM, we estimated edge densities between all pairs of clusters and within all clusters. For hierarchical models, we estimated densities between all left and right clusters at all tree levels. For GDK, each pair’s diffusion was directly used to rank pairs. Finally we assessed precision and recall of pairs in the test set ranked by link probability or GDK score..")
17
Results and Discussion Data Preparation

23
Further Discussion Extending HAC to dynamic networks is limited: – A solution is required to the identifiability problem: how complexes inferred at one time point correspond to complexes inferred at other time points. – Transitions of a protein from one complex to another must be permitted by the model, requiring dynamical coupling between network snapshots. Dynamical Hierarchical Agglomerative Clustering (DHAC) – Maximum likelihood is converted to fully Bayesian statistics – The likelihood modularity is ‘kernelized’ with an adaptive bandwidth to couple network clusters at nearby time points. – Matching clusters across time points is solved with a new belief propagation method that extends Expectation-Maximization and belief propagation for bipartite matching to consistently match multiple time-evolving clusters.
 – Maximum likelihood is converted to fully Bayesian statistics – The likelihood modularity is ‘kernelized’ with an adaptive bandwidth to couple network clusters at nearby time points. – Matching clusters across time points is solved with a new belief propagation method that extends Expectation-Maximization and belief propagation for bipartite matching to consistently match multiple time-evolving clusters..")
24
http://www.reference.com/browse/wi ki/Interactome Interactome is defined as the whole set of molecular interactions in cells. It is usually displayed as a directed graph. Molecular interactions can occur between molecules belonging to different biochemical families (proteins, nucleic acids, lipids, carbohydrates,....) and also within a given family. When spoken in terms of proteomics, interactome refers to protein-protein interaction network(PPI), or protein interaction network (PIN). Another extensively studied type of interactome is the protein-DNA interactome (network formed by transcription factors (and DNA or chromatin regulatory proteins) and their target genes. The word "interactome" was originally coined in 1999 by a group of french scientists headed by Bernard Jacq (see Nucleic acids research 27(1):89-94; PubMed ID: 9847149). There are now nearly 300 research articles indexed with the word "interactome" (http://www.ncbi.nlm.nih.gov/sites/entrez) and more than 140 000 Google pages (http://www.google.fr/search?hl=fr&q=interactome&btnG=Recherche+Google&meta=). It has been suggested that the size of an organism's interactome correlates better than genome size with the biological complexity of the organism (Stumpf, et al., 2008). Although protein-protein interaction maps containing several thousands of binary interactions are now available for several organisms, none of them is presently complete and the size of interactomes is still a matter of debate. Methods of mapping the interactome The study of the interactome is called interactomics. The basic unit of protein network is protein-protein interaction (PPI). Because the interactome considers the whole organism, there is a need to collect a massive amount of information. Experimental methods have been devised to determine PPI, such as 1) affinity purification and 2) yeast two hybrid (Y2H). The former is suited to identify a protein complex, while the latter is suited to explore the binary interactions in mass quantities. The former is considered as a low-throughput method (LTP), while the latter is considered as high-throughput method (HTP). There have been several efforts to map the eukaryotic interactome through HTP methods. Yeast, fly, worm, and human HTP maps have been created so far (2006).
 and also within a given family. When spoken in terms of proteomics, interactome refers to protein-protein interaction network(PPI), or protein interaction network (PIN). Another extensively studied type of interactome is the protein-DNA interactome (network formed by transcription factors (and DNA or chromatin regulatory proteins) and their target genes. The word interactome was originally coined in 1999 by a group of french scientists headed by Bernard Jacq (see Nucleic acids research 27(1):89-94; PubMed ID: ). There are now nearly 300 research articles indexed with the word interactome ( and more than Google pages ( hl=fr&q=interactome&btnG=Recherche+Google&meta=). It has been suggested that the size of an organism s interactome correlates better than genome size with the biological complexity of the organism (Stumpf, et al., 2008). Although protein-protein interaction maps containing several thousands of binary interactions are now available for several organisms, none of them is presently complete and the size of interactomes is still a matter of debate. Methods of mapping the interactome The study of the interactome is called interactomics. The basic unit of protein network is protein-protein interaction (PPI). Because the interactome considers the whole organism, there is a need to collect a massive amount of information. Experimental methods have been devised to determine PPI, such as 1) affinity purification and 2) yeast two hybrid (Y2H). The former is suited to identify a protein complex, while the latter is suited to explore the binary interactions in mass quantities. The former is considered as a low-throughput method (LTP), while the latter is considered as high-throughput method (HTP). There have been several efforts to map the eukaryotic interactome through HTP methods. Yeast, fly, worm, and human HTP maps have been created so far (2006)..")
25
Assortative networks ? http://en.wikipedia.org/wiki/Assortative_mixi ng Disassortative networks ? Power graph[16] ? Graph/structure degree ?

Similar presentations


>")


