Download presentation
Presentation is loading. Please wait.

1
Dimension reduction : PCA and Clustering Slides by Agnieszka Juncker and Chris Workman

2
Sample Preparation Hybridization Array design Probe design Question Experimental Design Buy Chip/Array Statistical Analysis Fit to Model (time series) Expression Index Calculation Advanced Data Analysis ClusteringPCAClassification Promoter Analysis Meta analysisSurvival analysisRegulatory Network Normalization Image analysis The DNA Array Analysis Pipeline Comparable Gene Expression Data
 Expression Index Calculation Advanced Data Analysis ClusteringPCAClassification Promoter Analysis Meta analysisSurvival analysisRegulatory Network Normalization Image analysis The DNA Array Analysis Pipeline Comparable Gene Expression Data")
3
Motivation: Multidimensional data Pat1Pat2Pat3Pat4Pat5Pat6Pat7Pat8Pat9 209619_at7758470553427443874749337950503152937546 32541_at280387392238385329337163225288 206398_s_at1050835126817231377804184611802521512 219281_at391593298265491517334387285507 207857_at1425977202711849398146585936591318 211338_at37272838331636233130 213539_at1241974541161621139797160149 221497_x_at1208617599115808311966113 213958_at179225449174185203186185157215 210835_s_at203144197314250353173285325215 209199_s_at75812348331449769111098763811331326 217979_at57056397279686949467310136651568 201015_s_at533343325270691460563321261331 203332_s_at649354494554710455748392418505 204670_x_at5577321653234423577133744328351520723061 208788_at6483271057746541270361774590679 210784_x_at142151144173148145131146147119 204319_s_at298172200298196104144110150341 205049_s_at3294135120802066372613962244214212481974 202114_at83367473312988623718865017341409 213792_s_at646375370436738497546406376442 203932_at19771016243618561917822118910926232190 203963_at976377136857491616692 203978_at315279221260227222232141123319 203753_at146811053811154980141912535541045481 204891_s_at787115274127576615370108 209365_s_at472519365349756528637828720273 209604_s_at7727413021610831180235177191 211005_at495812970567761617572 219686_at694342345502960403535513258386 38521_at775604305563542543725587406906 217853_at36716810716028726427311389363 217028_at4926266735425163468332814822397827023977 201137_s_at4733284618345471507923303345146023173109 202284_s_at60018231657117797223031574173110472054 201999_s_at8979598008082971014998663491613 221737_at265200130245192246227228108394 205456_at636410060826553737181 201540_at8211296165185861311441549146218132112 219371_s_at147721078371534240711041688295612331313 205297_s_at4183942937784053084471005709201 208650_s_at1025455685872718884534863219846 210031_at288162205155194150185184141206 203675_at2683883182564132792392461098532 205255_x_at677308679540398447428333197417 202598_at176342298174174413352323459311 201022_s_at251193116106155285221242377217 218205_s_at102812662085179010962302192511487872700 207820_at634353971025475483075 202207_at77217241674413184748372130

4
Dimension reduction methods Principal component analysis (PCA) –Singular value decomposition (SVD) Multidimensional scaling Correspondence analysis Cluster analysis –Can be thought of as a dimensionality reduction method as clusters summarize data
 –Singular value decomposition (SVD) Multidimensional scaling Correspondence analysis Cluster analysis –Can be thought of as a dimensionality reduction method as clusters summarize data")
5
Fundamental methods Multidimensional scaling –Rearranges objects so as to arrive at a configuration that best approximates the observed distances Factor analysis (PCA, SVD) –New vector space defined by variability in the data Independent component analysis (ICA) –In factor analysis, the similarities between objects are expressed in the correlation matrix. With MDS one may analyze any kind of similarity or dissimilarity matrix, in addition to correlation matrices.

6
Principal Component Analysis (PCA) Used for visualization of high-dimensional data Projects high-dimensional data into a small number of dimensions –Typically 2-3 principle component dimensions Often captures much of the total data variation in a only few dimensions Exact solutions require a fully determined system (matrix with full rank) –i.e. A “square” matrix with independent entries

7
PCA

8
Singular Value Decomposition

9
Principal components 1 st Principal component (PC1) –Direction along which there is greatest variation 2 nd Principal component (PC2) –Direction with maximum variation left in data, orthogonal to PC1
 –Direction along which there is greatest variation 2 nd Principal component (PC2) –Direction with maximum variation left in data, orthogonal to PC1")
10
PCA: Eigen values (variance by dimension)
")
11
PCA Eigen vectors

12
PCA projections (as XY-plot)
")
13
PCA: Leukemia data, precursor B and T Plot of 34 patients, dimension of 8973 genes reduced to 2

14
PCA of genes (Leukemia data) Plot of 8973 genes, dimension of 34 patients reduced to 2
 Plot of 8973 genes, dimension of 34 patients reduced to 2")
15
Why do we cluster? Organize observed data into meaningful structures Summarize large data sets Used when we have no a priori hypotheses Optimization: –Minimize within cluster distances –Maximize between cluster distances

16
Many types of clustering methods Method: –K-class –Hierarchical, e.g. UPGMA Agglomerative (bottom-up) Divisive (top-down) –Graph theoretic Information used: –Supervised vs unsupervised Final description of the items: –Partitioning vs non-partitioning –fuzzy, multi-class
 Divisive (top-down) –Graph theoretic Information used: –Supervised vs unsupervised Final description of the items: –Partitioning vs non-partitioning –fuzzy, multi-class.")
17
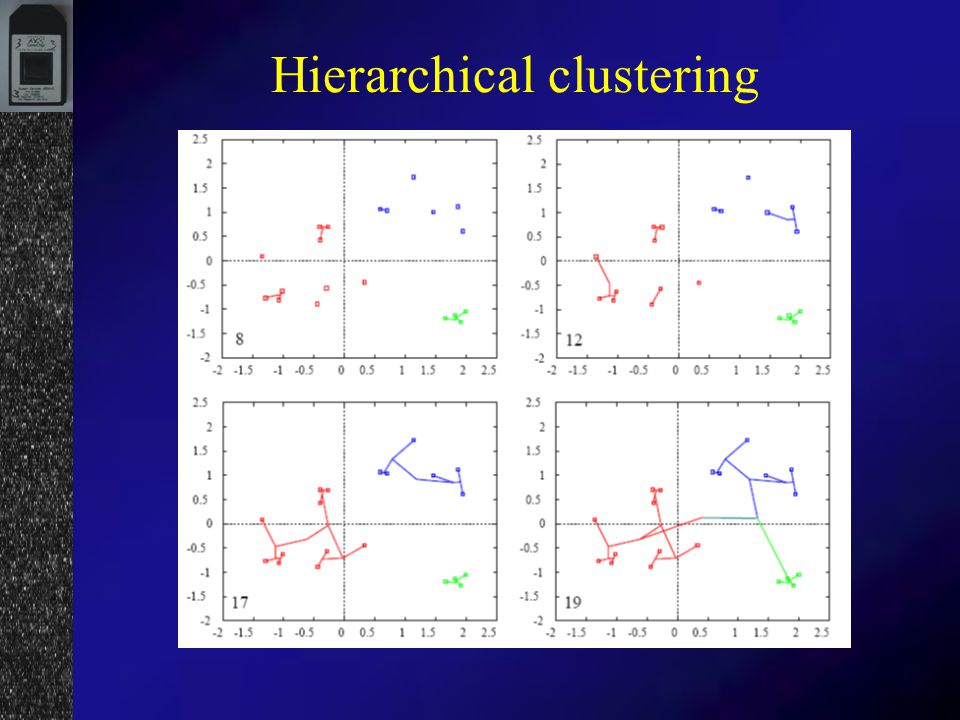
Hierarchical clustering Representation of all pair-wise distances Parameters: none (distance measure) Results: –One large cluster –Hierarchical tree (dendrogram) Deterministic
 Results: –One large cluster –Hierarchical tree (dendrogram) Deterministic")
18
Hierarchical clustering – UPGMA Algorithm Assign each item to its own cluster Join the nearest clusters Re-estimate the distance between clusters Repeat for 1 to n

19
Hierarchical clustering

21
Data with clustering order and distances Dendrogram representation

22
Leukemia data - clustering of patients

23
Leukemia data - clustering of patients on top 100 significant genes

24
Leukemia data - clustering of genes

25
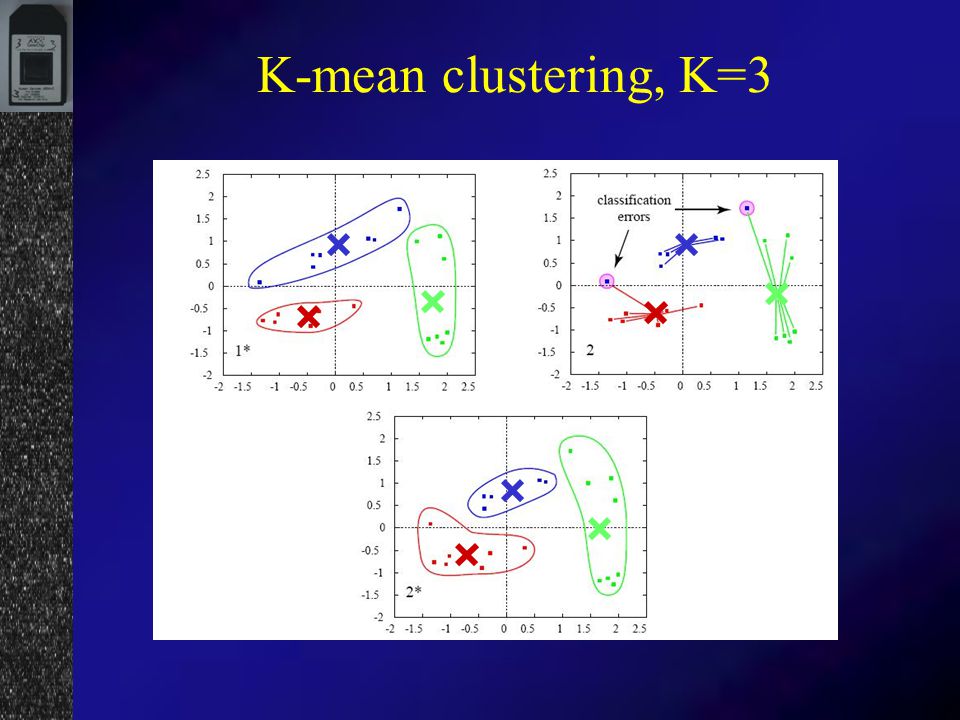
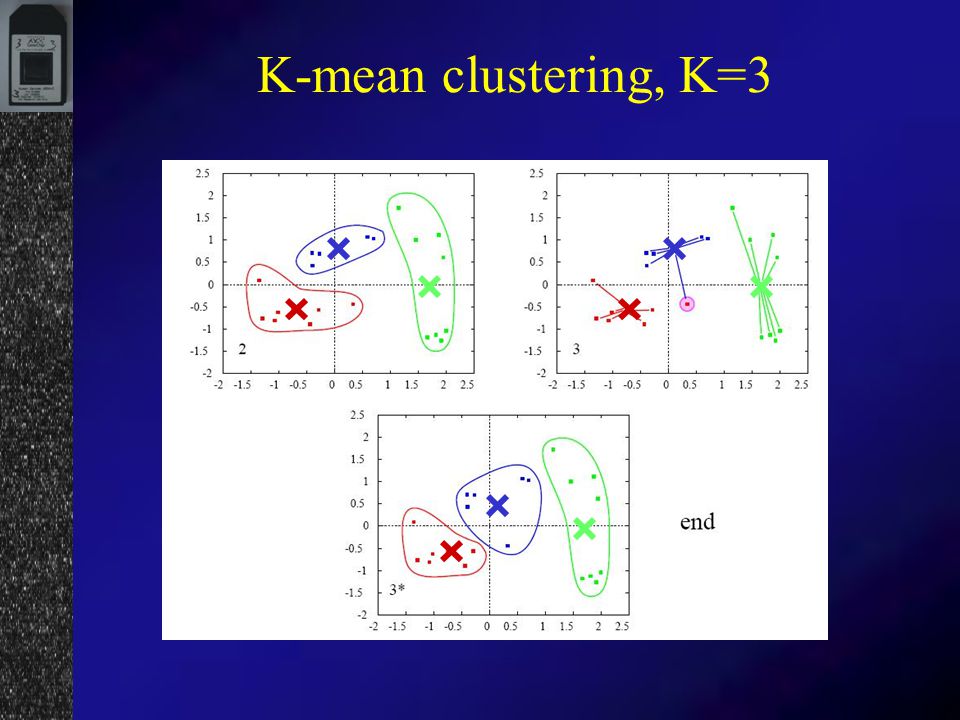
K-means clustering Partition data into K clusters Parameter: Number of clusters (K) must be chosen Randomized initialization: –Different clusters each time –Non-deterministic
 must be chosen Randomized initialization: –Different clusters each time –Non-deterministic")
26
K-means - Algorithm

27
K-mean clustering, K=3

30
K-means clustering of Leukemia data

31
K-means clustering of Cell Cycle data

32
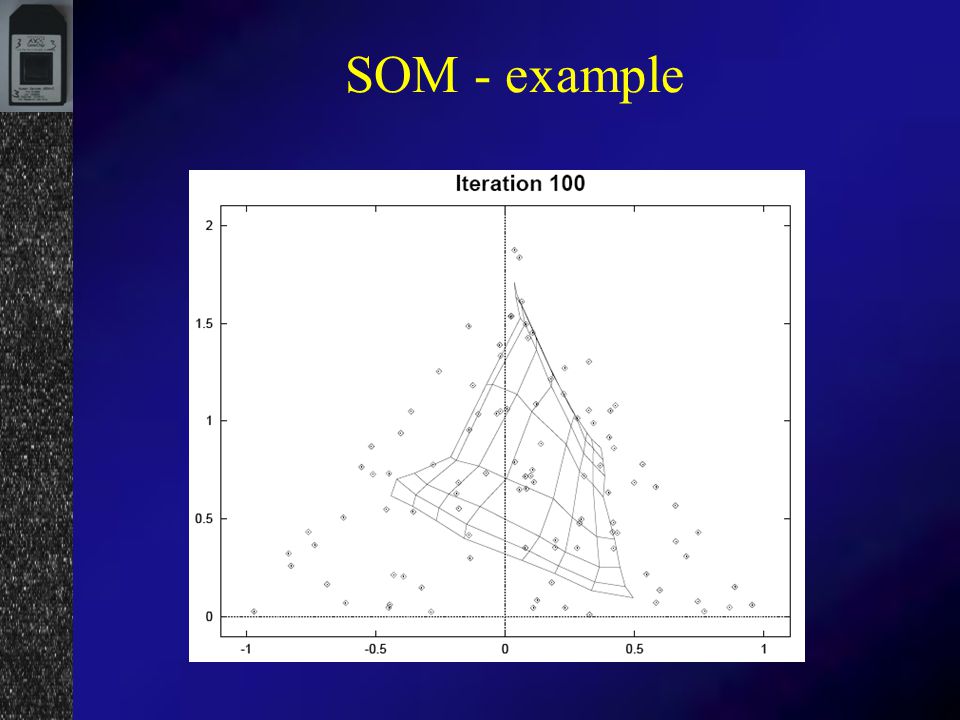
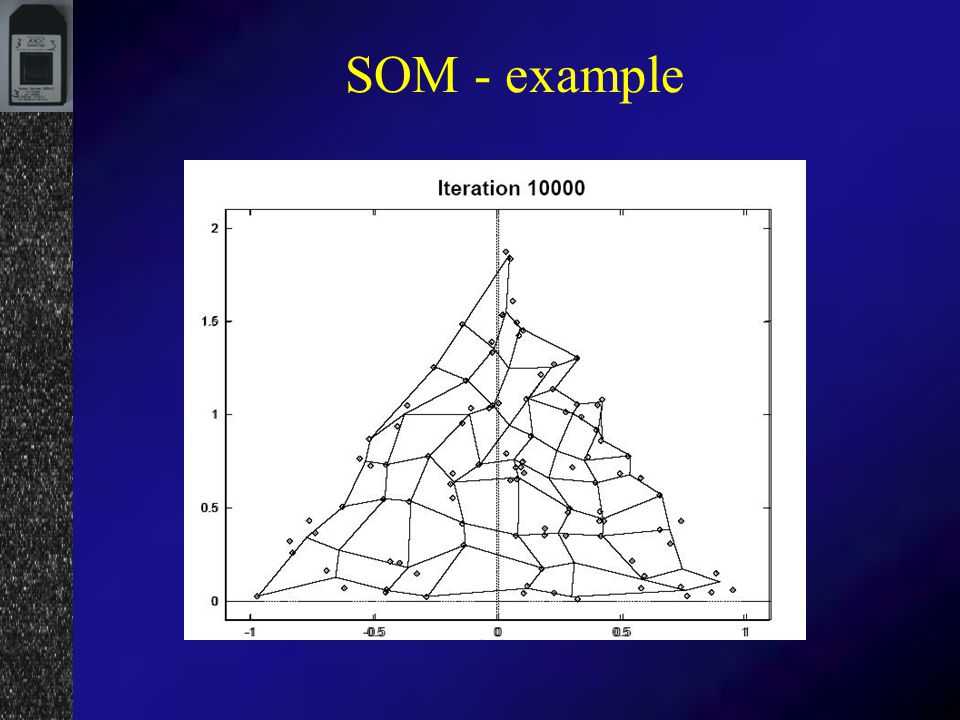
Self Organizing Maps (SOM) Partitioning method (similar to the K-means method) Clusters are organized in a two-dimensional grid Size of grid is specified –(eg. 2x2 or 3x3) SOM algorithm finds the optimal organization of data in the grid
 SOM algorithm finds the optimal organization of data in the grid.")
33
SOM - example

38
Comparison of clustering methods Hierarchical clustering –Distances between all variables –Time consuming with a large number of gene –Advantage to cluster on selected genes K-means clustering –Faster algorithm –Does only show relations between all variables SOM –Machine learning algorithm

39
Distance measures Euclidian distance Vector angle distance Pearsons distance

40
Comparison of distance measures

41
Summary Dimension reduction important to visualize data Methods: –Principal Component Analysis –Clustering Hierarchical K-means Self organizing maps (distance measure important)
")
Similar presentations


 Dimensionality Reductions or data projections Random projections.>")

>")
 for Clustering Gene Expression Data K. Y. Yeung and W. L. Ruzzo.>")


 Dimension reduction theory (PCA/Clustering) Dimension reduction.>")


 or if you are looking at a time series (cell cycle.>")