Download presentation
Presentation is loading. Please wait.

1
Effect of Agriculture in Nitrogen Budget of Turkey
Aysun VATANSEVER BOŞÇA Ministry of Environment and Urbanization Assoc.Prof.Dr. Selim L. SANİN Hacettepe Universıty

2
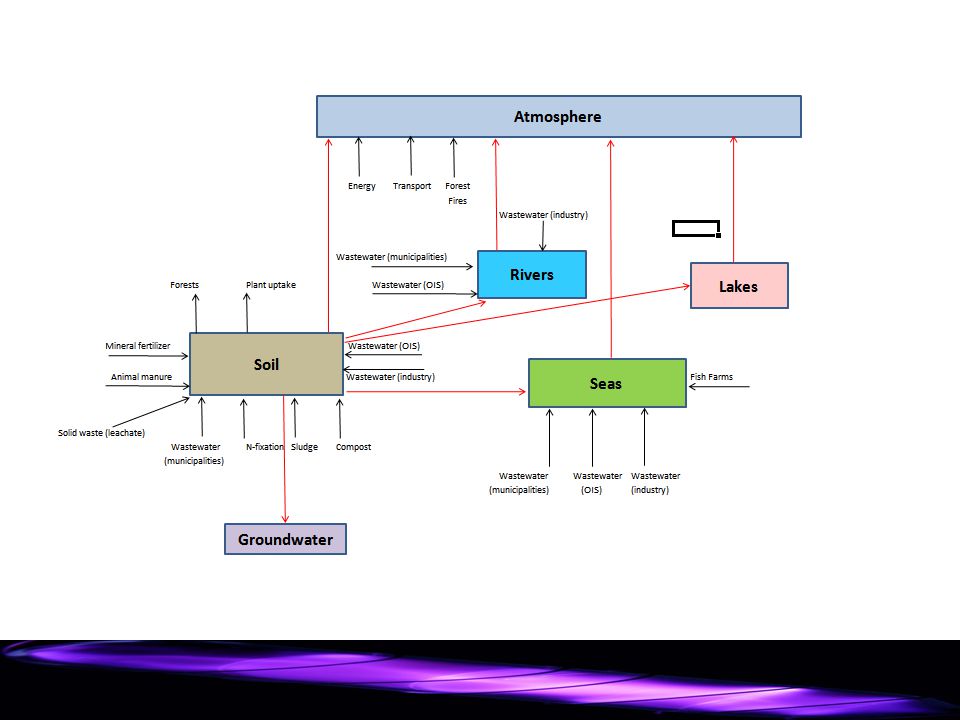
The impact of anthropogenic activities on nitrogen cycle has become significantly important.
Today the nitrogen fixation has doubled compared to times before the industrial revolution. This will affect the ecology of agriculturally leading countries, like Turkey. Recent increases in anthropogenic N fixation in relation to “natural” N fixation. Modified from Vitousek, P. M. and P. A. Matson (1993).
.")
4
Anthropogenic reactive nitrogen in the environment is difficult to control, because it is associated with two of the most important need of human needs: Food & Energy

5
Turkey: total area 779 450 km² divided into 7 geographical regions,
comprising 81 provinces. major economic activities are; - industry (34% of GDP, labor force 15%), - services (48% of GDP, labor force 39%) and - agriculture (18% of GDP, labor force: 47% )
, - services (48% of GDP, labor force 39%) and. - agriculture (18% of GDP, labor force: 47% )")
6
In terms of employment, agriculture is the most important sector in the Turkish economy. Agriculture is an important contributor to foreign trade as well and supplies 14% of total exports and accounts for 6% of total imports

7
Agricultural Activities
FOR OUR MODEL: N-budget elements of Agricultural crop production & Livestock production are defined and their contributions are calculated.

8
Agriculture Application of inorganic (mineral) fertilizers
Nitrogen uptaken by crops from soil N-fixation: Nitrogen input to soil by - nitrogen fixing plants - free living soil organisms

9
1. Total chemical fertilizer-N consumption trend of Turkey

10
Distribution of Fertilizer-N consumption with respect to provinces (in 2005 [1000 tones])
![Distribution of Fertilizer-N consumption with respect to provinces (in 2005 [1000 tones])](http://slideplayer.com/slide/4216279/14/images/10/Distribution+of+Fertilizer-N+consumption+with+respect+to+provinces+%28in+2005+%5B1000+tones%5D%29.jpg "Distribution of Fertilizer-N consumption with respect to provinces (in 2005 [1000 tones])")
11
2. N uptake by Plants The plants produced in Turkey are divided into three groups by Turkish Statistical Institute (TUIK) according to ISIC Rev.3 (International Standard Industrial Classification of All Economic Activities, Rev.3): - Fruits - Vegetables - Field crops (leguminous plants, industrial crops, cereals, oil seeds, fodder crops, tuberous crops) Nitrogen uptake coefficients of different plants provided by OECD for each plant group are used.
 according to ISIC Rev.3 (International Standard Industrial Classification of All Economic Activities, Rev.3): - Fruits. - Vegetables. - Field crops (leguminous plants, industrial crops, cereals, oil seeds, fodder crops, tuberous crops) Nitrogen uptake coefficients of different plants provided by OECD for each plant group are used.")
12
Nitrogen uptake coefficients of different plants
N-coefficient (kg Nitrogen/tone production) FRUITS Raspberry 6 Pears Pistachios Avocado Quinces Almonds 6 Walnuts Tea 15 Strawberry Mulberry Apple Plums Hazelnuts Grape fruits 4 Oleaster Figs Apricots Carobs Chestnuts FRUITS N-coefficient (kg Nitrogen/ton eproduction) Cornel 6 Lemons 4 Mandarin Medlar Bananas Pomegranates Oranges Peaches Persimmons Sour oranges Grape Sour cherries Loquats Wild apricots Olive Kiwi 6 Cherries
 FRUITS. Raspberry. 6. Pears. Pistachios. Avocado. Quinces. Almonds. 6. Walnuts. Tea. 15. Strawberry. Mulberry. Apple. Plums. Hazelnuts. Grape fruits. 4. Oleaster. Figs. Apricots. Carobs. Chestnuts. FRUITS. N-coefficient (kg Nitrogen/ton eproduction) Cornel. 6. Lemons. 4. Mandarin. Medlar. Bananas. Pomegranates. Oranges. Peaches. Persimmons. Sour oranges. Grape. Sour cherries. Loquats. Wild apricots. Olive. Kiwi. 6. Cherries.")
13
VEGETABLES Tomatoes N-coefficient (kg Nitrogen/tone production) Hairy
4 Broad bean Pumpkin Okra Reddish shell bean Pea Pepper Kidney beans Broccoli Dill Tomatoes Artichokes bean Carrots Cucumbers Spinach (Sakız) Cauliflower Celeriac Red Beets Asparagus Cabbages Water Melon 4 Melon
 Cauliflower. Celeriac. Red Beets. Asparagus. Cabbages. Water Melon. 4. Melon.")
14
FIELD CROPS FIELD CROPS N-coefficient (kg Nitrogen/ton production)
N-coefficient (kg Nitrogen/ton production) Theyme 22 Cumin Dry pepper Cotton (lint) 65 Sugar beets 3 Hop 43 Tobacco 46 OIL SEEDS Safflower 28 Sunflower 32 Cotton seed Poppy (seed) Flax 5 Rapeseed 38 Soybean Sesame Groundnut 63 FODDER CROPS Wild vetches 11 Cow vetches Sainfoin Maize 5 Clover 17 Alfalfa TUBEROUS CROPS Beets for fodder 4 Potatoes Garlic Onion FIELD CROPS N-coefficient (kg Nitrogen/ton production) CEREALS Barley 20 Wheat Rye 21 Rice in the husk Millet 40 Canary gras Mixed grain Maize Oats LEGUMINOUS PLANTS Broad bean 31 Pea Kidney beans Wild vetches Fenugreek Wild pea Bean (dry) Cow vetches Lentil Grass pea Chick pea INDUSTRIAL CROPS Lupin 22 Anise Poppy (kapsule)
 Theyme. 22. Cumin. Dry pepper. Cotton (lint) 65. Sugar beets. 3. Hop. 43. Tobacco. 46. OIL SEEDS. Safflower. 28. Sunflower. 32. Cotton seed. Poppy (seed) Flax. 5. Rapeseed. 38. Soybean. Sesame. Groundnut. 63. FODDER CROPS. Wild vetches. 11. Cow vetches. Sainfoin. Maize. 5. Clover. 17. Alfalfa. TUBEROUS CROPS. Beets for fodder. 4. Potatoes. Garlic. Onion. FIELD CROPS. N-coefficient (kg Nitrogen/ton production) CEREALS. Barley. 20. Wheat. Rye. 21. Rice in the husk. Millet. 40. Canary gras. Mixed grain. Maize. Oats. LEGUMINOUS PLANTS. Broad bean. 31. Pea. Kidney beans. Wild vetches. Fenugreek. Wild pea. Bean (dry) Cow vetches. Lentil. Grass pea. Chick pea. INDUSTRIAL CROPS. Lupin. 22. Anise. Poppy (kapsule)")
19
3. a) Nitrogen fixation through the action of bacteria which live symbiotically in root nodules of leguminous crops The amount of N fixed in the soil by symbiotic bacteria is directly related to the area under crop and is calculated as: Quantity of N fixed in the soil [kg N] = Cultivated area of leguminous crop [hectare] X N fixation coefficient for the given crop [kg N/hectare]

20
Coefficients for nitrogen fixation by bacteria living in the roots of plants (OECD)
PLANT TYPE N-coefficient (kg N/hectare) Broad bean 83 Pea Kidney beans Wild vetches Fenugreek Wild pea Bean (dry) Cow vetches Lentil Grass pea Chick pea Clover 250 Alfalfa Soybean 100
 Broad bean. 83. Pea. Kidney beans. Wild vetches. Fenugreek. Wild pea. Bean (dry) Cow vetches. Lentil. Grass pea. Chick pea. Clover Alfalfa. Soybean")
21
Amount of Nitrogen fixed by N-fixing leguminous plants (tones)
")
22
3. b) Nitrogen fixation by Free living soil organisms:
The amount of N fixed by free living soil organisms is directly related to the land area data, i.e. arable, permanent crop and permanent pasture land, and is calculated as; Quantity of N fixed by free living soil organisms [kg N] = area of each type of land [hectare] X N fixation coefficient for the given type of land [kg N/hectare]

23
N coefficient = 4 kg/hectare
Agricultural and forest areas (1000 hectare) Nitrogen (tones) Years Total arable land Total land under permanent crops Land under permanent meadows and pastures Total utilized agricultural land Total arable land 1988 24.786 2.977 14.177 41.940 99.144 11.908 56.708 1989 24.880 3.017 42.074 99.520 12.068 1990 24.827 3.029 42.033 99.308 12.116 1991 24.631 3.023 12.378 40.032 98.524 12.092 49.512 1992 24.563 3.012 39.953 98.252 12.048 1993 24.481 3.054 39.913 97.924 12.216 1994 24.605 3.066 40.049 98.420 12.264 1995 24.373 2.461 39.212 97.492 9.844 1996 24.514 2.472 39.364 98.056 9.888 1997 24.297 2.567 39.242 97.188 10.268 1998 24.436 2.530 39.344 97.744 10.120 1999 24.279 2.523 39.180 97.116 10.092 2000 23.826 2.553 38.757 95.304 10.212 2001 23.800 2.550 14.617 40.967 95.200 10.200 58.468 2002 23.994 2.585 41.196 95.976 10.340 2003 23.372 2.656 40.645 93.488 10.624 2004 23.871 2.722 41.210 95.484 10.888 2005 23.830 2.776 41.223 95.320 11.104 2006 22.981 2.895 40.493 91.924 11.580 2007 21.979 2.909 39.505 87.916 11.636 2008 21.555 2.950 39.122 86.220 11.800 2009 21.351 2.943 38.911 85.404 11.772 2010 21.384 3.010 39.011 85.536 12.040
 Nitrogen (tones) Years. Total arable land. Total land under permanent crops. Land under permanent meadows and pastures. Total utilized agricultural land. Total arable land")
24
Livestock Production 5 main categories of animals
1. Cattle Breeding (4 sub-categories) native, hybrid, culture, cow 2. Sheep and Goat Farming (4 sub-categories) native sheep, merinos sheep, hair goat, angora goat 3. Poultry Raising (4 sub-categories) broiler, laying hen, goose, duck 4. Single Shank Raising (3 sub-categories) horse-donkey-hinny 5. Other (3 sub-categories) pig, camel
 native, hybrid, culture, cow. 2. Sheep and Goat Farming (4 sub-categories) native sheep, merinos sheep, hair goat, angora goat. 3. Poultry Raising (4 sub-categories) broiler, laying hen, goose, duck. 4. Single Shank Raising (3 sub-categories) horse-donkey-hinny. 5. Other (3 sub-categories) pig, camel.")
25
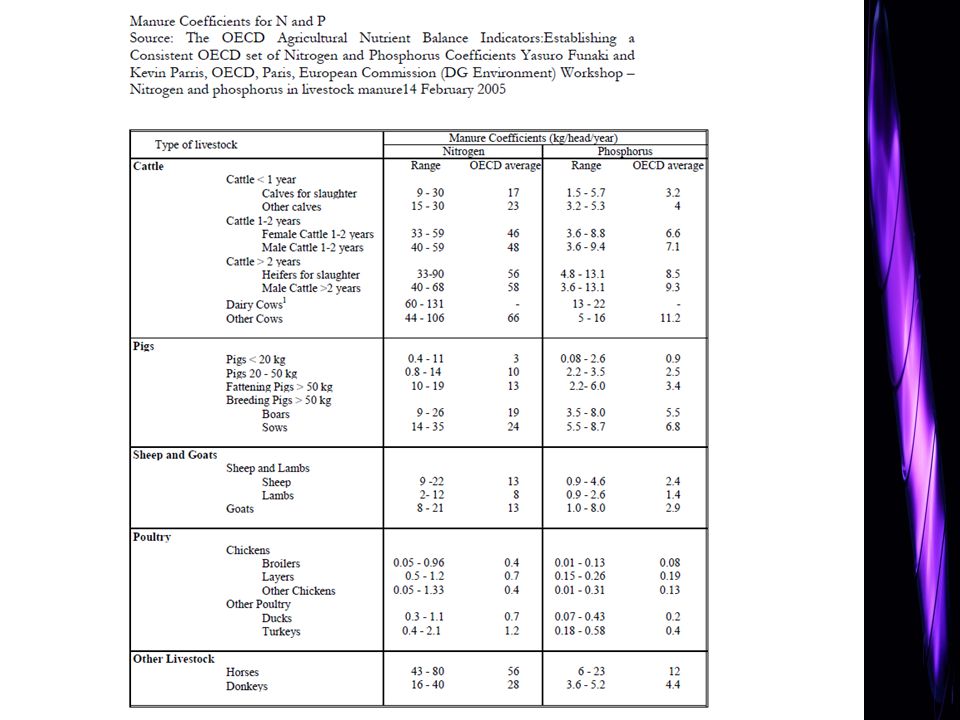
For each livestock category:
Estimated quantity of N in livestock manure [kg N/year] = Number of animals [heads] X Manure coefficient [kg N/head/year]

27
Animal Manure Nitrogen Production
Species 2004 2005 2006 2007 2008 2009 Cattle Breeding Sheep and Goat Farming Poultry Raising 98.892 93.032 Single Shank (horse-donkey-hinny) Raising 24.540 23.483 22.770 20.765 19.473 17.339 Other 106 71 74 83 77 Total (kg) Total (tones) 1.168 1.207 1.248 1.221 1.179 1.133
 Raising Other Total (kg) Total (tones)")
28
Animal Manure-N production with respect to years (Tones)
")
29
Distribution of Animal manure-N with respect to provinces at 2005 (1000 tones)
")
30
THANK YOU FOR YOUR ATTENTION

Similar presentations


. Trading in the Old World– New World Market Half of the students will be “New World Consumers” and the other half.>")


