Download presentation
Presentation is loading. Please wait.

1
Cities are an environmental abomination... Right?

2
“ The growth of cities will be the single largest influence on development in the 21st century. ” –UN, 1996, State of World Population

3
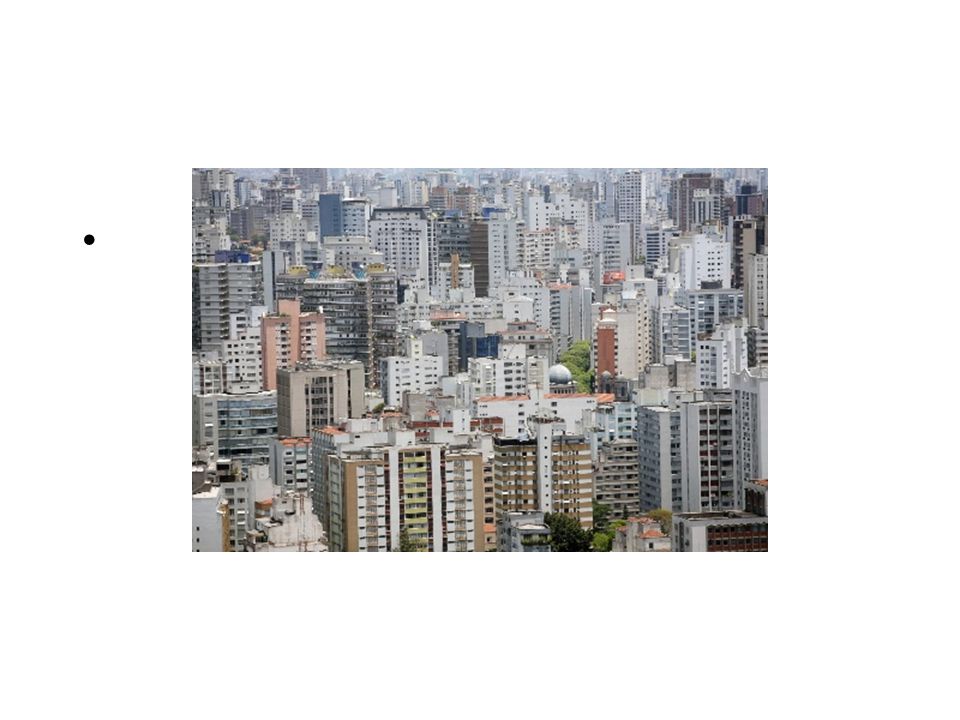
Largest urban areas 1. Tokyo, Japan - 28,025,000 2. Mexico City, Mexico - 18,131,000 3. Mumbai, India - 18,042,000 4. S á o Paulo, Brazil - 17, 711,000 5. New York City, USA - 16,626,000 6. Shanghai, China - 14,173,000 7. Lagos, Nigeria - 13,488,000 8. Los Angeles, USA - 13,129,000 9. Calcutta, India - 12,900,000 10. Buenos Aires, Argentina - 12,431,000

7
What’s bad about cities?

8
Air quality Magnitogorosk, RU Hyderabad, IND

9
Air quality Primary and secondary air pollution Primary: directly emitted –Particulate matter: pm10 and pm5 –Lead Secondary: forms in atmosphere –Ground level ozone

10
Impermeable surfaces

11
Don’t allow water to sink into the ground Instead, water runs off quickly to storm drains –Overwhelms sewage treatment plants, OR –Goes directly to nearby water bodies

12
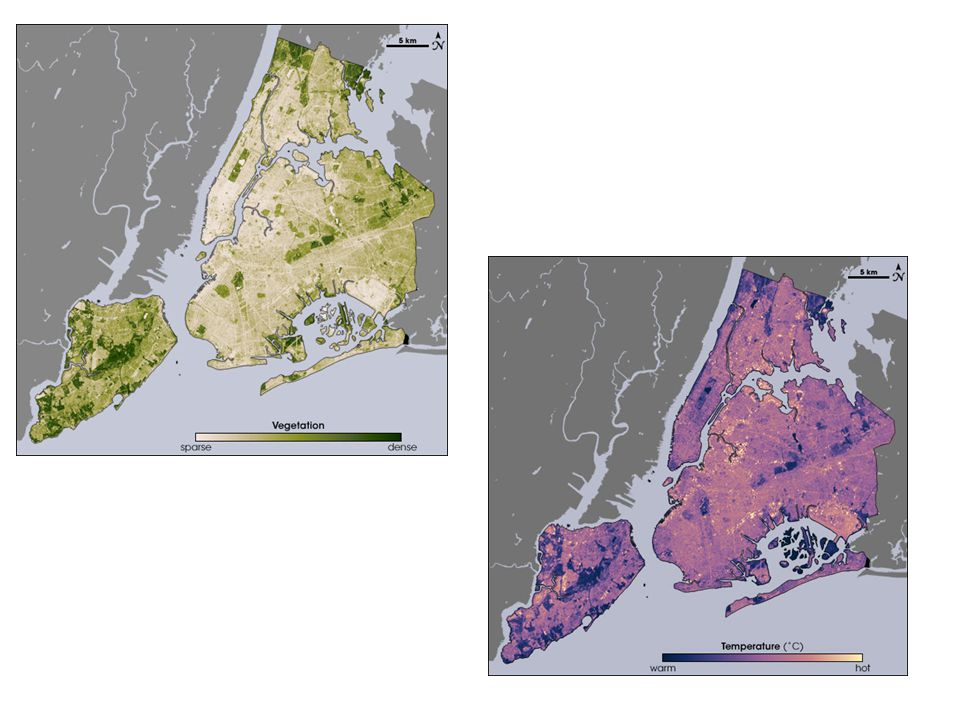
Cities influence climate Urban heat island effect Roads, buildings, other infrastructure replace vegetation Absorb solar energy during day, radiate heat at night –Roofs, roads can be 50-90 deg. F hotter than air temperature!

15
Major Urban Problems in U.S. Deteriorating services Aging infrastructures Budget crunches from lost tax revenues as businesses and affluent people leave Rising poverty with violence, drugs, decay Urban sprawl - growth of low-density development on edges of cities and towns –9 consequences of “bad growth”

16
75% of the US population live in urban areas occupying 3% of the country’s land area

18
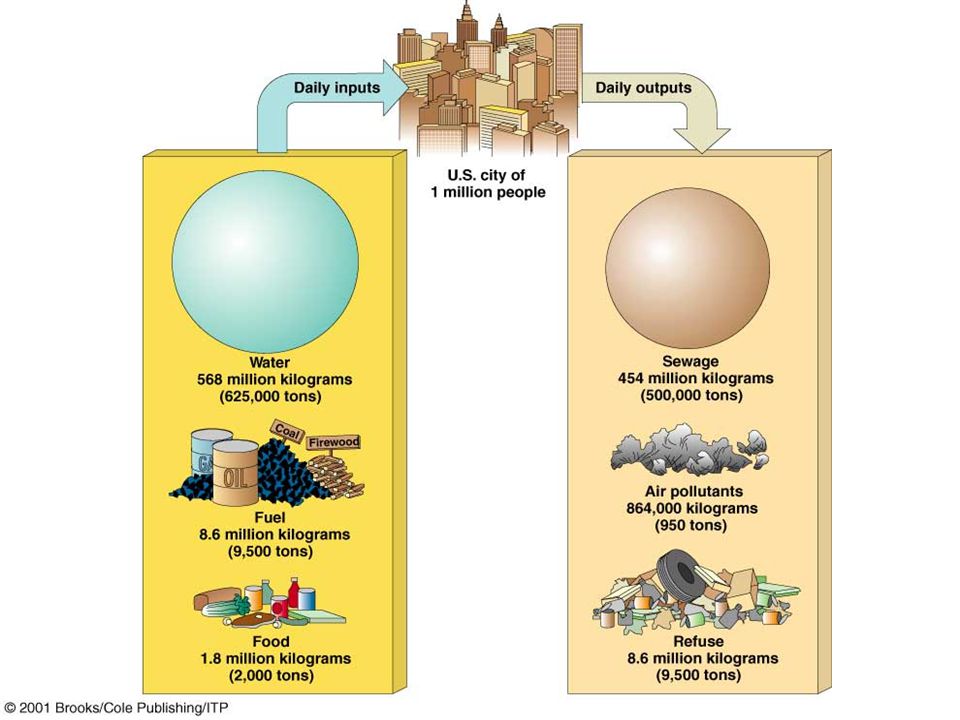
Urban Resource and Environmental Problems Destruction of plant life - what is $ value? Cities produce little of own food Urban heat island effect Water supply and flooding problems High pollution exposure

19
Urban Resource & Environmental Problems Excessive noise exposure health effects –Hearing loss, hypertension, muscle tension, migraines, headaches, higher cholesterol levels, gastric ulcers, irritability, insomnia, psychological disorders, aggression

20
Urban Resource & Environmental Problems Beneficial effects: –education –social services –medical care Harmful effects –infectious disease spread high density population inadequate drinking and sewage system –physical injuries –pollution exposure –Urban Sprawl

21
What’s good about cities?

22
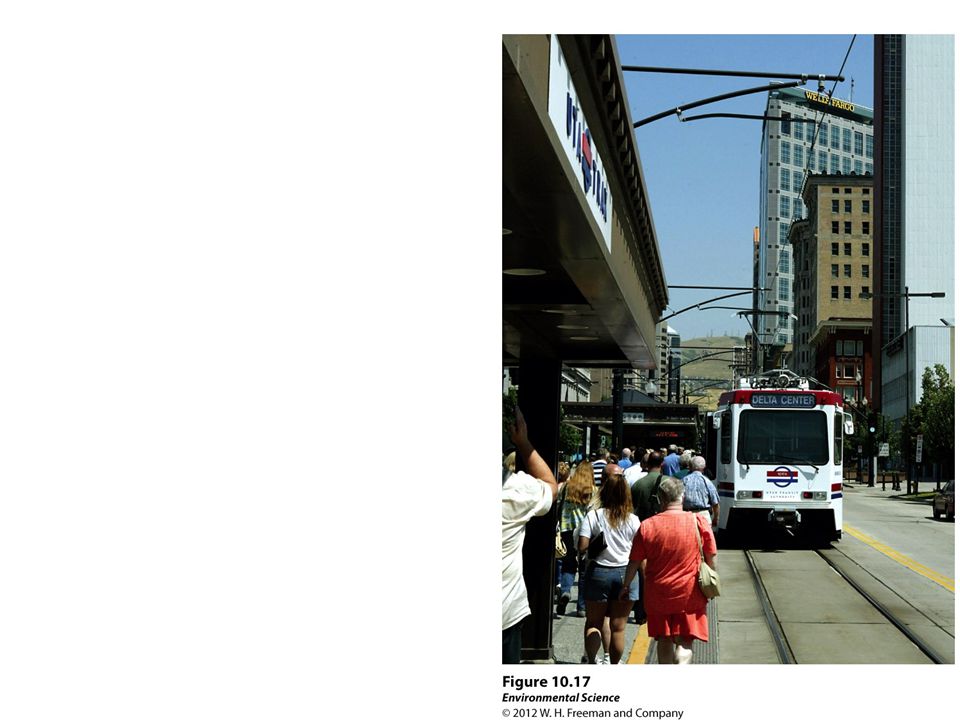
Transportation Greater use of mass transit and less use of private automobiles Much more walking in some cities

23
transportation Energy efficiency of different forms –Btus per person mile –Vanpool1322 –Eff. Hybrid1659 –Commuter rail2996 –Cars3512 –Air3261

24
Fighting obesity City dwellers less likely to be obese –St. John Newfoundland36% –Toronto16% –Vancouver12% –New York City20%

25
City Energy consumption- quad. BTU 4. 02 Per household Million BTU 85.3 Per household member Million BTU 33.7 town 1.94 102.339.7 suburb 2.46108.640.3 rural 2.1395.137.8

27
Alternatives to cities Suburbs –Developed during 20 th century –People wanted space Loans, returning veterans –Transportation: cars made living in one place, working in another possible Westchester cty, NY: world’s first large- scale suburban development

30
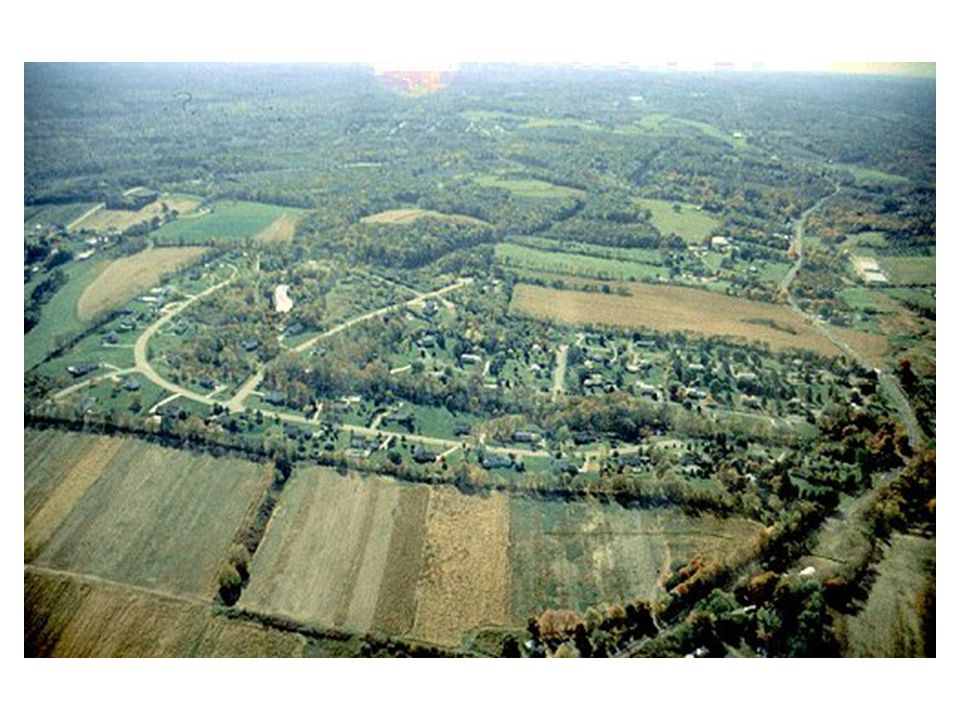
Sprawl development Spreading outward of city and suburbs Low-density development –Single family homes, large lots –Auto dependent development Long distances to work

31
Calgary, Alberta

32
Strip malls

34
Zoning Laws that regulate land use in a city or town are zoning laws (or regulations).
.")
35
Smart Growth A new development paradigm –Restoring center cities or older suburbs –Transit and pedestrian oriented –Mix of housing, retail, entertainment, other uses

37
Urban considerations Energy use Transportation Cars vs. bikes vs pedestrian vs mass transit Living space Recycling Lack of green space

39
The American Dream

40
Urban Sprawl

41
Urban Sprawl: Causes & Effects (1) Automobiles and Highway Construction (2) Living Costs (3) Urban Blight (4) Government Policies
 Automobiles and Highway Construction (2) Living Costs (3) Urban Blight (4) Government Policies")
42
(1) Automobiles and Highway Construction 1950’s: the Interstate Highway System Commuting Work in the city and live in the suburbs Best of both worlds!
 Automobiles and Highway Construction 1950’s: the Interstate Highway System Commuting Work in the city and live in the suburbs Best of both worlds!")
43
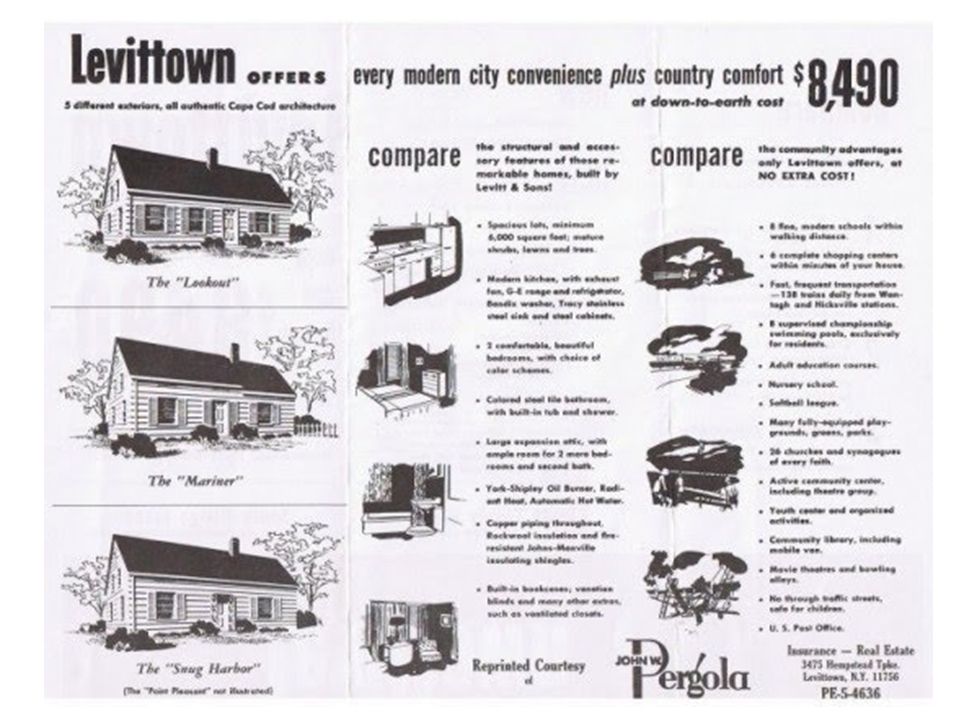
(2) Living Costs The American Dream More Land Larger House Privacy Lower taxes Overall, higher standard of livingLevittown Excludes low income families
 Living Costs The American Dream More Land Larger House Privacy Lower taxes Overall, higher standard of livingLevittown Excludes low income families")
45
(3) Urban Blight The degradation of the built and social environments of the city that often accompanies the accelerated migration to the suburbs A positive feedback loop
 Urban Blight The degradation of the built and social environments of the city that often accompanies the accelerated migration to the suburbs A positive feedback loop")
46
(3) Urban Blight People leaving cities Shrinking tax revenues City still must provide: police, fire, trash, sewage, public transportation, and social services Cities reduce services Crime increases Infrastructure deteriorates Built environment declines
 Urban Blight People leaving cities Shrinking tax revenues City still must provide: police, fire, trash, sewage, public transportation, and social services Cities reduce services Crime increases Infrastructure deteriorates Built environment declines")
47
(3) Urban Blight Suburban office parks Suburb to suburb commuting Can’t provide public transportation b/c too spread out Commute around cities instead of through them No need to go to the stores in a city
 Urban Blight Suburban office parks Suburb to suburb commuting Can’t provide public transportation b/c too spread out Commute around cities instead of through them No need to go to the stores in a city")
50
(3) Urban Blight Contributed to Racial Segregation “White Flight” Generated a disparity of opportunity Suburban Property tax revenues allow for better schools Example: Busing in Boston 1974
 Urban Blight Contributed to Racial Segregation White Flight Generated a disparity of opportunity Suburban Property tax revenues allow for better schools Example: Busing in Boston 1974")
51
(4) Government Policies Highway Trust Fund – Highway Revenue Act 1956 Federal gasoline tax to fund road construction/maintenance – Induced Demand Who can Explain this Positive Feedback mechanism?
 Government Policies Highway Trust Fund – Highway Revenue Act 1956 Federal gasoline tax to fund road construction/maintenance – Induced Demand Who can Explain this Positive Feedback mechanism")
53
(4) Government Policies Zoning Restrict land use to specific areas: residential, industrial, commercial In the suburbs, where the traditional “Main Street?” new tool: multi-use zoning
 Government Policies Zoning Restrict land use to specific areas: residential, industrial, commercial In the suburbs, where the traditional Main Street new tool: multi-use zoning")
54
(4) Government Policies FHA (1930’s) Federally Subsidized Mortgages Only wrote them in the financially low-risk areas
 Government Policies FHA (1930’s) Federally Subsidized Mortgages Only wrote them in the financially low-risk areas")
56
Levittown (before)
")
57
Levittown (after)
")
58
Smart Growth Development of sustainable, healthy communities Mixed Land UseCreate walkable Neighborhoods Create a Range of Housing OpportunitiesEncourage community and stakeholder collaboration in development decisions Take advantage of compact building design Foster distinctive, attractive communities with a strong sense of place Provide variety of Transportation ChoicesPreserve open space, farmland, natural beauty, and critical environmental areas Strengthen, direct development toward existing communities Make development decistions predictable, fair, and cost-effective

59
Smart Growth Transit Oriented development Portland, OR Infill Urban Growth Boundaries

60
Foster distinctive, attractive communities with a strong sense of place

62
Concentric Circle Model 1.Central business district (CBD) 2.Deteriorating transition zone 3.Worker’s homes 4.Middle-class suburbs 5.Commuter's zone
 2.Deteriorating transition zone 3.Worker’s homes 4.Middle-class suburbs 5.Commuter s zone")
63
Sector Model 1.High-rent residential 2.Intermediate-rent residential 3.Low-rent residential 4.Education and recreation 5.Transportation 6.Industrial 7.Core (CBD)
")
64
Multiple-Nuclei Model 1.CBD 2.Wholesale, light manufacturing 3.Low-rent residential 4.Intermediate-rent residential 5.High-rent residential 6.Heavy manufacturing 7.Outlying business district 8.Residential Suburb 9.Industrial Suburb

66
Impacts of Urban Sprawl Land and Biodiversity Loss of cropland Loss of forests & grasslands Loss of wetlands Loss & fragmentation of wildlife habitats Increased wildlife road kill Increased soil erosion Human Health and Aesthetics Contaminated drinking water & air Noise pollution Sky illumination at night Traffic congestion Water Increased runoff Increased surface water & groundwater pollution Increased use of surface water & groundwater Decreased storage of Surface water & groundwater Increased flooding Decreased natural Sewage treatment

67
Impacts of Urban Sprawl Energy, Air, and Climate Increased energy use and waste Increased air pollution Increased greenhouse gas Emissions Enhanced global warming Warmer microclimate (heat island effect) Economic Effects Higher taxes Decline of downtown business districts Increased unemployment in central city Loss of tax base in central city
 Economic Effects Higher taxes Decline of downtown business districts Increased unemployment in central city Loss of tax base in central city")
68
Transportation and Urban Development Determines where people live, where they go to work and buy stuff, how much land is paved and exposure to air pollution Cities grow up if they can’t grow out; more prone to use mass transit Urban sprawl due to cheap gas and land and highways; dispersed car-centered cities use 10x more energy

69
Drive alone 80% Other 4% Public transit 5% Car pool 11% Motor vehicle concentration Ground transportation: individual (cars, etc) and mass (buses and rail) U.S. has 35% of cars and trucks used for 98% of all urban transportation Motor scooters - effort to change to electric Riding bicycles; less pollution and dangerous and more efficient than walking – bicycles available for public use – bike and ride systems

70
Pros and Cons of Mass transit 3% mass transit use in U.S. to 47% in Japan 20% gasoline tax revenues to mass transit Rapid rail, suburban trains and trolley - efficient at high population density High speed rail lines – replace planes, buses and private cars; but require large government subsidies Bus systems more flexible than rail systems but efficient when full

Similar presentations


 – Environmental Impact Statement (EIS) – Environmental Mitigation Plan Endangered.>")


- mandates an environmental assessment of all projects involving federal money or permits.>")


