Download presentation
Presentation is loading. Please wait.

1
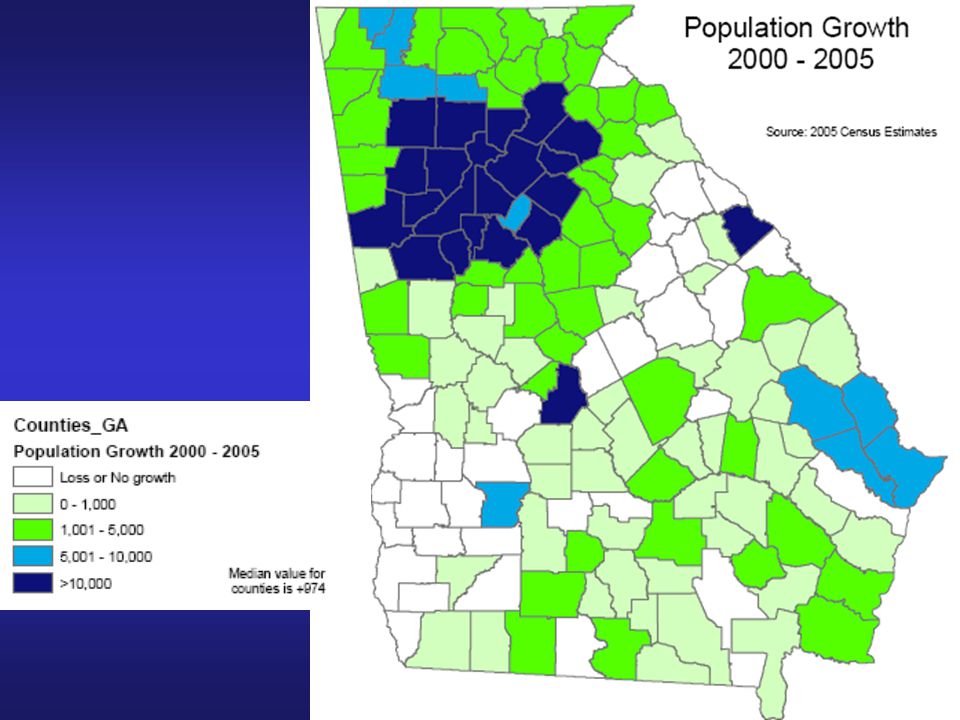
The Sunbelt = High Growth!

2
World (Now) 6,571,046,993 US (Now) 301,005,394 Georgia Estimate Census projections for July 20069,028,029 Georgia (July 2006) Actual Estimate9,363,941 Change since 20001,177,488 Georgia in 2030 (Cen Projection) 12,017,838 Net Change2,653,897 Net Change if 90% of real growth continues? 13,602,898 Additional people by 2030 ( Maybe ??)4,238,957 Where Are We Headed?
4,238,957 Where Are We Headed .")
3
Population Growth *Atlanta MSA was 12th in population in 1990; 11th in 2000; 9th in 2003; 4th in population increase, 1990-2000, and 1st in population increase between 2000 and 2006. 2000 - 200620062000 MSA#Rank*#Rank# Atlanta 890,24215,138,22394,247,98111 Dallas 842,42326,003,96745,161,5445 Houston 824,54235,539,94964,715,4078 Los Angeles 584,502612,950,129212,365,6272 New York 495,534718,818,536118,323,0021 Washington DC 494,21785,290,40084,796,1837 Miami 456,29395,463,85775,007,5646 Chicago 407,432109,505,74839,098,3163 Philadelphia 139,595265,826,74255,687,1474 Detroit 16,4091494,468,966104,452,5579 MSA: Metropolitian Statistical Area (28-County Area) Source: U.S. Census Regional Growth Where Are We Headed?
 Source: U.S. Census Regional Growth Where Are We Headed .")
7
15.5% of all births in Georgia in 2005 were to Hispanic mothers

15
People Turning 65 1995-2025

16
Age Another Way Over 60 2000: 1 in 10 2030: 1 in 5 US Dependency Ratio: (Elderly to Workers) 2010: 246 per 1,000 2030: 411 per 1,000 Georgia is the 3rd youngest state: median age 34.3 Utah (1) 28.5, Maine (50) 41.2 Demographics
 2010: 246 per 1, : 411 per 1,000 Georgia is the 3rd youngest state: median age 34.3 Utah (1) 28.5, Maine (50) 41.2 Demographics")
17
Household Type 1960 20002040 HH with Children 48% 33% 27% Single-Person HH 13% 26% 30% Figures for U.S. Source: Census for 1960 and 2000, 2040 adapted from Martha Farnsworth Riche, How Changes in the Nation’s Age and Household Structure Will Reshape Housing Demand in the 21st Century, HUD (2003). More Non-“Traditional” Households
. More Non- Traditional Households.")
18
Retired Location Preference In a city14% In a suburb close to a city37% In a suburb away from a city19% In a rural community30% Source: National Association of Realtors & Smart Growth America, American Preference Survey 2004.

19
Neighborhood Feature Preferences Source: National Association of Realtors & Smart Growth America, American Preference Survey 2004.

20
Life-Span of Building Space

21
In 1991, a group of leading architects and planners drafted a set of planning principles outlining an alternative development model for American cities and counties. These principles, named for the “Ahwahnee” hotel in Yosemite, California where they where originally presented, have been considered one of the first articulations of "smart growth." Origin of Smart Growth

22
Smart Growth America, a national organization, defines smart growth according to its outcomes which mirror the basic values of Americans. Smart growth achieves six goals: 1. 1. Neighborhood livability 2. 2. Better access, less traffic 3. 3. Thriving cities, suburbs and towns 4. 4. Shared benefits 5. 5. Lowers costs, lower taxes 6. 6. Keeping open space open Definitions of Smart Growth

23
1. 1.Mix land uses. 2. 2.Compact building design 3. 3.Housing choices 4. 4.Walkable neighborhoods 5. 5.Communities with sense of places 6. 6.Open space and environmental protection 7. 7.Direct development to existing communities 8. 8.Transportation choices 9. 9.Development decisions predictable and cost effective 10. 10. Stakeholder collaboration Smart Growth Network Principles

25
UGPM Regional Issues

26
Regional Best Practices VisioningVisioning Transportation fundingTransportation funding Training/educationTraining/education What else is need from a law perspective?

27
Georgia Planning AssociationGeorgia Planning Association www.georgiaplanning.org Smart Growth NetworkSmart Growth Network www.smartgrowth.org ARC ProgramsARC Programs www.atlantaregional.com Resources

Similar presentations


 981-4076>")


 – Environmental Impact Statement (EIS) – Environmental Mitigation Plan Endangered.>")
 Demographic Highlights TEXAS is: big. The population.>")


