Download presentation
Presentation is loading. Please wait.

1
Should Research Performance be Measured Unidimensionally? Evidence from Rankings of Academic Economists Magnus Henrekson and Daniel Waldenström November 22, 2007

2
Background Globalization and increased specialization –Knowledge and technology development less viable for a local market only Tensions between –Originality/uniqueness on the world market –Building own (local) paradigms; study issues of limited international interest Creates a need for measures of research –Both relative and absolute –Valuable for researchers and society (financiers) –Sub-disciplines vs. “the core”/mainstream

3
The purpose of this study A discussion of different measures –Measures are made by individuals with their own agendas –What are the appropriate measures available? –Are they (roughly) equivalent a priori? –Does choice of measure matter to ranking outcome? –Is the dominance of the KMS rankings justified? Own comparative analysis Basis for a second paper –People adjust behavior to what is being measured –This may give rise to measurement errors –Long-run implications for issues being researched? Used in resource allocation, hiring and promotion decisions
 equivalent a priori. –Does choice of measure matter to ranking outcome. –Is the dominance of the KMS rankings justified. Own comparative analysis Basis for a second paper –People adjust behavior to what is being measured –This may give rise to measurement errors –Long-run implications for issues being researched. Used in resource allocation, hiring and promotion decisions.")
4
Outline of study Measurement, quantification and ranking no fad Study of total international publication record of alla full econ professors tenured in Sweden Jan 2007; 93 (6 women), birth year 1939–1968; anonymized 7 measures which all have some relevance Measure both relative ranking and distribution of total output according to each measure Publications collected from EconLit. –Include published articles, books, book chapters –Excludes working papers (even when series in EconLit), reprints, reviews etc. Adjustment for n co-authors: weight output with 1/n Period: 1986 (SSCI start) – 2007 (June) Main result: Distribution of total ouput and ranking varies greatly across measures; highly questionable to rely on a single metric; KMS most skewed
, reprints, reviews etc. Adjustment for n co-authors: weight output with 1/n Period: 1986 (SSCI start) – 2007 (June) Main result: Distribution of total ouput and ranking varies greatly across measures; highly questionable to rely on a single metric; KMS most skewed.")
5
1. KMS (Kalaitzidakis et al. 2003) Based on #citations for journal and year (in JCR), covers 159 journals during 1994–98 KMS then adjusts for self-citations (excluded), age (articles before 1994 excluded), size (weights for #issues/year, #charachters), impact on the profession – iterates Problems: No adjustment for page size or non-acadademic economics literature (Kodrzycki & Yu 2006) Uncertain about the total effect of the iteration Time specific (94–98). Applicable to other periods? Extreme weight to top journals; examples
 Based on #citations for journal and year (in JCR), covers 159 journals during 1994–98 KMS then adjusts for self-citations (excluded), age (articles before 1994 excluded), size (weights for #issues/year, #charachters), impact on the profession – iterates Problems: No adjustment for page size or non-acadademic economics literature (Kodrzycki & Yu 2006) Uncertain about the total effect of the iteration Time specific (94–98). Applicable to other periods. Extreme weight to top journals; examples.")
6
KMS: ranking and distribution

7
2. IF (Impact Factor) IF predominates in science and medicine Published annually in JCR for 169 journals (in SSCIs econ-group) J of Health Econ ≈ AER, but in KMS AER 60 times higher! A cite equally weighted in all journals; and cites outside economics also counts Problems: IF includes self-citations; but not within-journal citations Except for articles, notes and reviews articles also includes letters, conference abstracts (all doc. types!) Two year window (T − 2) very narrow
 IF predominates in science and medicine Published annually in JCR for 169 journals (in SSCIs econ-group) J of Health Econ ≈ AER, but in KMS AER 60 times higher. A cite equally weighted in all journals; and cites outside economics also counts Problems: IF includes self-citations; but not within-journal citations Except for articles, notes and reviews articles also includes letters, conference abstracts (all doc. types!) Two year window (T − 2) very narrow.")
8
IF: ranking and distribution

9
3. KY (Kodrzycki & Yu 2006) Extension of KMS to include –22 additional journals (finance, labor relations, economic policy) –The scope of citing journals extended to all SSCI journals (KMS limited to econ journals) –Same years and method as KMS otherwise Only slightly less skewed than KMS –Reflects the sad fact that economics has limited impact on other fields
 Extension of KMS to include –22 additional journals (finance, labor relations, economic policy) –The scope of citing journals extended to all SSCI journals (KMS limited to econ journals) –Same years and method as KMS otherwise Only slightly less skewed than KMS –Reflects the sad fact that economics has limited impact on other fields.")
10
KY: ranking and distribution

11
Cumulative shares of journal weights in the three measures

12
4. SSCI (Social Sciences Citation Index) Citation may tell a different story than publication outlet (dry holes also in the AER) Social Sciences Citation Index (SSCI), made by Thomson ISI in the Web of Science; a commercial firm All cited publications per professor and then count the total no. of cites of the 5 most cited works Only citations in SSCI-journals are registered Non-SSCI journals and books, however, receive cites
 Citation may tell a different story than publication outlet (dry holes also in the AER) Social Sciences Citation Index (SSCI), made by Thomson ISI in the Web of Science; a commercial firm All cited publications per professor and then count the total no. of cites of the 5 most cited works Only citations in SSCI-journals are registered Non-SSCI journals and books, however, receive cites.")
13
SSCI: ranking and distribution

14
5. GS (Google Scholar) GS is a new, free bibliometric tool Covers citations from many publication types: –Academic – articles, books, WPs –Non-academic – reports, public investigations –Textbooks weigh heavily All cited publications per professor and then count the total no. of cites to the 5 most cited works –Ongoing effort to ascertain quality (Hal Varian!) Share of top scholars even higher than for KMS, but lower tail thicker
 GS is a new, free bibliometric tool Covers citations from many publication types: –Academic – articles, books, WPs –Non-academic – reports, public investigations –Textbooks weigh heavily All cited publications per professor and then count the total no. of cites to the 5 most cited works –Ongoing effort to ascertain quality (Hal Varian!) Share of top scholars even higher than for KMS, but lower tail thicker.")
15
GS: ranking and distribution

16
6. h-index (Hirsch 2005) Consistency in relevance and productivity (most published papers 0 or 1 cite) h-index of x has published x papers that have at least x citations (Andrei Shleifer = 85!) Individualized h-index Publish and Perish by Anne-Wil Harzing Based on Google Scholar Much more even distribution than the other measures
 Consistency in relevance and productivity (most published papers 0 or 1 cite) h-index of x has published x papers that have at least x citations (Andrei Shleifer = 85!) Individualized h-index Publish and Perish by Anne-Wil Harzing Based on Google Scholar Much more even distribution than the other measures.")
17
h-index: ranking and distribution

18
7. Works in EconLit Pure quantity measure of international publications No. of publications (articles, books, book chapters, not NBER, CEPR etc.) in EconLit Excludes much of the Swedish publications, as well as reprints, WPs and the like Problem No immediate connection to scientific impact (as opposed to citation-based measures) or quality (quality of journal ignored and non peer-reviewed publications)
 in EconLit Excludes much of the Swedish publications, as well as reprints, WPs and the like Problem No immediate connection to scientific impact (as opposed to citation-based measures) or quality (quality of journal ignored and non peer-reviewed publications).")
19
EconLit: ranking and distribution

20
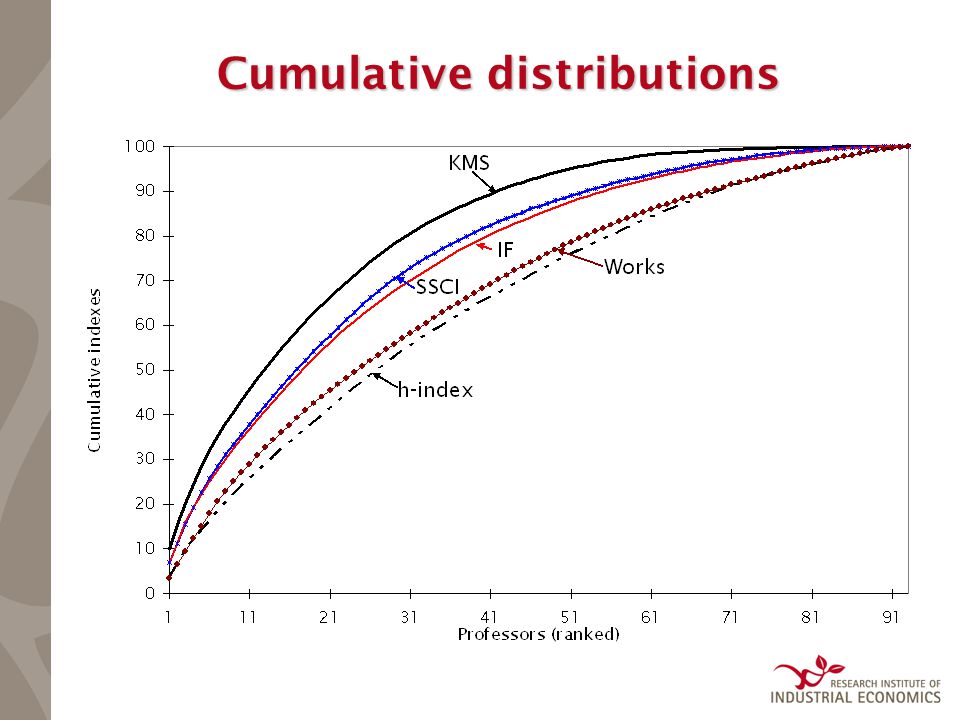
Cumulative distributions

22
Distributional outcomes – all measures VariableKMSIFKYSSCIGSh-indexWorks Max961.235.7603.1297.21438.028.050.7 Median52.03.931.328.069.77.014.0 Min00004.512.0 Mean103.75.661.646.7154.47.816.3 C.V.1.41.01.31.11.60.60.7 P90/P1097.716.051.022.119.04.35.2 P90/P2530.56.820.68.210.02.63.7 P90/P504.83.05.13.65.61.92.1 P95-P10024.419.222.419.330.09.812.3 P0-P507.415.79.413.912.735.525.8 Gini0.620.500.600.520.600.310.35 Most skewed Least skewed

23
Degree of overlap 1 – Ranks of top-10 in KMS in the other measures

24
Degree of overlap 2 - Correlations High correlation within types of measures –Journal weight-based (KMS, IF, KY) –Citation based (SSCI, GS, h-index) Lower correlation across types –Specifically: KMS less correlated with other types than IF & KY KMSIFKYSSCIGSh-indexWork KMS1 IF0.861 KY0.950.921 SSCI0.550.680.641 GS0.500.620.610.851 h0.490.640.580.670.791 Works0.400.570.430.510.510.671 Spearman rank correlations
 –Citation based (SSCI, GS, h-index) Lower correlation across types –Specifically: KMS less correlated with other types than IF & KY KMSIFKYSSCIGSh-indexWork KMS1 IF0.861 KY SSCI GS h Works Spearman rank correlations")
25
What factors correlate with success? In KMS (and h-index) men are the most successful Research universities promote successful research The younger Ph. D. the more productive researcher ”Fast track” professors are more successful Sex Research university Age at Ph.D. Time to become professor Years as professor KMS1.83**1.72**–0.08*–0.040.01 IF0.430.56**–0.05*–0.04**0.01 KY1.251.23**–0.09**–0.05*0.01 SSCI0.490.69*0–0.08**0 GS0.660.30–0.05–0.06**0 h-index0.52**–0.04–0.04**–0.04**–0.00 Works0.290.06–0.01–0.020.03**
 men are the most successful Research universities promote successful research The younger Ph. D. the more productive researcher Fast track professors are more successful Sex Research university Age at Ph.D. Time to become professor Years as professor KMS1.83**1.72**–0.08*– IF **–0.05*–0.04**0.01 KY **–0.09**–0.05*0.01 SSCI *0–0.08**0 GS –0.05–0.06**0 h-index0.52**–0.04–0.04**–0.04**–0.00 Works –0.01– **.")
26
Conclusions Globalization and specialization increase the need for comparing research performance No single measure captures all relevant dimensions All measures contain problems: Sample selection (KMS, SSCI-journals), Data quality (SSCI, GS), Construction (iterative procedure) The measure that has dominated European economics (KMS) gives highly skewed distribution among Swedish scholars (lower half receives insignificant values) KMS weakest corr. with the other measures and weaker corr. with citations measures than KY and IF Substantial variation of top-ranked individuals across measures

Similar presentations


 is one of three central tools (the others being ISI and Scopus) used to generate bibliometrics for researchers.>")


>")


 A large number of the records are enhanced with.>")


