Download presentation
Presentation is loading. Please wait.

2
Sediment – Causes & Prevention Improving Water Quality- Well Rehab & Downhole Camera Applications Michael L. Vaught, PG Hydrogeologist Certified Well Contractor EGIS Downhole Video, & Well Repairs 441 Northside Drive Chapel Hill, NC 27516 Phone: 919-929-8363 Fax: 419-858-9118 Fax: 419-858-9118 Email: gwinvest@juno.com

3
Introduction n This presentation shows examples of using downhole equipment to limit microbial contaminants and achieve the highest quality water from supply wells.

4
Rock Type n Hard to crystalline rock and granular type aquifer systems. n Sedimentary, Metamorphic, and Igneous rocks. n Reference the Ground Water Atlas of the United States and the Geological Surveys Maps.

5
Well Construction n Geographic or Physiographic location –Coastal Plain –Piedmont –Mountains n Type of Well –large or small diameter –shallow or deep –cased or “open hole”

6
Poor Water Quality Poor Water Quality n Near surface - Rapid Infiltration n Biofouling (iron, mineral, slime growth) n Faulty well construction n Geologic strata and formation n Natural or manmade disturbances
 n Faulty well construction n Geologic strata and formation n Natural or manmade disturbances")
7
Analysis of Problem n Well Records n Borehole Camera Survey –passive well inspection –active well investigation –identify source of well problem –verify results

8
Slim-line downhole camera

10
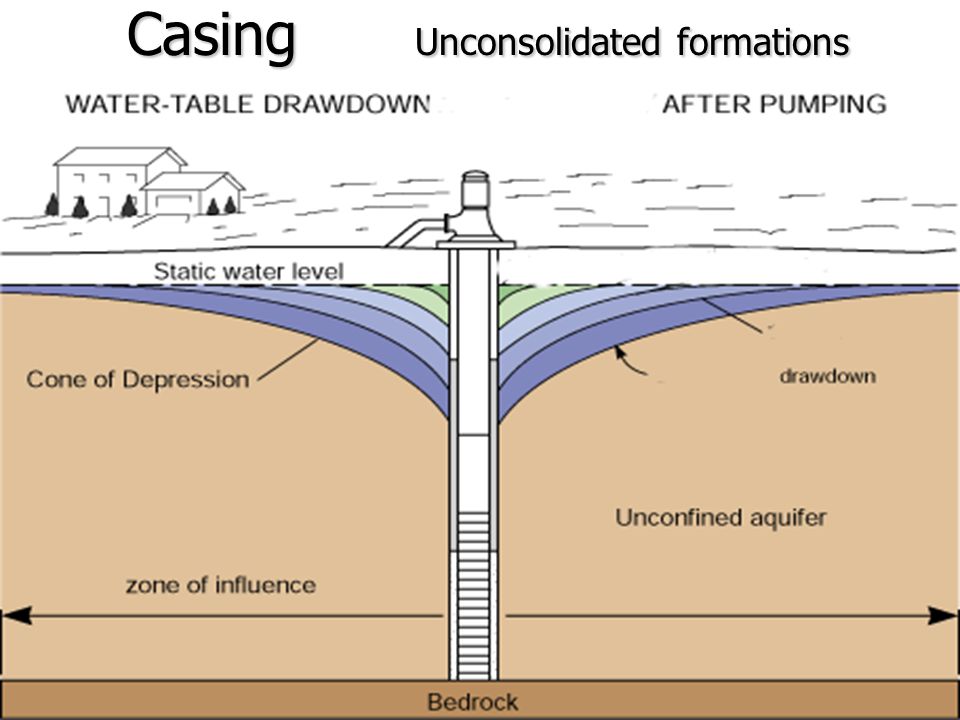
Casing Unconsolidated formations n 100GPM Withdrawal n 15’ n Static WL n 45’ n Pumping WL n 100gpm / (45-15)ft n = specific capacity of n 3.3 gpm/ft of drawdown n Specific Capacity of a newer well n 65 GPM Withdrawal n 15’ n Static WL n 65’ n Pumping WL n 65gpm / (65-15)ft n = specific capacity of n 1.3 gpm/ft of drawdown n Specific Capacity after 15 years
ft n = specific capacity of n 3.3 gpm/ft of drawdown n Specific Capacity of a newer well n 65 GPM Withdrawal n 15’ n Static WL n 65’ n Pumping WL n 65gpm / (65-15)ft n = specific capacity of n 1.3 gpm/ft of drawdown n Specific Capacity after 15 years")
11
n Unconsolidated formations n Confined Aquifer

13
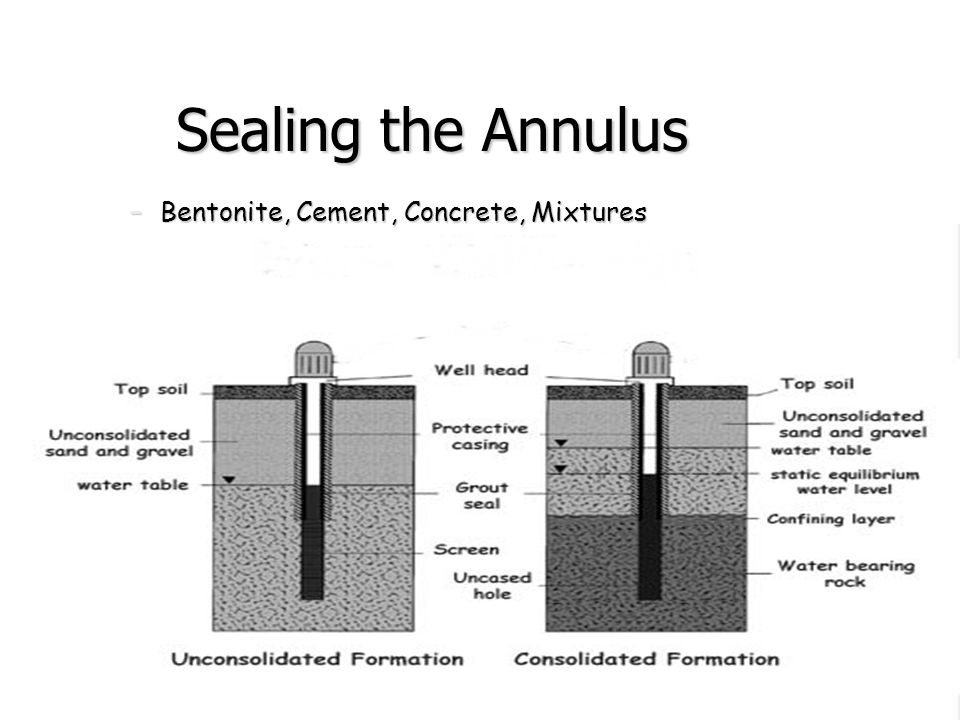
Sealing the Annulus –Bentonite, Cement, Concrete, Mixtures

14
Casing n Consolidated formations

17
Reasons For Contaminated Water n Distribution system n Well configuration n Shallow rapid infiltration n Poor well head protection n Surface water influence

18
Microbial Contamination Sources n Shallow rapid infiltration n Nutrient rich water n Biofouling within the well n Distribution system backflow

19
Well Maintenance n Exercise (water usage) n Chlorination –200 ppm n Record keeping n Testing for Bacteria –Chlorination not recommended for coliform
 n Chlorination –200 ppm n Record keeping n Testing for Bacteria –Chlorination not recommended for coliform")
20
Well Maintenance n Landscape so surface water drains away from the wellhead

21
Test Yield Specific Capacity n 100GPM Withdrawal n 15’ n Static WL n 45’ n Pumping WL n 100gpm / (45-15)ft n = specific capacity of n 3.3 gpm/ft of drawdown n Specific Capacity of a newer well n 65 GPM Withdrawal n 15’ n Static WL n 65’ n Pumping WL n 65gpm / (65-15)ft n = specific capacity of n 1.3 gpm/ft of drawdown n Specific Capacity after 15 years
ft n = specific capacity of n 3.3 gpm/ft of drawdown n Specific Capacity of a newer well n 65 GPM Withdrawal n 15’ n Static WL n 65’ n Pumping WL n 65gpm / (65-15)ft n = specific capacity of n 1.3 gpm/ft of drawdown n Specific Capacity after 15 years")
22
Well Characterization n Construction method n Water levels n Casing amount n Well depth n Pump location n Pumping rates

23
Well Characterization n Water bearing fractures n Cascading water zone n Geological structure n Surface infiltration n Circulation cell size n Dead or non-circulating zones

24
Downhole Video & Pumping n Observe All Three Stages –Static rest. –Pumping stress. –Recharge. n Characterize well –Construction (leaky casing?) –Borehole stability –Water zones
 –Borehole stability –Water zones.")
25
Video Clips n Geology n Biofouling n Oxygen Enrichment n Pumping Effect

26
Repairs/Rehab n Cleaning, flow sleeves, recirculation –Biofouling –Mud and Sand –Eliminate dead zones. –Prevent concentration within the well. n Liners –Seal out shallow water veins. –Pathogenic Contaminates –Stabilize the well.

27
Minimize Storage and Enlarge Flow Cells n Excess storage generates uncontrolled growth of naturally occurring biofilms n Enrichment of excess or retained storage accelerates biofouling from the top down n Set the pumping depth in a well – based on actual maximum demand – generate 3/4 drawdown or to the water vein

28
Well Storage n Stored water lies –above the intake –above the highest water zone n Well storage is the zone of a water column within or draining to the bore-hole –above the pump –above the most shallow production zone –called the Storage Cell n Water level in a storage type well falls continuously during the stress test

29
Wellhead Protection

30
–WHPA Delineation Methods n Arbitrary fixed or calculated fixed radius method

31
References n Anderson, K.E. (1998) Ground Water Handbook, National Ground Water Association n Driscoll, F.G. (1986) Ground Water and Wells, Second Edition, Jonhson Screens n Smith, S. A., Borch, M. A., and Noble, L. N. (1993) Evaluation and Restoration of Water Supply Wells, AWWA Research Foundation n Waller, R.M. (1994) Ground Water and the Rural Homeowner, U.S. Geological Survey
 Ground Water Handbook, National Ground Water Association n Driscoll, F.G. (1986) Ground Water and Wells, Second Edition, Jonhson Screens n Smith, S. A., Borch, M. A., and Noble, L. N. (1993) Evaluation and Restoration of Water Supply Wells, AWWA Research Foundation n Waller, R.M. (1994) Ground Water and the Rural Homeowner, U.S. Geological Survey.")
32
Presented by Mike Vaught Groundwater and Well Service. 441 Northside Drive, Chapel Hill, NC 27516 Telephone 919-929-8363 Fax 509-278-5724 Fax 509-278-5724

Similar presentations