Download presentation
Presentation is loading. Please wait.

1
Wind driven, Coriolis modified Ekman and geostrophic flow
Surface circulation Wind driven, Coriolis modified Ekman and geostrophic flow

2
Surface currents - patterns
Similar in all basins At low latitudes, have large, “closed” gyres Gyres elongated in the E-W direction Gyres centered on the subtropics (~30oN or S) West-directed flow at N and S equatorial currents East-directed flow ~ 45oN and S N-S directed flow at eastern and western boundary currents
 West-directed flow at N and S equatorial currents. East-directed flow ~ 45oN and S. N-S directed flow at eastern and western boundary currents.")
3
Surface currents - patterns
West-directed flow driven by tradewinds (coming from N or S-east East-moving equatorial countercurrents Western boundary currents are distinct, narrow (< 100km), swift (>100 km/day) and deep (2 km) Eastern boundary currents are broad (>1000 km), weak (~10s km/day) and shallow (~500 m) Have smaller, less developed polar gyres in N Have circumpolar “gyre” in the S
, swift (>100 km/day) and deep (2 km) Eastern boundary currents are broad (>1000 km), weak (~10s km/day) and shallow (~500 m) Have smaller, less developed polar gyres in N. Have circumpolar gyre in the S.")
4
Transverse currents E-W currents driven by the trade winds (easterlies) and mid-latitude westerlies Link the boundary currents Equatorial currents Moderately shallow and broad Pile up water on west side of basin (W Atl is 12 cm [8”] higher than Pac; W Pac is 1 m higher than E Pac) Eastward flowing currents at mid-latitudes are weaker (wider and slower) than equatorial currents Differences in land mass distribution in N and S hemispheres affects flow
 Eastward flowing currents at mid-latitudes are weaker (wider and slower) than equatorial currents. Differences in land mass distribution in N and S hemispheres affects flow.")
5
Why is this important? Processes in surface, wind-driven layers
Change in productivity rates affects atm CO2? Assume these fluxes are balanced Change in burial rates affects atm CO2? Why is this important? Processes in surface, wind-driven layers are different but connected to processes in deep waters. Fig. 8-9

6
(inorganic/tectonic)
Short-term Long term (organic) Long term (inorganic/tectonic)
 Long term. (inorganic/tectonic)")
7
Link with short term C cycle
In surface oceans “adds” back CO2 Onset of modern plate tectonics “turns this on”

8
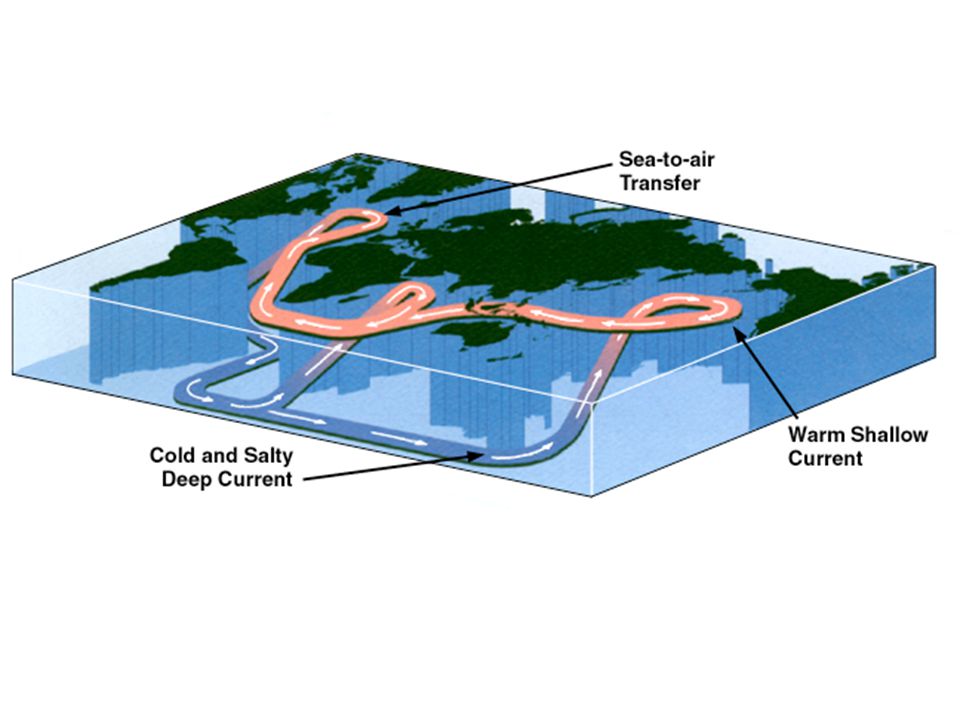
Thermohaline Circulation

9
Thermohaline circulation
Vertical water movement Driven by density differences (can be very small) Remember temperature and salinity diagrams and the properties of water Temperature and salinity profiles (with depth) Salty water is denser than fresh water Cold water is denser than warm water Density gradients with latitude (due to temperature differences of surface waters) Polar water has the most uniform density (weakest pycnocline) so is least stable
 Remember temperature and salinity diagrams and the properties of water. Temperature and salinity profiles (with depth) Salty water is denser than fresh water. Cold water is denser than warm water. Density gradients with latitude (due to temperature differences of surface waters) Polar water has the most uniform density (weakest pycnocline) so is least stable.")
10
Fig. 5-6

11
Polar water column is least stable; most uniform density weakest pycnocline Surface is cold Deep water is cold everywhere Easiest to rearrange Formation of ice excludes salt Seawater freezes at –2oC

12
Warming Cycle: 1. March 2. May 3. June 4. August Cooling Cycle: 1. August 2. September 3. October 4. November 5. January

13
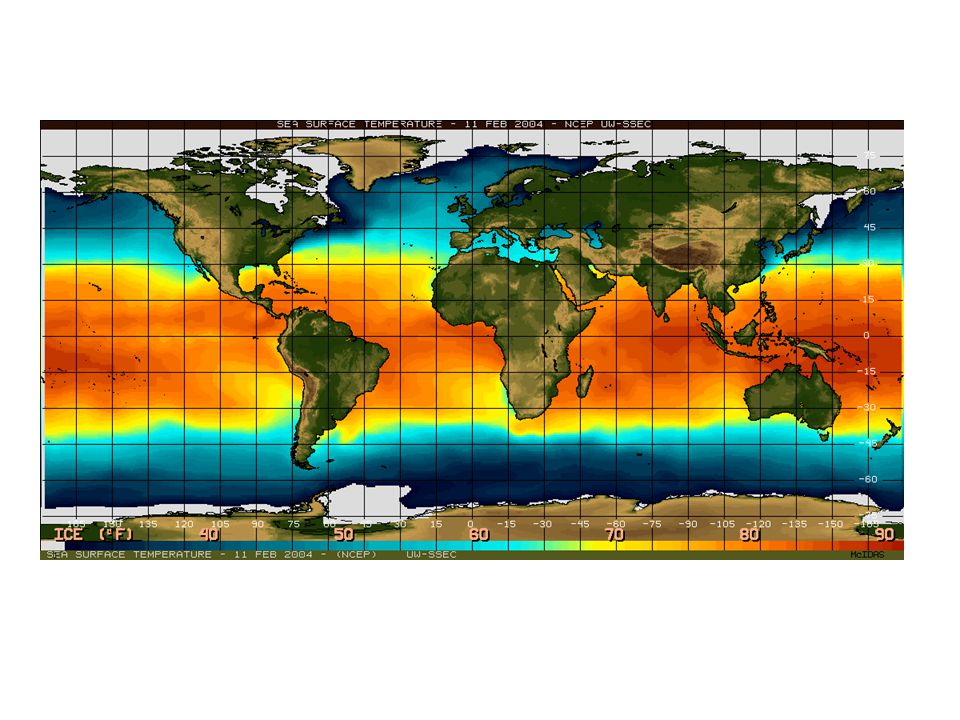
Temp. sea water

16
Wind

17
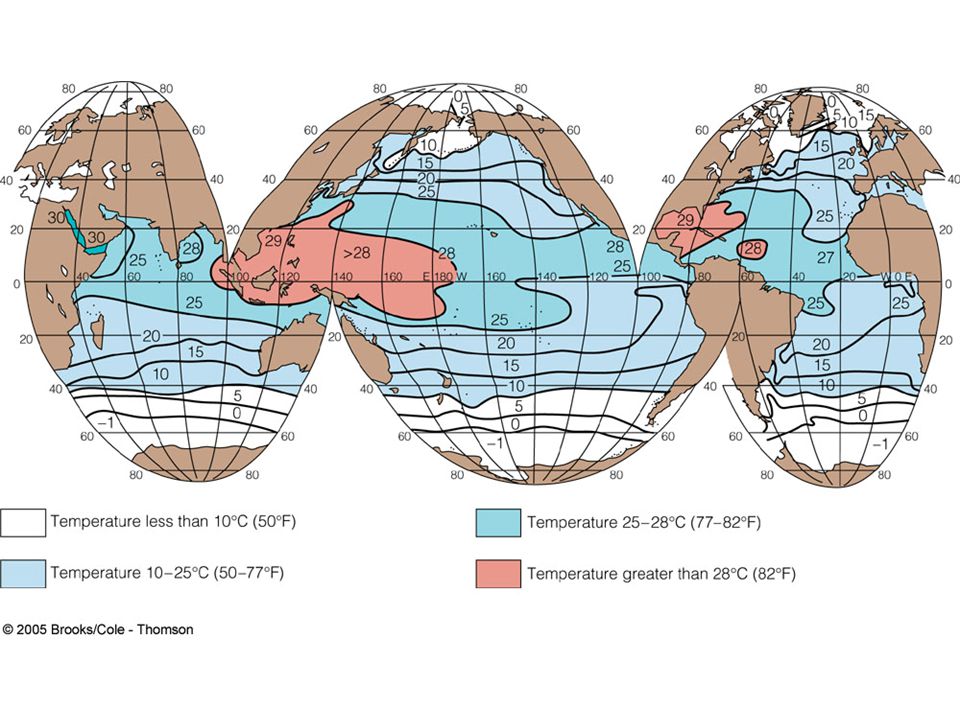
Most of the ocean is cold
Temperature degree C

20
Thermohaline circulation
As for the atmosphere, there are convergence and divergence zones where water masses collide or diverge Important for global heat balance Deep circulation and basin exchange of water, material, and heat

21
Thermohaline circulation
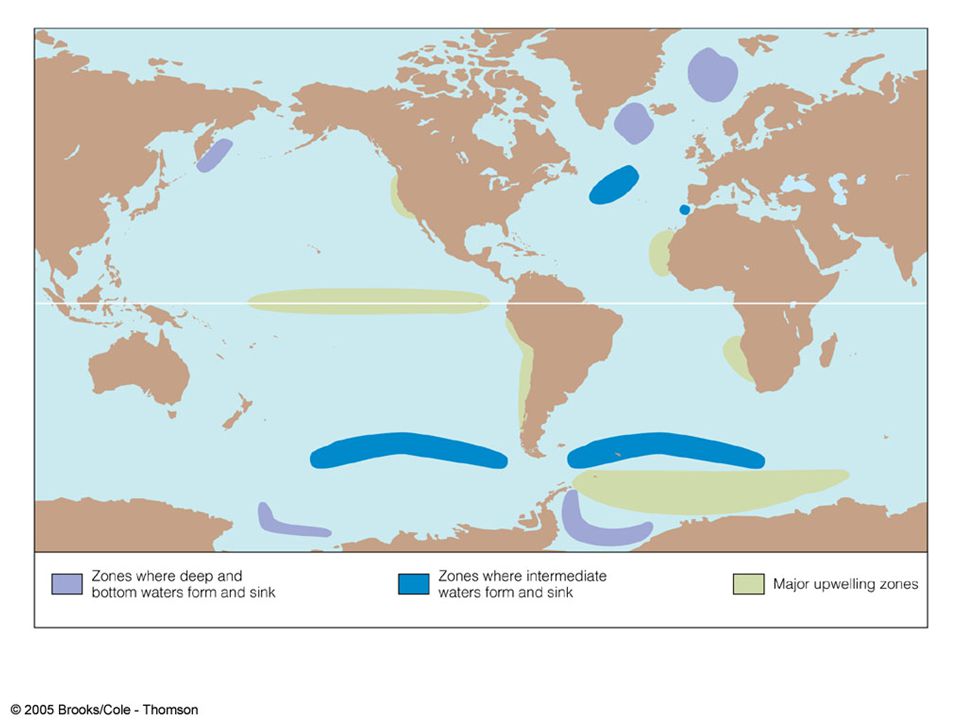
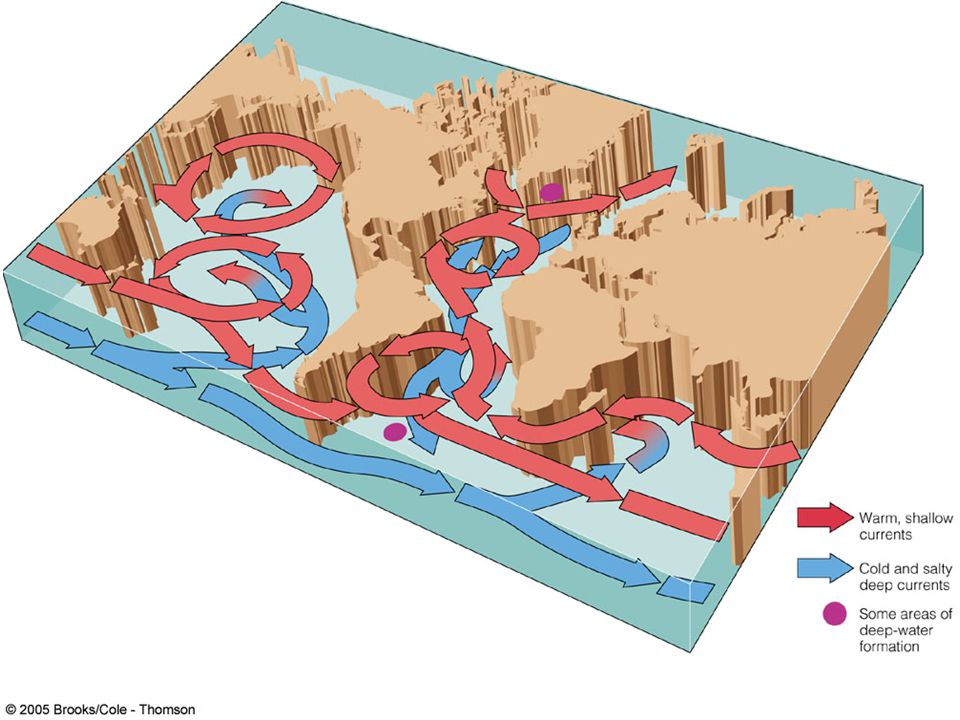
Deep circulation is driven by density differences Horizontal movement along density surfaces Movement is very slow (0.1 m/s) Three layer ocean surface mixed layer Pycnocline Deep water Deep water formed at 2 places – N Atlantic and Weddell Sea (Antarctica) Connection between surface and deep water Diffusion (slow and along density gradients) Mixing (e.g., storms) Upwelling (polar, equatorial and coastal)
 Three layer ocean. surface mixed layer. Pycnocline. Deep water. Deep water formed at 2 places – N Atlantic and Weddell Sea (Antarctica) Connection between surface and deep water. Diffusion (slow and along density gradients) Mixing (e.g., storms) Upwelling (polar, equatorial and coastal)")
22
Deep circulation is like a conveyer belt that moves heat and water

23
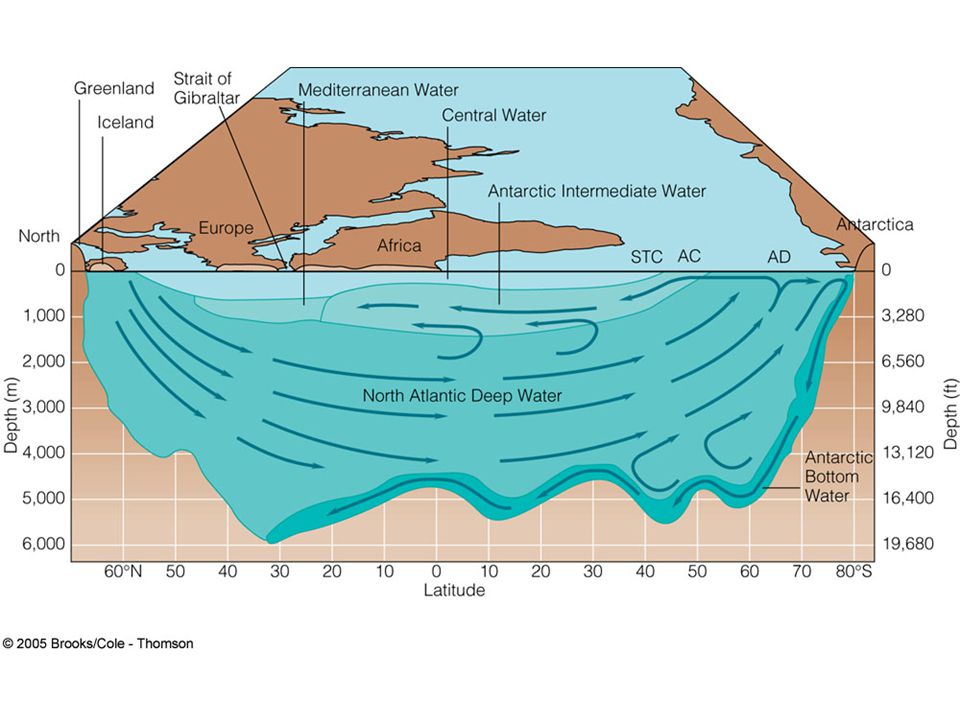
Water masses Possess identifiable properties
Don’t mix easily – flow above or beneath each other Surface water – to about 200 m Central water – to bottom of main thermocline Intermediate water – to about 1500 m Deep water – to about 4000 m (not the bottom) Bottom water – in contact with seafloor Retain characteristics when the mass was formed at the surface (heating/cooling, evaporation/dilution)
 Bottom water – in contact with seafloor. Retain characteristics when the mass was formed at the surface (heating/cooling, evaporation/dilution)")
24
Formation of deep water
Antarctic bottom water – densest water in the ocean – S (34.65%o), T (-0.5oC), dens (1.0279) Weddell Sea in winter – when ice freezes and get brines Sinks and creeps North Pacific and Atlantic – 100’s to 1000’s of years to get to northern basin North Atlantic deep water Formed in the Arctic but escapes only through channels Warm, salty water chills (heat is transferred to air) Atlantic and Pacific deep water is less dense than Antarctic bottom water
, T (-0.5oC), dens (1.0279) Weddell Sea in winter – when ice freezes and get brines. Sinks and creeps North. Pacific and Atlantic – 100’s to 1000’s of years to get to northern basin. North Atlantic deep water. Formed in the Arctic but escapes only through channels. Warm, salty water chills (heat is transferred to air) Atlantic and Pacific deep water is less dense than Antarctic bottom water.")
26
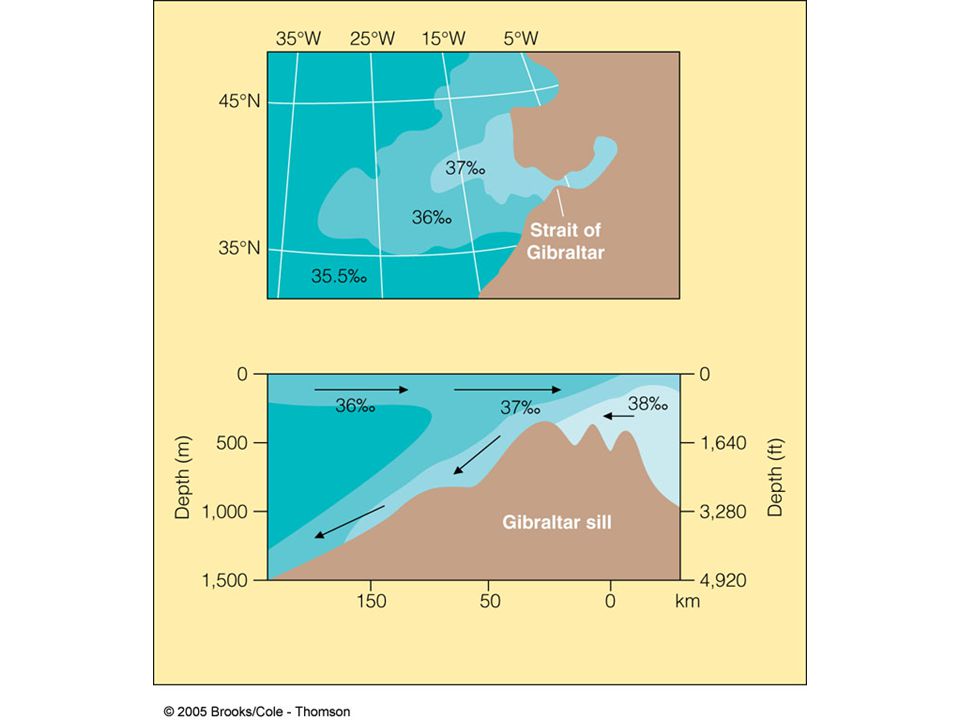
Mediterranean deep water
Salty water (38 %o) Underlies central water mass in Atlantic Warmer than other deep water so not as dense
 Underlies central water mass in Atlantic. Warmer than other deep water so not as dense.")
28
Isopycnal is a line of constant density
Different combinations of temp and salinity can make water of the same density Isopycnal is a line of constant density Mixing of water masses can increase the density Increasing density

31
Age of a water mass Oxygen and C isotopes
Water picks up oxygen and CO2 only at surface by exchange with atmosphere Loses oxygen as it ages (respiration, reaction with rocks); 14C decays as it ages Water masses mix slowly Antarctic bottom water in the Pacific retains its character for up to 1600 years
; 14C decays as it ages. Water masses mix slowly. Antarctic bottom water in the Pacific retains its character for up to 1600 years.")
32
Fig. 8-11

33
-70‰ -110‰ -150‰ -170‰ -230‰ -210‰ ∆14C This diagram represents the flow at a depth of 4000 m; the strange-looking continent/ocean configuration is what we would obtain if the oceans were drained to this depth. (After W.S. Broecker and T.-S. Peng, Tracers in the Sea, New York: Eldigio Press, 1982, Figure 1-12.)
")
34
Water residence time Bottom currents are slow
Antarctic bottom water ~1600 years Other bottom water – years (time it takes to rise to the surface) Fast bottom currents on bottom around objects Surface currents are faster Surface water – on the order of years N Atlantic gyre may take about 1 year to complete a circuit
 Fast bottom currents on bottom around objects. Surface currents are faster. Surface water – on the order of years. N Atlantic gyre may take about 1 year to complete a circuit.")
35
Deep water circulation
Flow may be slow but still modified by Coriolis

36
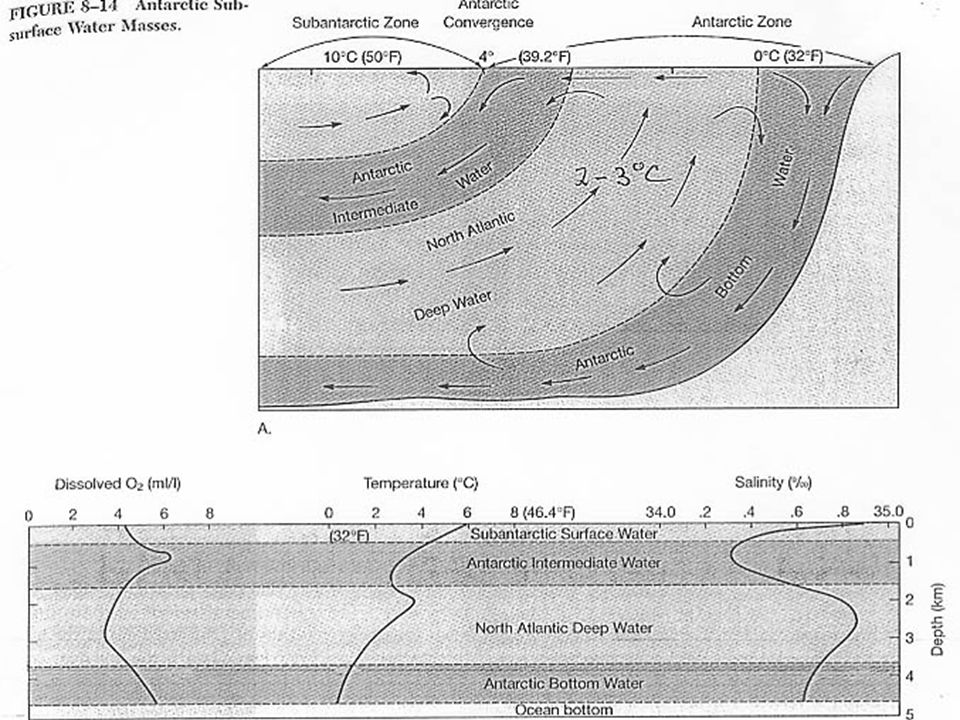
Convergence zones Two water masses meet
Usually one will go under the other (density) If the same density, may mix to create a new and denser water mass (remember T-S diagram) – this is caballing Formation of N Atlantic intermediate water, Antarctic intermediate water and Antarctic bottom water produced by mixing
 If the same density, may mix to create a new and denser water mass (remember T-S diagram) – this is caballing. Formation of N Atlantic intermediate water, Antarctic intermediate water and Antarctic bottom water produced by mixing.")
37
S-curve tracks density
with depth Points a and b on an Isopycnal so are the same density, despite different temperatures and salinities If the two water masses mix, will result in denser water!

38
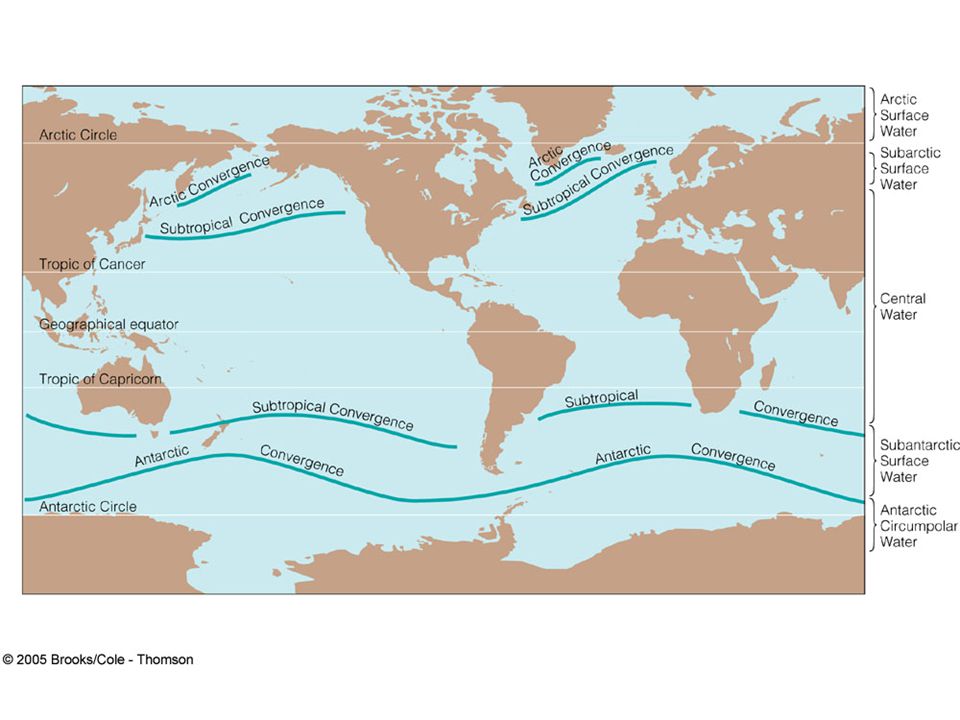
Convergence zones Areas of downwelling
Antarctic convergence zone at 50-60oS South of this is the Antarctic Circumpolar Current Subtropical convergence zone (40-50oS) N boundary of Subantarctic Surface Water Equatorward of subtropical convergence zone is Central Water which is the warmest and saltiest water Subtropical convergence (45-60oN) Arctic convergence – ill-defined because of land mass in the N
 N boundary of Subantarctic Surface Water. Equatorward of subtropical convergence zone is Central Water which is the warmest and saltiest water. Subtropical convergence (45-60oN) Arctic convergence – ill-defined because of land mass in the N.")
40
Divergence zones Areas of upwelling Tropical divergence
Antarctic divergence

41
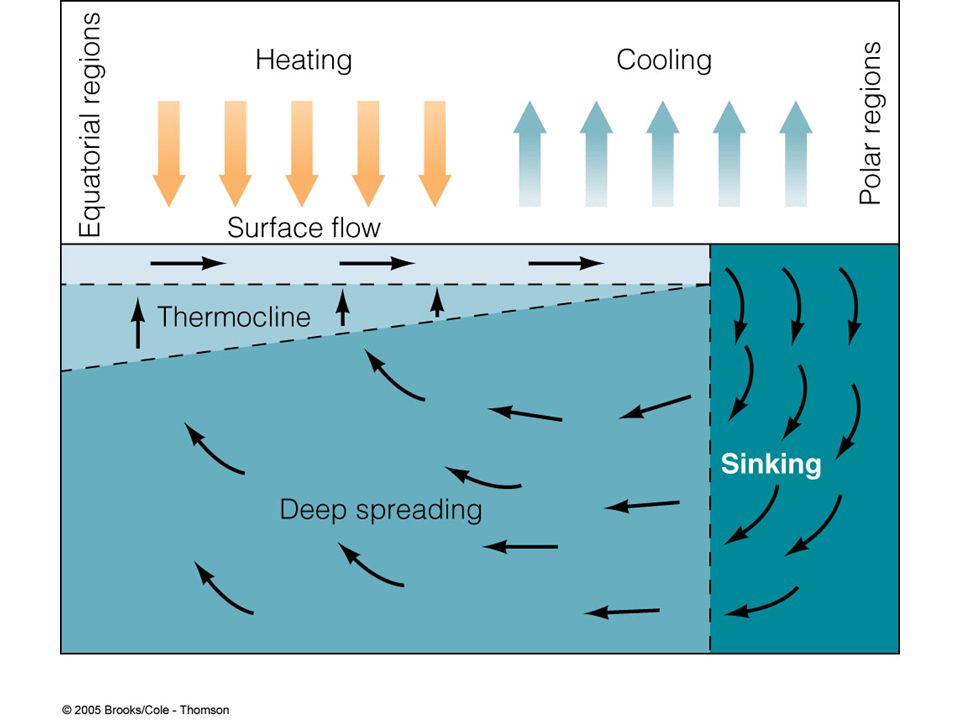
Upwelling Sinking water must be offset by upwelling of water
Water sinks in a localized area, relatively rapidly Water rises gradually over larger areas When water moves to surface, must be transported to a pole to sink again Diffuse upwelling maintains a permanent thermocline (1 cm/d)
")
42
Maintained by diffuse upwelling

44
Main thermocline

45
Thermohaline flow Sinking of surface water most pronounced in the North Atlantic Water moves at great depths toward Southern hemisphere and wells up into the surface in the Indian and Pacific Oceans (~1000 years) Slow circulation that crosses hemispheres superimposed on rapid flow of surface water in gyres Some heat travels from S Pacific, across Indian Ocean and into the Atlantic Flow distributes gases, solids, nutrients and organisms among ocean basins
 Slow circulation that crosses hemispheres superimposed on rapid flow of surface water in gyres. Some heat travels from S Pacific, across Indian Ocean and into the Atlantic. Flow distributes gases, solids, nutrients and organisms among ocean basins.")
46
Fig. 5-12

49
Fig. 8-9

50
The Redfield Equation 106 CO2 + 16 NO3- + HPO42- + 122 H2O
(CH2O)106(NH3)16(H3PO4) O2 Can also develop similar ratios for trace elements required for growth (e.g., Fe, Mn, Zn, etc.)
106(NH3)16(H3PO4) O2. Can also develop similar ratios for trace elements required for growth (e.g., Fe, Mn, Zn, etc.)")
51
Box Fig. 8-1

52
Shallow upper mixed layer
and main thermocline Uptake by phytoplankton Short residence times Regeneration during particle sinking Ocean circulation and/or vertical mixing Long residence times Thermohaline circulation

53
O2 decreases, nutrients increase as deep water is transported/ages
Norwegian Sea POM POM POM POM Atlantic Indian Pacific Nutrient regeneration and O2 consumption O2 decreases, nutrients increase as deep water is transported/ages

54
supersat’d. undersat’d.

55
plus nutrients fixed into the organic matter
and pCO2

56
Coastal Upwelling Major upwelling zones

57
Wind-induced upwelling
Note that transport goes to the right in the N Hemisphere

58
Seasonal upwelling due to seasonally reversing monsoonal winds

59
Seasonal upwelling Summer
Wind direction resulting from differential pressure over sea and land superimposed on a SeaWiFS chlorophyll image for the southwest monsoon. High chlorophyll concentrations in the western Arabian Sea are due to coastal upwelling Winter Schematic showing snow cover extent and wind direction superimposed on a SeaWiFS chlorophyll image for the northwest monsoon season. High chlorophyll concentrations are due to nutrients inputs from of winter convective mixing (see animation at

60
Equatorial upwelling Equator SE trades

62
Net burial of CH2O in sediments
CO2 from the atmosphere O2 to the atmosphere Brings nutrients back for production (100 %) (> 99%) Net burial of CH2O in sediments (< 1%) Fig. 8-9
 (> 99%) Net burial of CH2O in sediments. (< 1%) Fig")
63
For example phosphorus
The Oceanic P Cycle (all fluxes are 1010 mole P/yr) River input Surface Ocean [PO4]avg = 0.15 µM For example phosphorus in the whole ocean 35 187.5 Downwelling Particle flux Ocean volume Ocean P concentration 7.5 215 Upwelling Whole Ocean [PO4]avg = 2.05 µM Input = output Deep Ocean [PO4]avg = 2.2 µM Burial in sediments 35
 River input. Surface Ocean. [PO4]avg = 0.15 µM. For example phosphorus. in the whole ocean Downwelling. Particle flux. Ocean. volume. Ocean. P concentration Upwelling. Whole Ocean. [PO4]avg = 2.05 µM. Input = output. Deep Ocean. [PO4]avg = 2.2 µM. Burial in. sediments. 35.")
64
The Oceanic P Cycle (all fluxes are 1010 mole P/yr)
River input Very different in its component parts Surface Ocean [PO4]avg = 0.15 µM 35 187.5 Downwelling Particle flux 7.5 215 Upwelling Deep Ocean [PO4]avg = 2.2 µM Burial in sediments Whole Ocean [PO4]avg = 2.05 µM 35

65
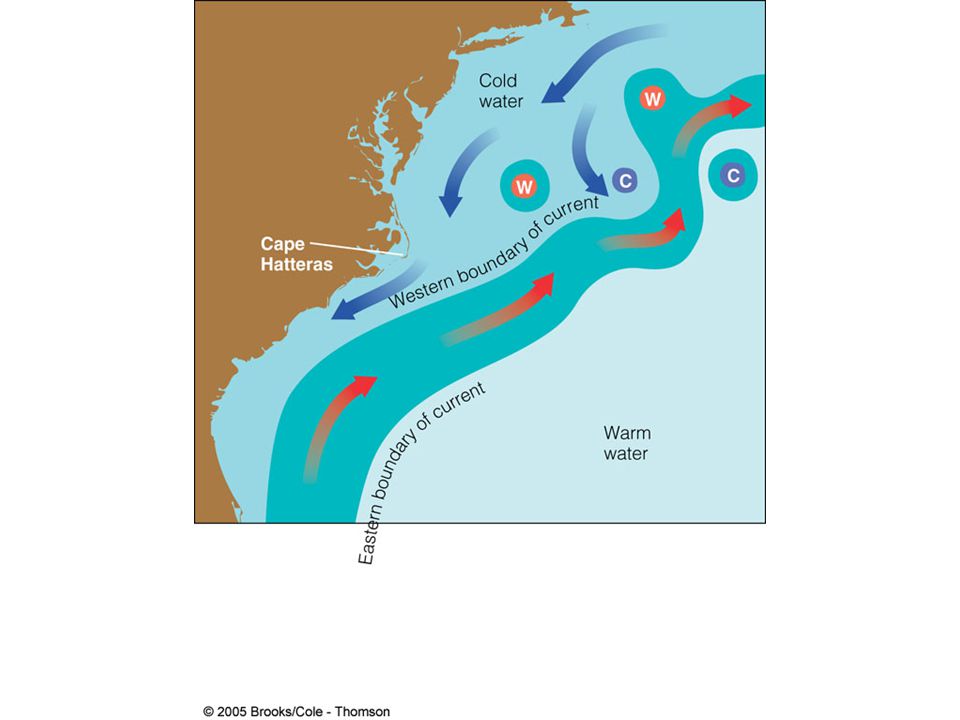
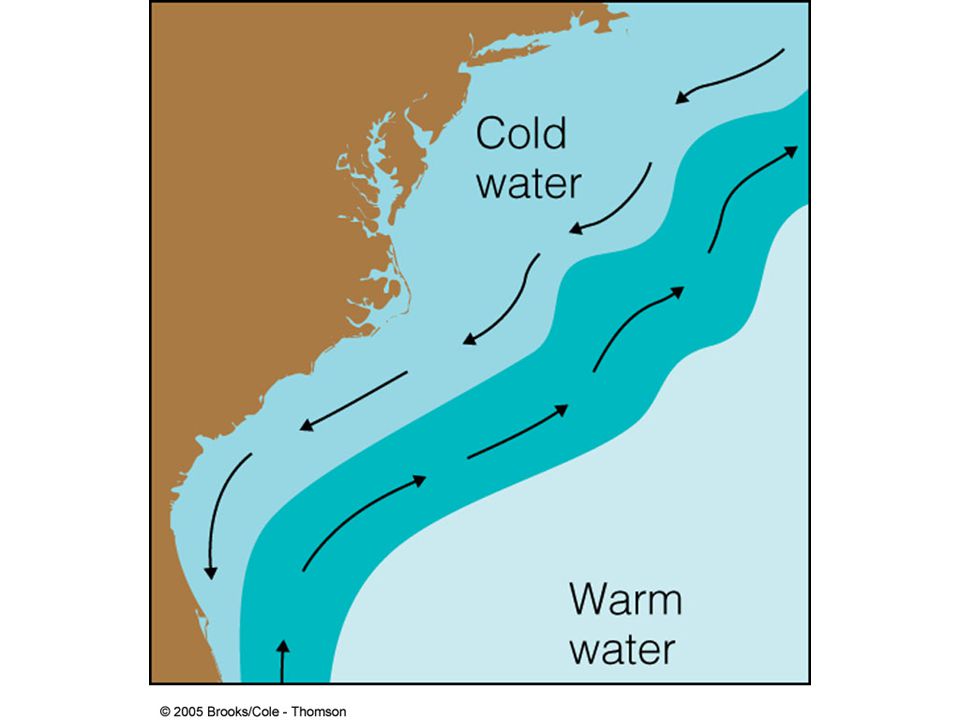
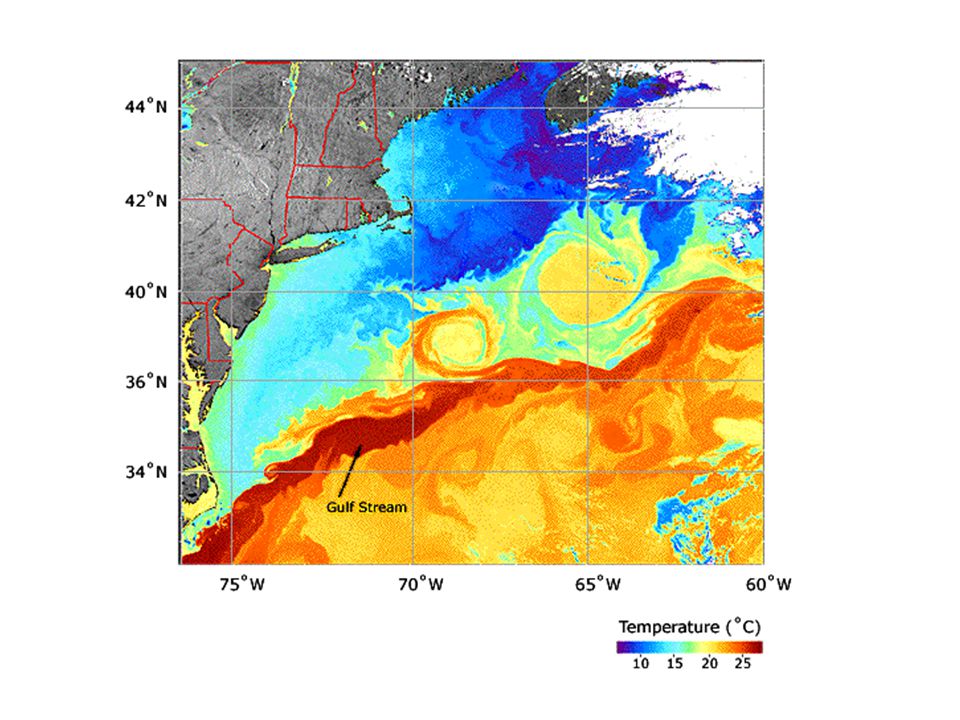
Meanders and eddies Currents are water so, lack well-defined edges so have friction with adjacent boundaries Meanders as it flows poleward Sometimes get rings (warm and cold core) pinched off Warm-core eddies rotate CW (in the N hemisphere) Cold-core eddies rotate CCW (in the N hemisphere) Can be 1000 km in diameter and persist for years, effects may be felt to the bottom and may be important for mixing up deep water (& nutrients)
 pinched off. Warm-core eddies rotate CW (in the N hemisphere) Cold-core eddies rotate CCW (in the N hemisphere) Can be 1000 km in diameter and persist for years, effects may be felt to the bottom and may be important for mixing up deep water (& nutrients)")
66
Colder productive water
Warm, clear water

67
Eddies Meanders pinch off Trap warm or cold water at their center
Cold-core eddies in the Gulf Stream Warm-core eddies N of the Gulf Stream Cold-core eddies very nutrient rich and productive

72
Warm-core ring Cold-core ring

73
Kuroshio eddies in natural color! Green is phytoplankton

74
Retain momentum of current
Formation of Rings Retain momentum of current Warm-core rings spin CW (N hemisphere) Cold-core rings spin CCW (N hemisphere
 Cold-core rings spin CCW (N hemisphere.")
76
Rings can penetrate to great depth To the seafloor?
Cold ring has low pressure “upwelling” in the center (Coriolis deflection to the right in N hemisphere) while warm ring has high pressure downwelling in the center (same reason).
 while warm ring has high pressure downwelling in the center (same reason).")
77
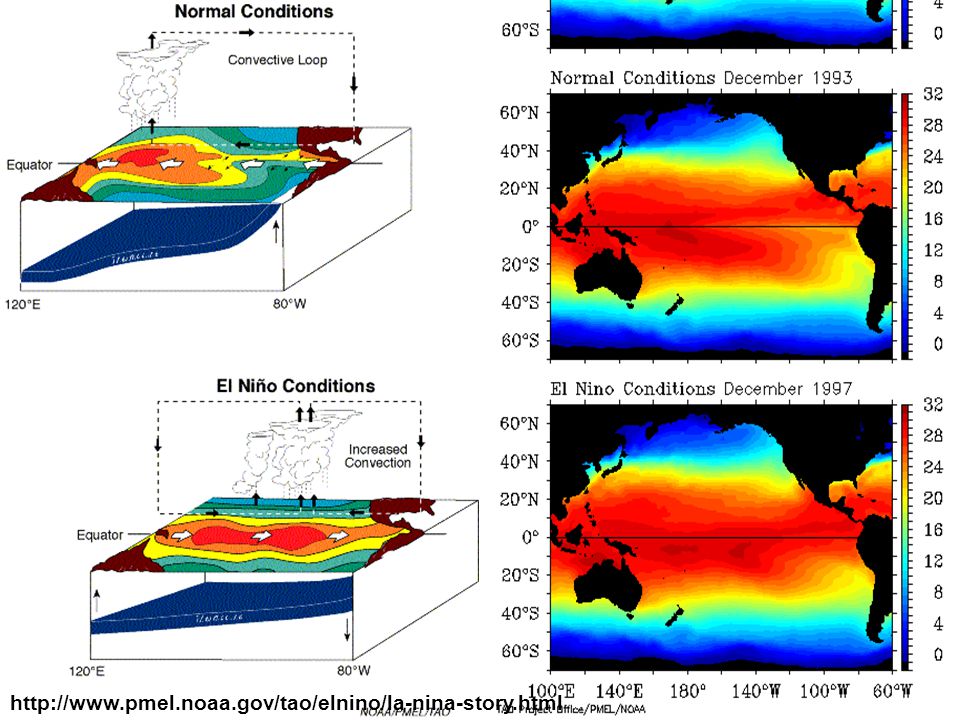
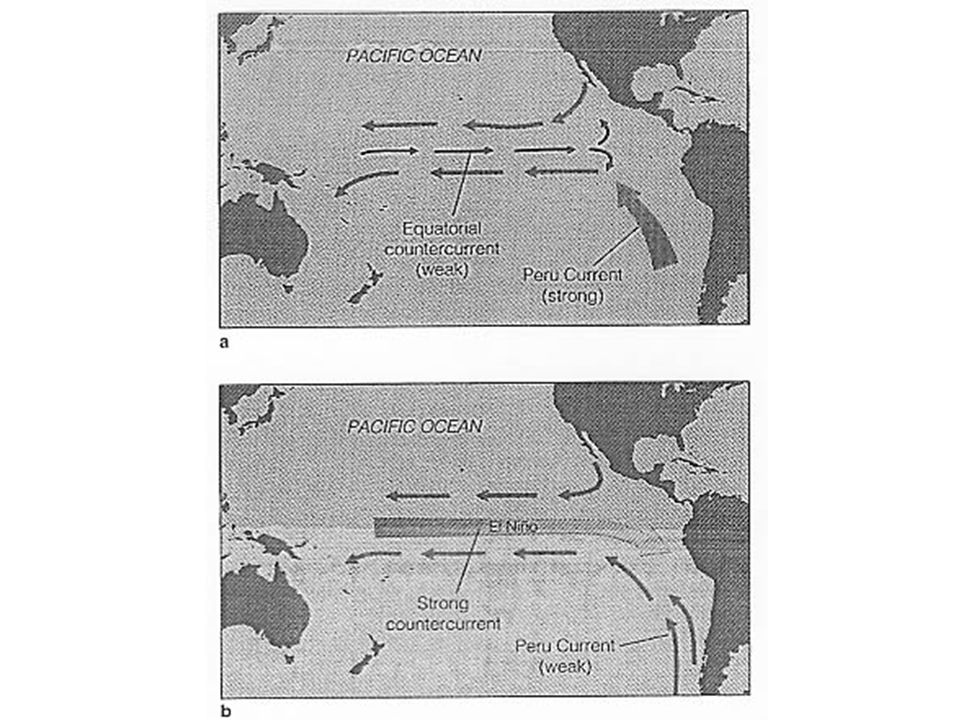
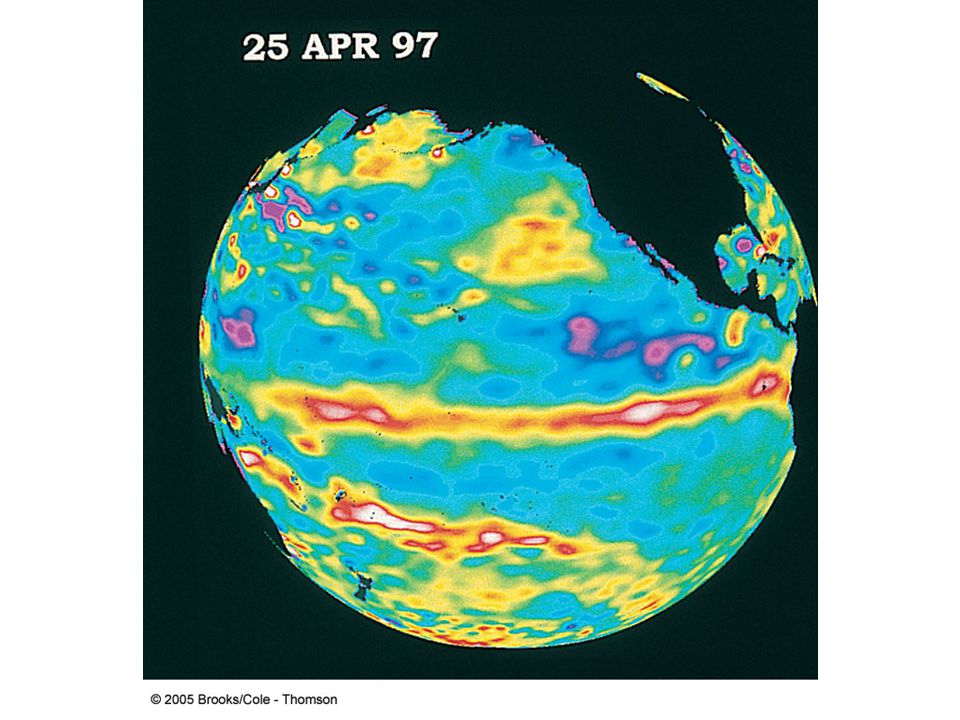
El Niño/La Niña Normally get surface winds across the tropical Pacific moving East to West (easterlies or trade winds) High pressure over eastern Pacific and Low pressure over western Pacific maintains this pattern But, these pressure systems reverse or collapse with some periodicity (every 3-8 years) Winds reverse and trade winds weaken or collapse Change in atmospheric pressure is Southern Oscillation Serious effects on productivity
 Winds reverse and trade winds weaken or collapse. Change in atmospheric pressure is Southern Oscillation. Serious effects on productivity.")
78
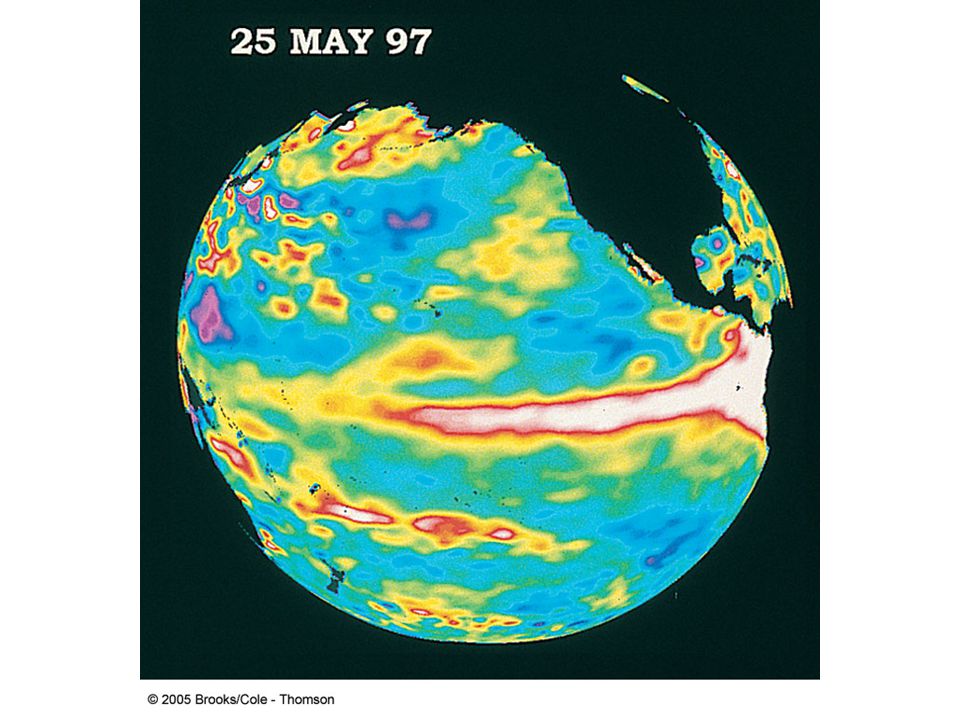
El Niño/La Niña Wind-driven equatorial currents weaken or collapse
Warm water “sloshes” or flows eastward Get east-flowing warm water around Christmas-time and this is El Niño Combine terms and get El Niño Southern Oscillation (ENSO)
")
79
El Niño El Niños occurred in the E Pac during , , 1993, 1994 and , Vary in strength

80
Normal air pressure

81
Normal SST with Upwelling

82
Storms over land increase (CA)
Deeper thermocline Failed upwelling or downwelling

83
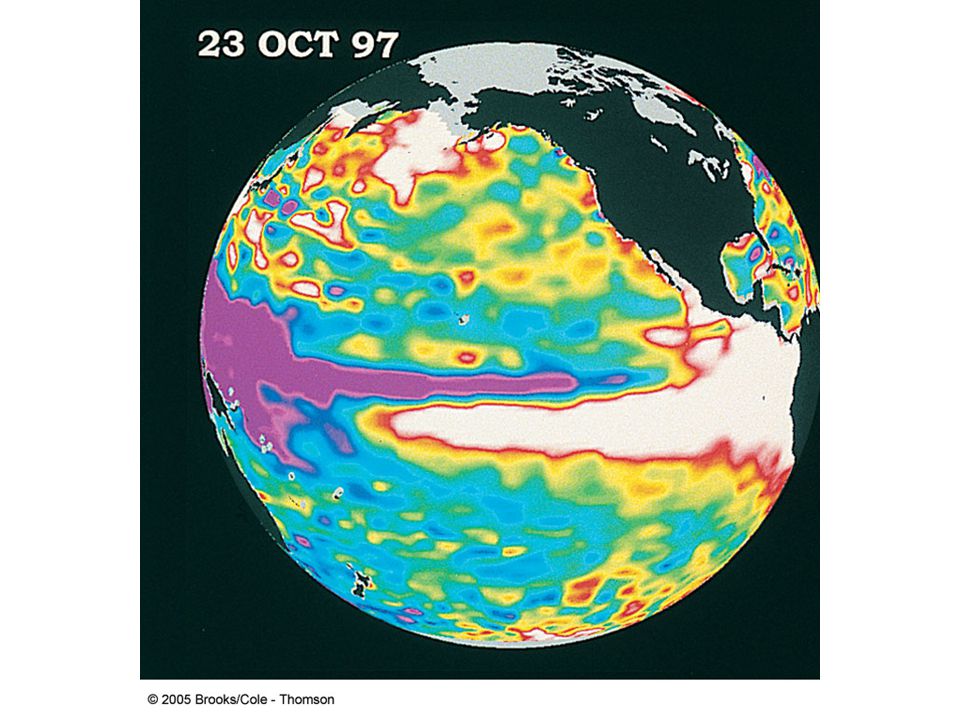
El Niño SST with warm current and little or no upwelling

86
Normal Warm pool

91
Effects on productivity

92
ENSO events Thermocline deepens in the Eastern Pacific (EP)
Productivity decreases in EP Sea level rises in EP Increases rain and storms on adjacent land Milder temps on west coast? This year’s CA storms?

93
La Niña Not always right after an El Niño even
Colder-than-normal event Thermocline decreases from normal (more intense upwelling) Resumption and strengthening of trade winds Winter temps warmer in SE and cooler in NW Effects opposite of El Niño
 Resumption and strengthening of trade winds. Winter temps warmer in SE and cooler in NW. Effects opposite of El Niño.")
94
North Atlantic Oscillation
Seesaw of atmospheric mass between subtropical high and polar low Dominant mode of winter climate variability in the North Atlantic Positive NAO index is stronger than usual subtropical high and deeper than normal Icelandic Low – stronger than average westerlies at mid-latitudes Increased pressure difference results in Stronger winter storms crossing Atlantic More northerly track to storms Warm and wet European winter and cold and dry N Canada and Greenland winter Mild and wet winter in Eastern USA

Similar presentations


 Convection caused by intense surface.>")


>")
