Download presentation
Presentation is loading. Please wait.

1
Finance & Accounting Cornell University November 16 th, 2010

2
Today’s Team Chris Peterson – Vice President, F&A Global Health and Well Being Katie Kool – Associate Director, Investor Relations Andy Fitzpatrick – Group Manager, Global Business Services Finance Daniel Lentz- NA Oral Care Profit Forecaster

3
Agenda Company Overview Finance Overview Case Study Objectives Help you… Understand more about P&G Understand more about Corporate Finance Gain insight (via case study) on how F&A influences strategy & decisions Gain experience on how to think through a finance case
 on how F&A influences strategy & decisions Gain experience on how to think through a finance case")
4
P&G at a Glance

5
Company History Established 1837 Incorporated 1890 Headquarters in Cincinnati, Ohio, USA

6
Trusted, Valued, Recognized Brands

7
Global Sales North America Western Europe Asia Latin America Central & Eastern Europe, Middle East & Africa P&G sells products in over 180 countries with ground operations in over 80 countries.

8
2010 Financial Highlights FINANCIAL SUMMARY (UNAUDITED)
")
9
What We Believe In Our Vision Be and be recognized as, the best consumer products company in the world. Our Purpose We will provide branded products and services of superior quality and value that improve the lives of the world’s consumers, now and for generations to come. As a result, consumers will reward us with leadership sales, profit and value creation, allowing our people, our shareholders, and the communities in which we live and work to prosper. Our Values Integrity, Trust, Ownership, Leadership, Passion for Winning

11
External Recognition Rankings: #22 Fortune 500 (Fortune Magazine) #4 Most Profitable (Fortune Magazine) #6 World’s Most Admired (Fortune Magazine) #2 Best Companies for Leaders (Fortune Magazine) #3 World’s Most Respected (Barron’s) #13 World’s Most Sustainable (Global 100) #18 Best Companies for Diversity (Diversity Inc) Top 40 Company for Diversity (Black Enterprise Magazine) Top 50 Company for Executive Women (National Association of Female Executives) Top 100 Company for Working Mothers (Working Mother Magazine) Top 20 Company for Multicultural Women (Working Mother Magazine)
 #4 Most Profitable (Fortune Magazine) #6 World’s Most Admired (Fortune Magazine) #2 Best Companies for Leaders (Fortune Magazine) #3 World’s Most Respected (Barron’s) #13 World’s Most Sustainable (Global 100) #18 Best Companies for Diversity (Diversity Inc) Top 40 Company for Diversity (Black Enterprise Magazine) Top 50 Company for Executive Women (National Association of Female Executives) Top 100 Company for Working Mothers (Working Mother Magazine) Top 20 Company for Multicultural Women (Working Mother Magazine)")
12
P&G Finance & Accounting Mission To provide leadership to business decision- making, and sound, innovative planning to maximize long-term profits, cash flow and total return to shareholders. We are the fiduciary conscience of the company. F&A Key Focus Areas: Business Leadership Business Leadership Business Leadership Business Leadership Stewardship People & Org Development

13
P&G Organizational Structure Market Development Organization (MDO) MDO: Going to market as one company Beauty Care Health & Well Being Household Care GBU: Organizing around strategic business units CORPORATE FUNCTIONS GLOBAL BUSINESS SERVICES GBS: Provides business services to P&G’s employees and organizations CF: Leads corporate governance, strategy, financial planning and transfers best practices
 MDO: Going to market as one company Beauty Care Health & Well Being Household Care GBU: Organizing around strategic business units CORPORATE FUNCTIONS GLOBAL BUSINESS SERVICES GBS: Provides business services to P&G’s employees and organizations CF: Leads corporate governance, strategy, financial planning and transfers best practices")
14
Many roles based on P&G’s Organizational Structure: F&A Roles at P&G MDO (Mkt Development Org) Strategy & Business Planning Financial Analysis Sales Finance Customer Logistics Finance GBU (Global Business Unit) Strategy & Business Planning Product Supply, Plant Finance Financial Initiative Analysis R&D Finance GBS (Global Business Services) Financial Services & Solutions Business Information Business Planning CF (Corporate Functions) M&A, Ext Business Development Corporate Accounting Treasury Tax, Finance HR
 Strategy & Business Planning Financial Analysis Sales Finance Customer Logistics Finance GBU (Global Business Unit) Strategy & Business Planning Product Supply, Plant Finance Financial Initiative Analysis R&D Finance GBS (Global Business Services) Financial Services & Solutions Business Information Business Planning CF (Corporate Functions) M&A, Ext Business Development Corporate Accounting Treasury Tax, Finance HR")
15
Case Study

16
Branding Go-to- Market Consumer Understanding Innovation Scale Core Strengths

17
We Create Value With Innovation Innovation Investment 0 500 1000 1500 2000 2500 Spending versus competition P&G Unilever L'Oreal Henkel KC CP RB Clorox Avon Energizer Millions

18
Initiative NPV analysis P&G Finance & Accounting molds innovation to maximize shareholder value Key partners: Marketing, Sales, Product Supply, Market Research, Research & Development Case study is a typical example you would face at P&G out of Cornell Issue: Should you launch a product? What are the risks?

19
North America Laundry Overview In 1918, P&G launched first soap designed for laundry use -- Ivory Snow. In 1946, a technological breakthrough led to best performing laundry detergent ever -- Tide By 1949, Tide had become the number one laundry brand in the U.S. and has been the number one brand every day since that time! P&G added Cheer in 1952, Gain in 1966, Ariel in 1967 and Era in 1972. Today Laundry Detergents are a Huge, Critical Business U.S. Liquid Laundry Detergent Market is $5.8 Billion in Sales P&G’s share is more than 55%

20
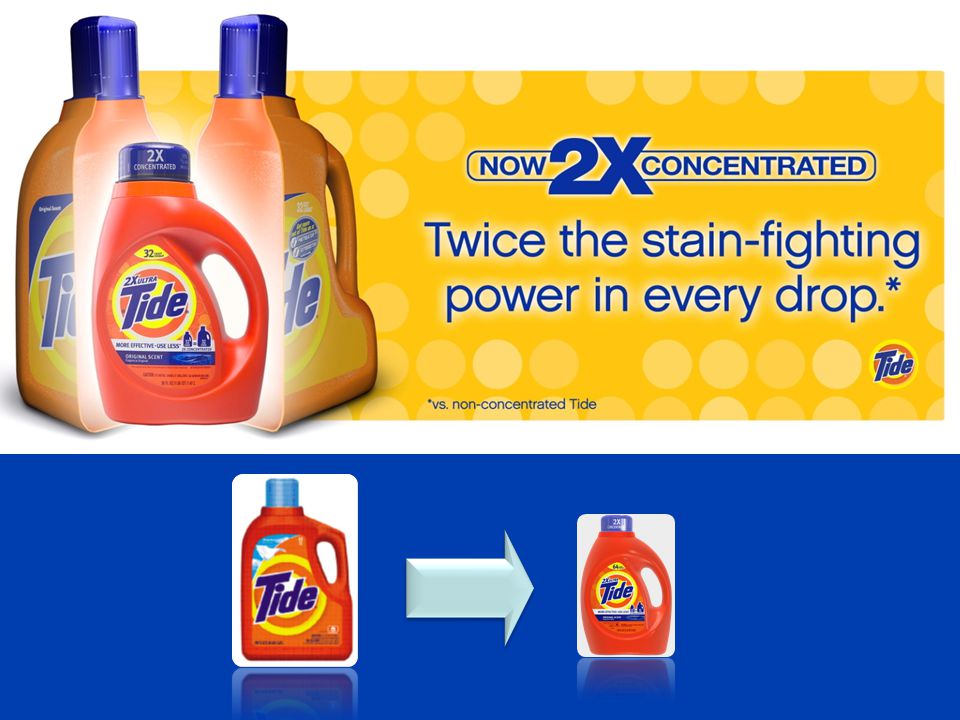
The Breakthrough R&D Idea: R&D is 75% confident they could double the concentration of liquid Tide and get the same or better cleaning results Instead of 91 ml of Tide, a consumer would only need to add 45.5 ml of Tide to a load of laundry R&D needs 1 yr and a dedicated staff /research budget to fully investigate the idea – total cost of research = $10 million F&A Assignment – Is this $10 million a worthwhile investment? Need input for staffing portfolio decision meeting in 10 minutes

21
41 % less plastic 65,000,000 less lbs. of plastic 32% less water 200,000,000 less gallons of water 23% less energy 8,700,000 less gallons of diesel fuel 2X is Better for the Environment!

22
Tide Financials Disclaimer: All case study numbers are completely fictitious and were fabricated solely for the purpose of creating this case study. $10MM investment for 75% chance of… 41% reduction in plastic ~$0.15 per bottle packaging savings (on 500 million bottles) ~50% reduction in weight per bottle ~$0.20 per bottle freight savings (on 500 million bottles) Should we invest?
 ~50% reduction in weight per bottle ~$0.20 per bottle freight savings (on 500 million bottles) Should we invest .")
23
Key Top Line Financial Assessment Is it consistent with our strategy? Is the size of the prize attractive? Is success likely (or likely enough)? What are some reasons we might choose to not pursue a project such as this?
. What are some reasons we might choose to not pursue a project such as this .")
24
Deeper Analysis As we progress the idea, we will analyze the project with the help of a thorough financial model to assess financial viability, guide decision making, set expectations etc. Model is created through contributions of a number of key finance team members Product Supply Finance Brand Finance Customer Business Development Finance

25
Deeper Analysis: Product Supply Finance What does PS Finance do? Forecasts and analyzes the cost of manufacturing products, including: Product Costs Packaging Costs Plant Manufacturing Costs Shipping/ distribution Costs Identifies opportunities and influences decisions for efficiencies and cost savings.

26
Product Supply Finance Analysis What are key questions to be asked? Would we need to invest in new manufacturing equipment? Packing equipment? Are active ingredient costs the same? By what percentage can we reduce packaging costs? By what percentage can we reduce freight costs? How do we manage cutover inventory?

27
How Big is the Laundry Detergent Business? Just one of P&G’s warehouses is as big as 9 football fields. You could lay the Empire State building inside it with room to spare.

28
Deeper Analysis: Brand Finance What does Brand finance do? Develop business strategies Manage the profitability of the business Influence decisions to drive value creation Evaluate product initiatives, including new product launches and restages Holistically evaluates the consumer, customer, competition, cost and investment for opportunities and risk Manages product pricing

29
Brand Finance Analysis What are key questions to be asked? Do we need to adjust marketing spending? How should the marketing budget be allocated between brands (Tide, Gain, Cheer, etc.) Do we need to adjust overhead spending? How do we size and price the new product? What would competition do? How much can we invest in new packaging options? Should we do a test market, or move right to a national launch?
 Do we need to adjust overhead spending. How do we size and price the new product. What would competition do. How much can we invest in new packaging options. Should we do a test market, or move right to a national launch .")
30
Deeper Analysis: Customer Business Development Finance What does CBD Finance do? Build and leverage P&G’s in-depth understanding of retail economics Work with customers to develop win/win strategies for pricing, distribution, merchandising and shelving. Quantifies value delivered to the customers by P&G activities

31
Customer Business Development Finance Analysis What are key questions to be asked? What is the benefit for the customers (e.g. Walmart, Kroger, etc) and how can P&G benefit from that value? What are the implications to the customer shelf? What are the implications on customer freight costs? How will customer inventory levels be impacted? What is the in-store merchandising plan, and how much should we invest to support it? How would the transition be managed?
 and how can P&G benefit from that value. What are the implications to the customer shelf. What are the implications on customer freight costs. How will customer inventory levels be impacted. What is the in-store merchandising plan, and how much should we invest to support it. How would the transition be managed .")
32
Compaction Impact on Key Warehouse Costs Elements RECEIVE PRODUCT PUT AWAYSTORAGE SPACE LOAD TRUCK TO STORE TRANSPORTATION TO STORE INVENTORY CARRY COST SAVINGS Cases per Pallet Cases per Year Pallets in DC INCREASE Cases per Truck Trucks per Year Cases per Pallet Cases per Year Cases per Pallet Cases per Year Cases per Truck Cases per Year

33
Compaction Impact on Key Store Costs Elements CLEAN UPPLACE ON SHELF OPEN AND UNPACK STORE OCCUPANCY RECEIVE AND SORT INV CARRY COST SAVINGS Compacted SKU’s occupy less space Bottles on Shelf INCREASE Cases per Year

34
Sample Calculation Open Case in Store 60 min/hr = x Before Compaction: 1,000,000 cases/yr x $0.05/case = $50,000/yr After Compaction: 700,000 cases/yr x $0.05/case = $35,000/yr Savings: $15,000/yr 0.17 min/case Willard Bishop Productivity Factor $18.43 /hr Wage Rate for Stocking Clerk $0.05 /case Direct Product Cost for that activity

35
CBD Finance Analysis Calculation of the value of Compaction to P&G’s customers (Walmart, Costco, etc.)
")
36
NPV Solution:

37
So what happened with Laundry Compaction?

39
Marketing Summary Launched with strong marketing plan balancing “education” with “product benefit” messages. TV Print In-Store Digital Media PR TV Print In-Store Digital Media PR

41
Retailer Support for Compaction Outstanding in-store merchandising support

42
Retailer Support for Compaction Strategic fit with retailers’ environmental priorities

43
Shelf Impacts 20-25% Reduction in Shelf Space Shelf Pre- Compaction Shelf Post- Compaction

44
60 Cases 360 Bottles --------------------- 30 Pallets/Truck 10,800 Bottles/Truck 60 Cases 240 Bottles ---------------------- 23 Pallets/Truck 5,520 Bottles/Truck Freight Impacts Compaction enabled a 2X increase in the number of bottles on a truck

45
Investor / Shareholder The investment and savings were significant enough to generate interest from Wall Street.

46
Financial Summary Over-delivered Project Financials Cost Savings, Sales Growth, Environmental Benefits Delivered Maintained Share Leadership Concept Reapplied in Other Countries Supported Future Innovations

47
THANK YOU! (Please come to an informal reception tonight from 7:30 to 9pm in the Statler Lounge)
")
Similar presentations


![THE STRATEGIC MANAGEMENT PROCESS [How to Analyze a Case] Dr. Ellen A. Drost Mgmt 497.](/24/7003595/big_thumb.jpg "THE STRATEGIC MANAGEMENT PROCESS [How to Analyze a Case] Dr. Ellen A. Drost Mgmt 497.>")

