Download presentation
Presentation is loading. Please wait.

1
Lives Saved Tool (LiST): How to create a sub-national projection Ingrid Friberg, PhD
: How to create a sub-national projection Ingrid Friberg, PhD")
2
Why create a sub-national projection? Demography is the basis of all child survival data –Birth counts for baseline Noticeably different than national information –i.e India vs. Kerala Separate urban and rural To use over and over again

3
SADHS, 1998

4
What demographic data is needed? Population by age group and genderTotal fertility rate Life expectancy by genderAge specific fertility rate Life tableSex ratio at birth International (sub-national) migration
 migration.")
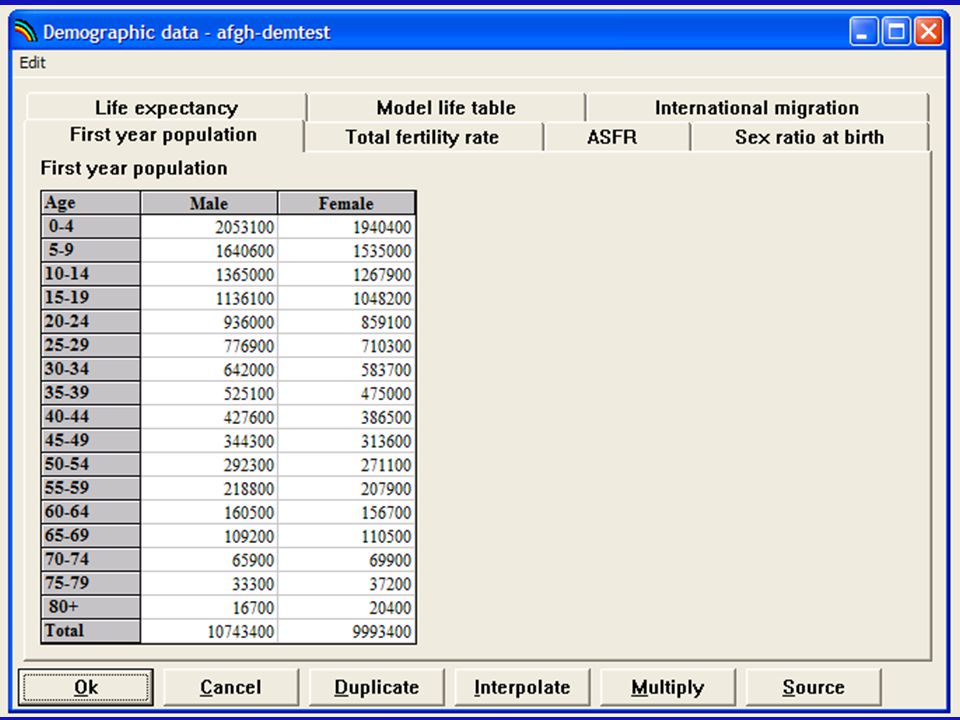
5
Edit – Demography (DemProj)
")
7
How to create a sub-national projection? Easy –Assume national trends are essentially correct –Multiply to get the proportion of the country Hard –Assume nothing –Identify regional data and enter it

8
Create a sub-national projection: the easy way Create a national projection –Use EasyProj (population, fertility, mortality) Generate the sub-national population –Multiply the first year population by the percent of the total in the sub-national area Adjust the migration values Save for reuse
 Generate the sub-national population –Multiply the first year population by the percent of the total in the sub-national area Adjust the migration values Save for reuse")
9
1) Select entire population 2) Click multiply 3) Enter the percent of the total in the sub-population
 Select entire population 2) Click multiply 3) Enter the percent of the total in the sub-population")
10
National migrant numbers need to be adjusted to reflect sub-population changes.

11
Limitations and Strengths Limitations Can’t change the time frame (yet) May deliver inaccurate births counts If using AIM, need to adjust this as well Strengths Easy Can reuse the same time frame over and over Reasonably accurate
 May deliver inaccurate births counts If using AIM, need to adjust this as well Strengths Easy Can reuse the same time frame over and over Reasonably accurate")
12
Creation of sub-national projection: the hard way Collect data for a specific baseline year + trend Create a national projection –Do NOT use EasyProj Enter the sub-national data Save this projection –Can modify underlying tables to reflect the new data (optional) Population by age group and genderTotal fertility rate Life expectancy by genderAge specific fertility rate Life table for mortalitySex ratio at birth International (sub-national) migration
 Population by age group and genderTotal fertility rate Life expectancy by genderAge specific fertility rate Life table for mortalitySex ratio at birth International (sub-national) migration")
13
Where is the data from? Census data National surveys Sub-national surveys DHS

14
Limitations and Strengths Limitations Time consuming May need to estimate some parameters If the data is wrong, the projection is wrong Strengths Very accurate Can reuse with all time periods of interest (if you change underlying tables)
")
15
Other options Combining the easy and the hard way –Run EasyProj –Use multiply to get population information (if you don’t have it) –Enter all known available data
 –Enter all known available data")
16
Example: South Africa – Eastern Cape Start with AIM –Runs 1970-2015 –DemProj already run –Altered all numbers to percents Adult ART, child ART, cotrimoxazole Edit DemProj

18
SADHS, 1998 UrbanNon-urban 12.4%12.6% 25.022.7 27.222.2 19.519.0 11.714.1 4.06.4 0.23.1

19
Data Collected 1 st year pop -2001 Census TFR -SADHS 1998 ASFR -Default SexRatio -Default Life Expectancy-Health Systems Trust Life Table -Default Migration -State of SA population report

20
Example: South Africa – Eastern Cape Start with AIM –Runs 1970-2015 –Altered all numbers to percents Adult ART, child ART, cotrimoxazole Edit DemProj –Population, Migration, TFR, Life Expectancy Add LiST –Adjust mortality rates to reflect HIV –Edit child survival data and coverage data –Increase facility delivery from 74-96%

21
Scaling up facility based births from 74% to 95% prevents ~6% of all deaths and ~18% of neonatal deaths

22
Example – Brazil Rio Grande do Sul New Projection –Run EasyProj (1996-2015) Edit Projection –Data from 1996 Census, 1996 DHS survey Population 1996, TFR, Life expectancy… Add LiST –Adjust NMR (11), IMR (19), U5MR (22) –Adjust other data…
 Edit Projection –Data from 1996 Census, 1996 DHS survey Population 1996, TFR, Life expectancy… Add LiST –Adjust NMR (11), IMR (19), U5MR (22) –Adjust other data…")
23
Results Kangaroo Mother Care (0-70%) –Prevents 95 deaths Preventive Postnatal Care (0-70%) –Prevents 290 deaths Pneumococcal vaccine (0-99%) –Prevents 128 deaths Conclusion: preventive postnatal care might be a good area to invest in here
 –Prevents 95 deaths Preventive Postnatal Care (0-70%) –Prevents 290 deaths Pneumococcal vaccine (0-99%) –Prevents 128 deaths Conclusion: preventive postnatal care might be a good area to invest in here")
24
More information? DemProj manual –English, French, Russian, Spanish –www.healthpolicyinitiative.com/index.cfm?id= software&get=Spectrum –www.healthpolicyinitiative.com –www.futuresinstitute.org/pages/spectrum.aspxwww.futuresinstitute.org/pages/spectrum.aspx Local demographer ifriberg@jhsph.edu

Similar presentations


, Child Health Epidemiology.>")

: A few details What you need to know to actually make this program work and work well…>")


 A Research Unit of the University of Cape Town.>")


 A Research Unit of the University.>")


