Download presentation
Presentation is loading. Please wait.

1
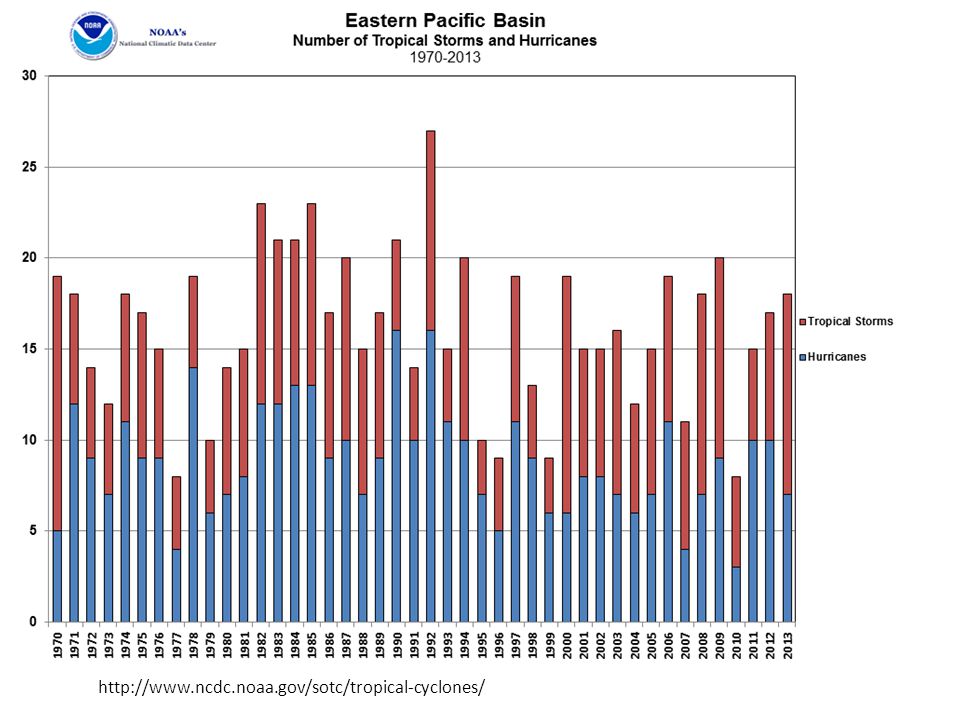
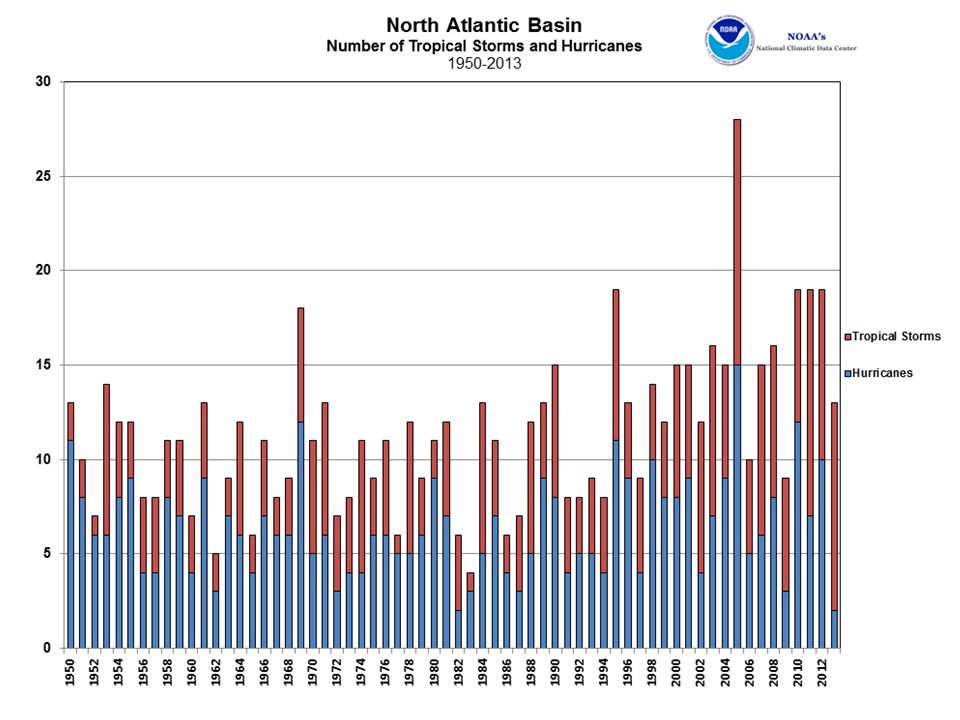
CO2: Steadily increasing Atmospheric CO2 in the central pacific 1958 to 2013 Human CO2 emissions from selected regions 1965 to 2011 Global warming real: Dramatic or slow with pauses? University of East Anglia data for both land and sea surface spanning 1849 to 2013 Sea level rise: Abrupt or gentle? Tide data from San Francisco near the golden gate bridge. This is the longest time span in North America I could find: monthly averages 1854 to 2014 The second plot is the same data with 3 year averaging and comparisons to other measures of sea level rise ~1880 to 2011 Tropical Storms & Hurricanes Are these becoming more prevalent? NOAA offers data 1950 to 2013. What about hurricanes only? The sum of storms and hurricanes ? dunning@sonoma.edu

2
http://www.esrl.noaa.gov/gmd/ccgg/trends/#mlo_full

3
CO2 estimated using BP hydrocarbon data http://www.bp.com/assets/bp_internet/globalbp/globalbp_uk_english/reports_and_publications/statistical_energy_review_2011/STAGING/local_assets/pdf/ statistical_review_of_world_energy_full_report_2012.pdf US data by quarter is at: http://www.eia.gov/todayinenergy/detail.cfm?id=7350. http://www.bp.com/assets/bp_internet/globalbp/globalbp_uk_english/reports_and_publications/statistical_energy_review_2011/STAGING/local_assets/pdf/ statistical_review_of_world_energy_full_report_2012.pdfhttp://www.eia.gov/todayinenergy/detail.cfm?id=7350 Tons per year World CO2 ~ 33 billion tons per year (bty) in 2011 ~ 25 bty from the three regions plotted
 in 2011 ~ 25 bty from the three regions plotted.")
4
The time series shows the combined global land and marine surface temperature record from 1850 through 2013. This record uses the latest analysis, referred to as HadCRUT4 (Morice et al., 2012). http://www.cru.uea.ac.uk/cru/data/temperature/HadCRUT4.pdf Little Ice age from ~ 1300 to 1910 Degrees C Temperature
. Little Ice age from ~ 1300 to 1910 Degrees C Temperature.")
5
-0.65 ft August 1 1856 ~0.6 feet in 160 years -0.02 ft April 1, 2014 The dated spikes marked are associated with El Nino/Southern Oscillation warming and consequent thermal expansion of the Pacific ocean. 1982 - 83 1997 - 98 http://tidesandcurrents.noaa.gov/waterlevels.html?id=9414290&units=standard&bdate=185 40601&edate=20140519&timezone=GMT&datum=MSL&interval=m&actionhttp://tidesandcurrents.noaa.gov/waterlevels.html?id=9414290&units=standard&bdate=185 40601&edate=20140519&timezone=GMT&datum=MSL&interval=m&action=

6
http://www.agu.org/journals/eo/v093/i027/2012EO270001/2012EO270001_rga.pdf The observed San Francisco tide gauge 3-year running mean sea levels (blue line). Trends in the tide gauge record (black lines) are near zero between 1880 and 1930 and since about 1980. The global mean sea level rise rate (green line, green-shaded region denotes the 1.7 ± 0.5 millimeters per year bounds) [Bindoff et al.,2007]. Global MSL satellite altimetry trend (magenta; 3.1 ± 0.7 millimeters per year) [Timmermann et al., 2010] are very different from the San Francisco regional sea level trend.
 are near zero between 1880 and 1930 and since about The global mean sea level rise rate (green line, green-shaded region denotes the 1.7 ± 0.5 millimeters per year bounds) [Bindoff et al.,2007]. Global MSL satellite altimetry trend (magenta; 3.1 ± 0.7 millimeters per year) [Timmermann et al., 2010] are very different from the San Francisco regional sea level trend..")
8
http://www.ncdc.noaa.gov/sotc/tropical-cyclones/
Similar presentations


![Climate Change Impacts in the United States Third National Climate Assessment [Name] [Date] Climate Trends.](/15/4626683/big_thumb.jpg "Climate Change Impacts in the United States Third National Climate Assessment [Name] [Date] Climate Trends.>")
 616-5346 University of Washington.>")

 616-5346 University of Washington.>")


 to +4.0°C.>")


