Download presentation
Presentation is loading. Please wait.

1
(Country Paper: Cambodia) on Data Processing and Dissemination Technology used for the General Population Census of Cambodia 2008
 on Data Processing and Dissemination Technology used for the General Population Census of Cambodia 2008")
5
- Population Size : 13,395,682 - Population Density per sq. Km: 75 - Land Area: 181.035 sq. Km

6
The NIS, which is the part of the Ministry of Planning, is focal point on statistical matters in Cambodia. The mandate of NIS is data collection, compiling and dissemination through the surveys and censuses. The statistical units and sections contains the line Ministries and Provincial Planning Department. IT Operation in NIS has started since 1993 up to date with support of many development partners. The IT methods used in 1998 census and 2008 Census are similar methods using micro computer for data entry, computer editing, tabulation and dissemination products.

7
Data Capture Data Coding Data Editing Data Storage and Tabulation

8
Data Capture: The data contained in the records of the 2008 General Population Census of Cambodia numbering more than 2 million (households) were entered into computer by using CSPro software. The data entry applications had checked and controlled many errors by performing a number of range and consistency checks during data entry time. In such an approach data quality was considered more importance than data entry speed. Data Coding: After the initial build-up period, some 70 designated office editors continued this activity until all questionnaires were completed. Manual coding & editing of main census questionnaires commenced in May 2008 after an initial two-week training course. The activity was completed by December 2008, i.e. the entire process took about 8 months.

9
Data Editing: The CSPRO editing program was executed three times on each data set. The first time to load appropriate seed values for the hot-decks, the second time to perform the actual imputations and the third time to ensure the resulting data file was free of errors. Data Storage and Tabulation: The census data were stored in CD-ROM, external hard disk, hard disk and Server. After checking the census data were free of errors, the tabulation stage was started. Actual tabulations were performed with the CENTS of IMPS package. The resulting tables required carefully scrutiny both by data processing staff and subject-matter specialists to ensure the contents are in order.

10
Dissemination by print media Electronic Dissemination Products Dissemination Workshop

11
Final Result of the General Population Census of Cambodia 2008 Analytical Reports by Topics: 1) Fertility and Mortality 2) Population Growth and change in spatial distribution 3) Nuptiality 4) Gender and age composition 5) Disability 6) Migration 7) Literacy and education attainment 8) Economic activity and employment 9) Commuting 10) Housing amenity 11) Family and households 12) Women in Cambodia 13) Population Projections of Cambodia 14) Urban Development in Cambodia Wall maps/charts and census thematic atlases Priority Table at National and Provincial Level by topics.
 Fertility and Mortality 2) Population Growth and change in spatial distribution 3) Nuptiality 4) Gender and age composition 5) Disability 6) Migration 7) Literacy and education attainment 8) Economic activity and employment 9) Commuting 10) Housing amenity 11) Family and households 12) Women in Cambodia 13) Population Projections of Cambodia 14) Urban Development in Cambodia Wall maps/charts and census thematic atlases Priority Table at National and Provincial Level by topics.")
12
Off-line electronic dissemination products Table Retrieval System (TRS) Community Profile System (CPS) Population Database Mapping Application CamInfo On-line census dissemination Statics Website Dynamic Website Other Electronic products
 Community Profile System (CPS) Population Database Mapping Application CamInfo On-line census dissemination Statics Website Dynamic Website Other Electronic products")
13
The Final Census Result Report have provided to line-ministries, NGOs, IOs, and Other data users during releasing Final Census Result report chaired by Prime Minister of Kingdom of Cambodia at National level. The Dissemination workshop have conducted at provincial level to provide census data to planner, administrators and researchers.

15
User-friendly interface to select tables, areas, and retrieve tables from CDROM. One simple toolbar provides access to all functions. Select Table(s) Select Area(s) Retrieve tables from CD Preferences Concepts and definitions User guide
 Select Area(s) Retrieve tables from CD Preferences Concepts and definitions User guide.")
16
Select table(s) by clicking on the checkboxes or by using a submenu.
 by clicking on the checkboxes or by using a submenu.")
17
Area levels are hierarchically displayed in a tree view that can be expanded down to the lowest level specified by the geographical area. Areas can be selected by using a submenu.

18
Retrieve table(s) for the selected area(s) from CD and place them in a viewer.
 for the selected area(s) from CD and place them in a viewer.")
19
The table viewer is very versatile. It not only displays the selected tables but data users can also: Save the tables in TXT format; Print the tables; Copy and paste tables into a word processor; Copy table cells into a spreadsheet allowing to undertake further analysis.

20
Similar to TRS, the CPS application offers a user-friendly interface to select areas and to obtain detailed standardized profiles for all geographic entities (right down to the villages). Select Area(s) Obtain Profile(s) Graphs Preferences Concepts and definitions User guide
 Obtain Profile(s) Graphs Preferences Concepts and definitions User guide.")
21
Select one or more areas. Areas are hierarchically displayed in a tree view that can be expanded down to the village level. Areas can be aggregated allowing users to create their own universe.

22
The profile for the selected area(s) are displayed in a viewer.
 are displayed in a viewer.")
23
The CPS application also incorporates limited graphing capabilities for predefined topics.

24
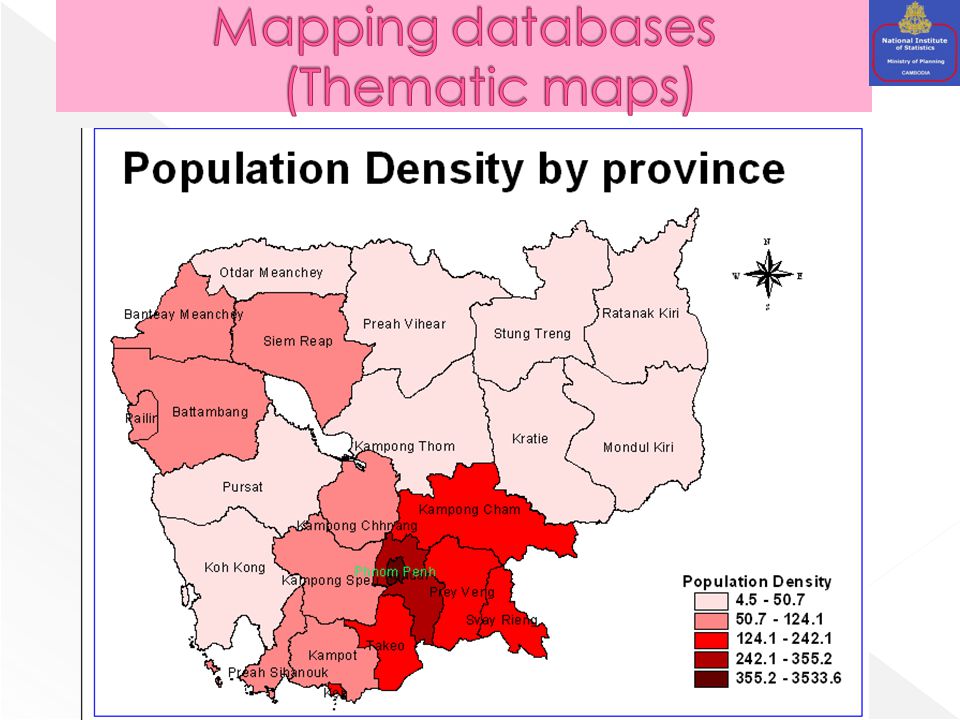
Mapping and graphing databases also greatly improve the effectiveness of census dissemination as trends and patterns of the larger area, and distinct boundary and characteristics are more easily detected when displayed on maps. The project has made available map layers for the Country, Provinces, Districts, Commune and, Villages. Statistical databases consisting of aggregated count, ratios and rates for all geographical levels has complemented these map layers. The layers were in ESRI shape file and MapInfo table file formats. Data users are expected to acquire a copy of their preferred GIS software

26
Based on census micro-data in binary format and encrypted. Allows access to each geographic entity (up to the village level). Users can create their own universe, for example Health Zones. Frequencies, cross-tables, and area counts can be obtained by using simple menus. Subpopulations can be defined by imposing query filters. Queries can be displayed in table format, graphs and maps. Public domain software: Redatam+SP
. Users can create their own universe, for example Health Zones. Frequencies, cross-tables, and area counts can be obtained by using simple menus. Subpopulations can be defined by imposing query filters. Queries can be displayed in table format, graphs and maps. Public domain software: Redatam+SP.")
27
When a micro- dataset is opened, all variables for the entities (in a census normally Households and Persons) will be displayed.
 will be displayed.")
28
Area levels are hierarchically displayed in a tree view that can be expanded down to the lowest level. Users can create their own universe, for example Health Zones, by aggregating areas.

29
To obtain a frequency distribution for a particular variable simply drag and drop the item in the window.

30
Select the area for which the query is required. Area selection down to the lowest level. Users can aggregate area to create their own universe.

31
Frequency queries can be displayed in table format: or with graphs:

32
The some figure of 2008 Population Census have posted in www.nis.gov. kh website. www.nis.gov. kh

33
The 2008 Population Census dynamic website have linked with the www.nis.gov. kh website. www.nis.gov. kh

34
The data users can produce table by themselves down to provincial level through online including graph and map.

37
CamInfo is the national adaptation of Dev Info software, a global initiative funded by the United Nations. CamInfo is Cambodia's Socio-Economic and demographic Indicator Database, providing a one-stop user-friendly computer program for storage, retrieval, comparison and dissemination of a wide range of indicators from different sources, including national surveys, censuses and administrative systems. CamInfo also allows the user to retrieve and compare indicator data values across multiple time periods, geographic levels, and other sub-group dis-aggregations. Data presentation is possible with tables, graphs and maps.

38
According to experience from General Population Census of Cambodia in 1998, the method use for 2008 census for Census Data Dissemination is the same 1998 census. These method such as electronic products, printed report and online (website) but 1998 census didn’t has dynamic website. Other modern method will be considered according to actual requirements and real situation in Cambodia for Data Census Dissemination in the future.
 but 1998 census didn’t has dynamic website. Other modern method will be considered according to actual requirements and real situation in Cambodia for Data Census Dissemination in the future..")
Similar presentations


 www.cid-bdc.cawww.cid-bdc.ca Presented by: Carl Sauriol Rural Research and Analysis Rural and Co-operatives Secretariat.>")


