Download presentation
Presentation is loading. Please wait.

1
Heat Integration A short description with illustration case study Department of Process Integration, UMIST Manchester, UK

2
Heat Integration HEN Grassroot Retrofit Analysis 60 C 40 C50 C 100 C H1 C1 HE

3
Process Integration Developed and pioneered at DPI UMIST Gradually being established in industrial applications needs to penetrate into municipal etc DPI UMIST has a consortium of 26 world leading partners in the field It is supported by research SW Latest research in combined Water & Energy savings

4
Heat Integration Typical energy saving 15 – 45 % Very general – easily applicable in Power generation, Oil refining, Petrochemicals, Food and Drink Industry, Pulp & Paper, hospitals etc Typical pay-back periods from a few weeks to 16 months (decision made by the client) Considerably contributes to Emissions Reduction including CO 2
 Considerably contributes to Emissions Reduction including CO 2")
5
Some PI Consortium Members BP Degussa Mitsubishi Air Products Saudi Aramco Exon Mobil AspenTech Sinopec Norsk Hydro Shell IFP Eng of India CANMET TotalFinaElf JGC Corp UOP MW Kellogg BOC

6
Demonstration Example Most present applications are not grass-route but retrofits Considerably more difficult constrained problem Economy dictates the energy saving potential by pay-back period

7
Retrofit of HEN Crude Distillation Unit Part of a Romanian refinery complex Designed some years ago by a well known contractor Improvement of efficiency and energy consumption & economic savings

8
Process Integration Analysis Introduction Objectives Process Integration Analysis Conclusions Acknowledgements PINCH ANALYSIS SUGGESTED DESIGNS DATA COLLECTION SIMULATION EXISTING PROCESS RETROFIT ANALYSIS Process Integration Analysis EXISTING PROCESS

9
Preheat Train Crude Oil Kerosene Atmospheric Tower Medium Naphtha Vapour Naphtha Stabiliser Light Naphtha LPG (C2 - C5) Vapour Vacuum Residue HVGO LVGO Vacuum Tower Vapour LAGO HAGO Diesel Atmospheric Residue Denaphtha Tower Vapour Denaphtha Oil Naphta Steam Kerosene
 Vapour Vacuum Residue HVGO LVGO Vacuum Tower Vapour LAGO HAGO Diesel Atmospheric Residue Denaphtha Tower Vapour Denaphtha Oil Naphta Steam Kerosene")
10
Process Integration Analysis Introduction Objectives Process Integration Analysis Conclusions Acknowledgements PINCH ANALYSIS SUGGESTED DESIGNS DATA COLLECTION SIMULATION EXISTING PROCESS SIMULATION RETROFIT ANALYSIS SIMULATION Process Integration Analysis

11
Plant measurements & HYSYS Peng-Robinson property package Main source of data Existing HEN Energy consumption

12
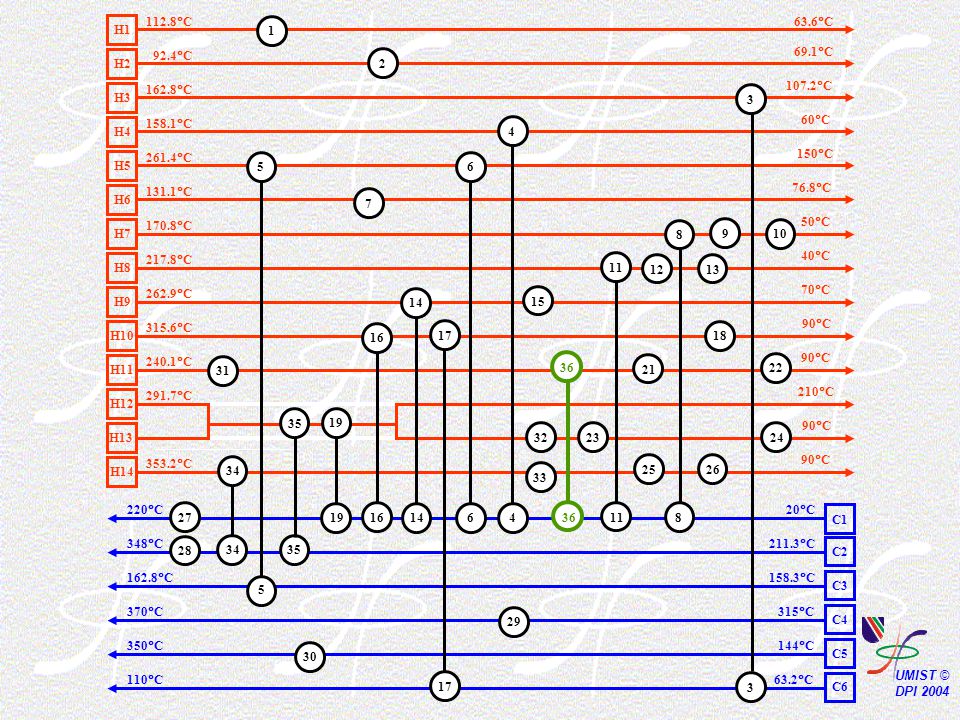
112.8 C 92.4 C 162.8 C 158.1 C 315.6 C 262.9 C 217.8 C 170.8 C 90 C 70 C 40 C 50 C 210 C 90 C 20 C 211.3 C 158.3 C 220 C 348 C 110 C 350 C 370 C 162.8 C 63.2 C 144 C 315 C 240.1 C 291.7 C 353.2 C 63.6 C 69.1 C 107.2 C 60 C 150 C 76.8 C 131.1 C 261.4 C 1 26 2 7 10 13 25 21 23 24 22 18 15 12 9 31 32 33 27 30 29 28 3 4 5 6 8 11 14 16 17 19 16 1411846 5 17 3 H1 H2 H3 H4 H5 H6 H7 H8 H9 H14 H13 H12 H10 H11 C1 C2 C3 C4 C5 C6 19

13
112.8 C 92.4 C 162.8 C 158.1 C 315.6 C 262.9 C 217.8 C 170.8 C 90 C 70 C 40 C 50 C 210 C 90 C 20 C 211.3 C 158.3 C 220 C 348 C 110 C 350 C 370 C 162.8 C 63.2 C 144 C 315 C 240.1 C 291.7 C 353.2 C 63.6 C 69.1 C 107.2 C 60 C 150 C 76.8 C 131.1 C 261.4 C 1 26 2 7 10 13 25 21 23 24 22 18 15 12 9 31 32 33 27 30 29 28 11238.9 6797.2 538.9 20027.8 6758.3 6630.3 15113.9 1673.0 1228.6230.1 1410.51614.2 320.0 3293.91971.7 1652.8 452.2 177.1 2767.5 833.3 788.9 2959.4 1057.5 1207.5 13326.9 4491.7 2702.2 1688.6 52480.6 1563.6 14875.0 3 4 5 6 8 11 14 16 17 19 16 1411846 5 17 3 H1 H2 H3 H4 H5 H6 H7 H8 H9 H14 H13 H12 H10 H11 C1 C2 C3 C4 C5 C6 16349.4 19 AC H H H H CW = 38,293 kW AC = 8,677 kW H = 73,410 kW CW

14
Process Integration Analysis Introduction Objectives Process Integration Analysis Conclusions Acknowledgements PINCH ANALYSIS SUGGESTED DESIGNS DATA COLLECTION SIMULATION EXISTING PROCESS DATA COLLECTION RETROFIT ANALYSIS DATA COLLECTION Process Integration Analysis

17
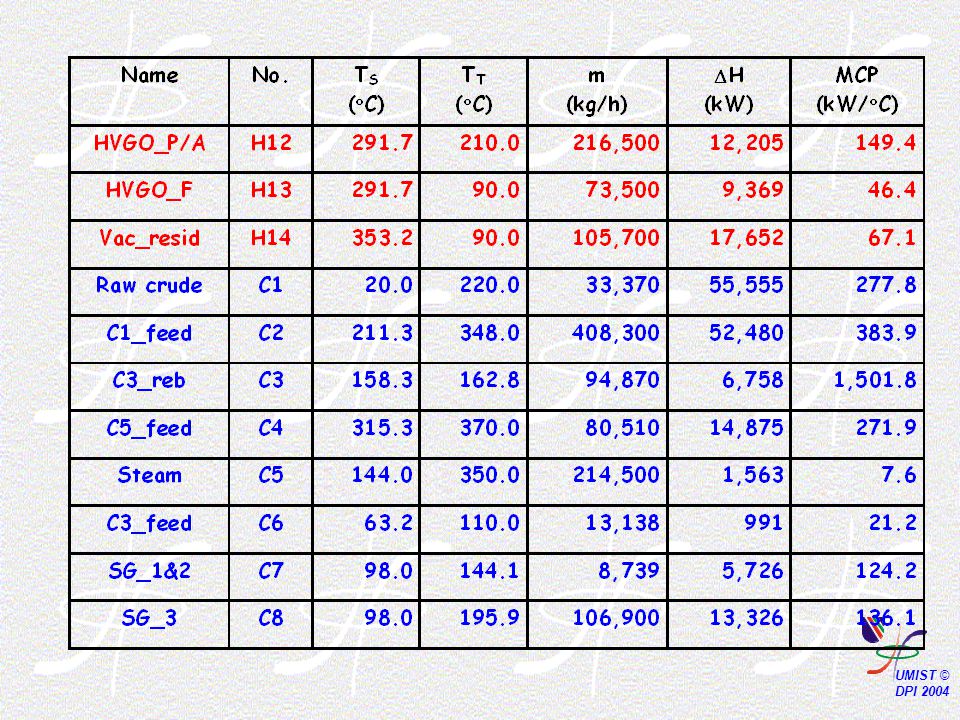
.................. Exchanger Data

18
Economic Data HE : HEC($) = K 1 + K 2 A K3 T < 200 C (CS) : HEC($) = 33,641 + 819 A 0.78 T > 200 C (SS) : HEC($) = 33,641 + 1,795 A 0.78 Utilities Cooling water: 9.23 $/kW y Cooling air: 8.31 $/kW y Fuel gas: 57.4 $/kW y 1996 data Nelson-Farrar Cost Index
 = K 1 + K 2 A K3 T < 200 C (CS) : HEC($) = 33, A 0.78 T > 200 C (SS) : HEC($) = 33, ,795 A 0.78 Utilities Cooling water: 9.23 $/kW y Cooling air: 8.31 $/kW y Fuel gas: 57.4 $/kW y 1996 data Nelson-Farrar Cost Index")
19
Process Integration Analysis Introduction Objectives Process Integration Analysis Conclusions Acknowledgements PINCH ANALYSIS SUGGESTED DESIGNS DATA COLLECTION SIMULATION EXISTING PROCESS PINCH ANALYSIS RETROFIT ANALYSIS PINCH ANALYSIS Process Integration Analysis

20
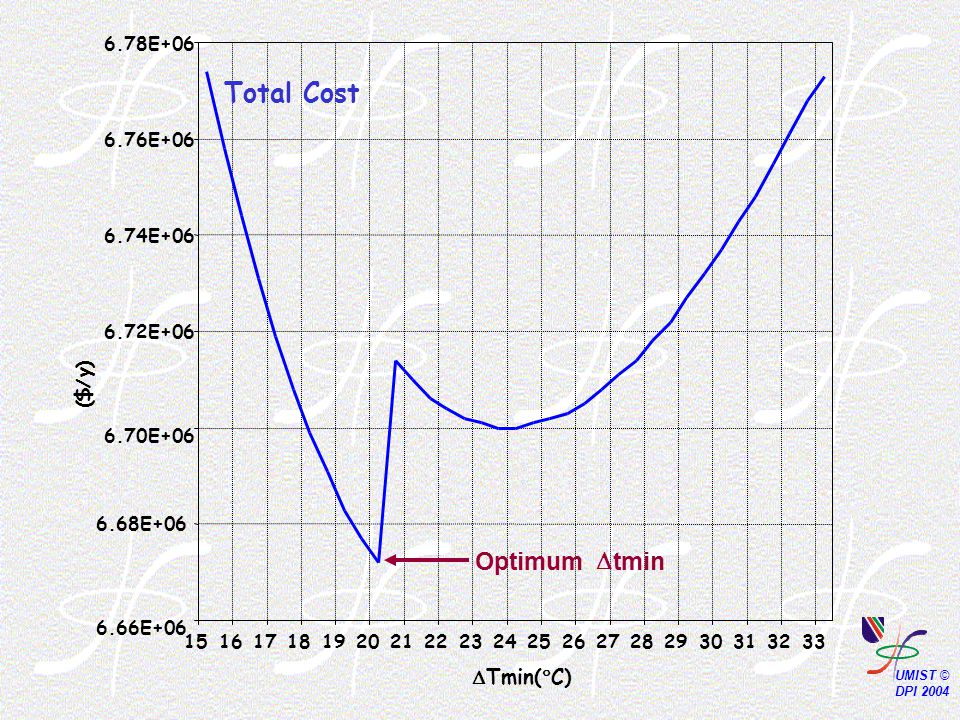
0.005.00 10.0015.0020.0025.0030.0035.0040.00 Tmin [C] 0.25E+07 0.35E+07 0.45E+07 0.55E+07 0.65E+07 0.75E+07 0.85E+07 0.95E+07 0.11E+08 Total Cost Capital Cost Operating Cost ($/y) Optimum T MIN
![ Tmin [C] 0.25E E E E E E E E E+08 Total Cost Capital Cost Operating Cost ($/y) Optimum T MIN](http://images.slideplayer.com/13/3824579/slides/slide_20.jpg " Tmin [C] 0.25E E E E E E E E E+08 Total Cost Capital Cost Operating Cost ($/y) Optimum T MIN")
22
0.0 410 4 8 4 1.210 5 1.610 5 Enthalpy [kW] 50.0 100.0 150.0 200.0 250.0 300.0 350.0 400.0 T( C) Q H,MIN = 55,553 kW Q C,MIN = 29,881 kW Composite Curves
![Enthalpy [kW] T( C) Q H,MIN = 55,553 kW Q C,MIN = 29,881 kW Composite Curves](http://images.slideplayer.com/13/3824579/slides/slide_22.jpg "Enthalpy [kW] T( C) Q H,MIN = 55,553 kW Q C,MIN = 29,881 kW Composite Curves")
23
Process Integration Analysis Introduction Objectives Process Integration Analysis Conclusions Acknowledgements PINCH ANALYSIS SUGGESTED DESIGNS DATA COLLECTION SIMULATION EXISTING PROCESS RETROFIT ANALYSIS Process Integration Analysis RETROFIT ANALYSIS

24
Network Pinch Method Pinching matches bottleneck How to overcome pinching matches?

25
Network Pinch Method DIAGNOSIS STAGE New Modifications OPTIMISATION STAGE Energy - Capital Cost Trade-off Existing HEN Suggested Design

26
(8) 2 nd RESEQUENCE HE16, stream C1 (9) 1 st NEW HE HE34: H14 – C2 (10) 2 nd NEW HE HE35: H12 – C2 (11) 3 th NEW HE HE36: H11 - C1 (7) 1 st RESEQUENCE HE4, stream C1 (12) 1 st NEW HE HE34: H14 – C2 y (13) 2 nd NEW HE HE35: H12 – C2 (14) 3 th NEW HE HE36: H4 - C1 (3) 3 th REPIPING HE16: H10 H11 (4) 1 st NEW HE HE34: H13 - C1 (6) 3 th NEW HE HE36: H7 - C1 (1) 1 st REPIPING HE8: H7 H14 (2) 2 nd REPIPING HE8: C1 C2 (5) 2 nd NEW HE HE35: H5 - C2 EXISTING HEN
 2 nd RESEQUENCE HE16, stream C1 (9) 1 st NEW HE HE34: H14 – C2 (10) 2 nd NEW HE HE35: H12 – C2 (11) 3 th NEW HE HE36: H11 - C1 (7) 1 st RESEQUENCE HE4, stream C1 (12) 1 st NEW HE HE34: H14 – C2 y (13) 2 nd NEW HE HE35: H12 – C2 (14) 3 th NEW HE HE36: H4 - C1 (3) 3 th REPIPING HE16: H10 H11 (4) 1 st NEW HE HE34: H13 - C1 (6) 3 th NEW HE HE36: H7 - C1 (1) 1 st REPIPING HE8: H7 H14 (2) 2 nd REPIPING HE8: C1 C2 (5) 2 nd NEW HE HE35: H5 - C2 EXISTING HEN")
27
Process Integration Analysis Introduction Objectives Process Integration Analysis Conclusions Acknowledgements PINCH ANALYSIS SUGGESTED DESIGNS DATA COLLECTION SIMULATION EXISTING PROCESS SUGGESTED DESIGNS RETROFIT ANALYSIS SUGGESTED DESIGNS Process Integration Analysis

28
(7) 1 st RESEQUENCE HE4, stream C1 EXISTING HEN
 1 st RESEQUENCE HE4, stream C1 EXISTING HEN")
30
OPTION I In need of further study Payback Time 1 months Savings = 114,190 $/y (9) 1 st NEW HE HE34: H14 – C2 (7) 1 st RESEQUENCE HE4, stream C1 EXISTING HEN
 1 st NEW HE HE34: H14 – C2 (7) 1 st RESEQUENCE HE4, stream C1 EXISTING HEN")
32
OPTION II Capital Investment = 133,983 $ Payback Time = 4 months Savings = 320,610 $/y OPTION I In need of further study Payback Time 1 months Savings = 114,190 $/y (9) 1 st NEW HE HE34: H14 – C2 (10) 2 nd NEW HE HE35: H12 – C2 (7) 1 st RESEQUENCE HE4, stream C1 EXISTING HEN
 1 st NEW HE HE34: H14 – C2 (10) 2 nd NEW HE HE35: H12 – C2 (7) 1 st RESEQUENCE HE4, stream C1 EXISTING HEN")
34
OPTION II Capital Investment = 133,983 $ Payback Time = 4 months Savings = 320,610 $/y OPTION III Capital Investment = 648,803 $ Payback Time = 10 months Savings = 495,440 $/y OPTION I In need of further study Payback Time 1 months Savings = 114,190 $/y (9) 1 st NEW HE HE34: H14 – C2 (10) 2 nd NEW HE HE35: H12 – C2 (11) 3 th NEW HE HE36: H11 - C1 (7) 1 st RESEQUENCE HE4, stream C1 EXISTING HEN
 1 st NEW HE HE34: H14 – C2 (10) 2 nd NEW HE HE35: H12 – C2 (11) 3 th NEW HE HE36: H11 - C1 (7) 1 st RESEQUENCE HE4, stream C1 EXISTING HEN")
36
OPTION II Capital Investment = 133,983 $ Payback Time = 4 months Savings = 320,610 $/y OPTION III Capital Investment = 648,803 $ Payback Time = 10 months Savings = 495,440 $/y OPTION IV Capital Investment = 829,367 $ Payback Time = 11 months Savings = 586,190 $/y OPTION I In need of further study Payback Time 1 months Savings = 114,190 $/y (9) 1 st NEW HE HE34: H14 – C2 (10) 2 nd NEW HE HE35: H12 – C2 (11) 3 th NEW HE HE36: H11 - C1 (7) 1 st RESEQUENCE HE4, stream C1 EXISTING HEN
 1 st NEW HE HE34: H14 – C2 (10) 2 nd NEW HE HE35: H12 – C2 (11) 3 th NEW HE HE36: H11 - C1 (7) 1 st RESEQUENCE HE4, stream C1 EXISTING HEN")
37
100,000 150,000 200,000 250,000 300,000 350,000 400,000 450,000 500,000 550,000 600,000 24681012141618 Payback Time (months) Utility Cost Saving ($/y) Option III Option II Option V Option I Option IV
 Utility Cost Saving ($/y) Option III Option II Option V Option I Option IV")
38
112.8 C 92.4 C 162.8 C 158.1 C 315.6 C 262.9 C 217.8 C 170.8 C 90 C 70 C 40 C 50 C 210 C 90 C 20 C 211.3 C 158.3 C 220 C 348 C 110 C 350 C 370 C 162.8 C 63.2 C 144 C 315 C 240.1 C 291.7 C 353.2 C 63.6 C 69.1 C 107.2 C 60 C 150 C 76.8 C 131.1 C 261.4 C 1 26 2 7 10 13 25 21 2324 22 18 15 12 9 31 32 33 27 30 29 28 3 5 6 8 11 14 16 17 1916141186 5 17 3 H1 H2 H3 H4 H5 H6 H7 H8 H9 H14 H13 H12 H10 H11 C1 C2 C3 C4 C5 C6 19 35 36 34 4 4

39
OPTION IV - SUGGESTED DESIGN 1 Re-sequence + 3 New HE Utility savings Hot utility = 12+% Cold utility = 19+% Emissions reduction (9 MW) Capital Investment = 830,000 US$ Payback Time < 10 months
 Capital Investment = 830,000 US$ Payback Time < 10 months")
40
PINCH ANALYSIS SUGGESTED DESIGNS DATA COLLECTION SIMULATION EXISTING PROCESS RETROFIT ANALYSIS EXISTING PROCESS DATA COLLECTION PINCH ANALYSIS SIMULATION SUGGESTED DESIGNS RETROFIT ANALYSIS Network Pinch Method Diagnosis Stage Optimisation Stage Different Options (4) Suggested Topology 1 Re-sequencing. + 3 New HE Savings Hot utility = 12+% Cold utility = 19+% Emissions reduction (9 MW) Payback Time 10 months
 Payback Time 10 months.")
41
www.dcs.vein.hu/pres2004
Similar presentations