Download presentation
Presentation is loading. Please wait.

1
Towards the trans-GZK area ray (from AGASA, AUGER, HIRES TO JEM -EUSO) J. N. Capdevielle, APC, University Paris Diderot capdev@apc.univ-paris7.fr

2
Outline Towards Gamma ray Astronomy at UHE from the sky Towards Gamma ray Astronomy at UHE from the sky Energy overestimation in AGASA (treatment of inclined showers) Energy overestimation in AGASA (treatment of inclined showers) Difficulties in AUGER for Tmax and attenuation length measurements Difficulties in AUGER for Tmax and attenuation length measurements convergence to GZK and unified tendancy convergence to GZK and unified tendancy The JEM-EUSO experiment The JEM-EUSO experiment
 Energy overestimation in AGASA (treatment of inclined showers) Difficulties in AUGER for Tmax and attenuation length measurements Difficulties in AUGER for Tmax and attenuation length measurements convergence to GZK and unified tendancy convergence to GZK and unified tendancy The JEM-EUSO experiment The JEM-EUSO experiment")
3
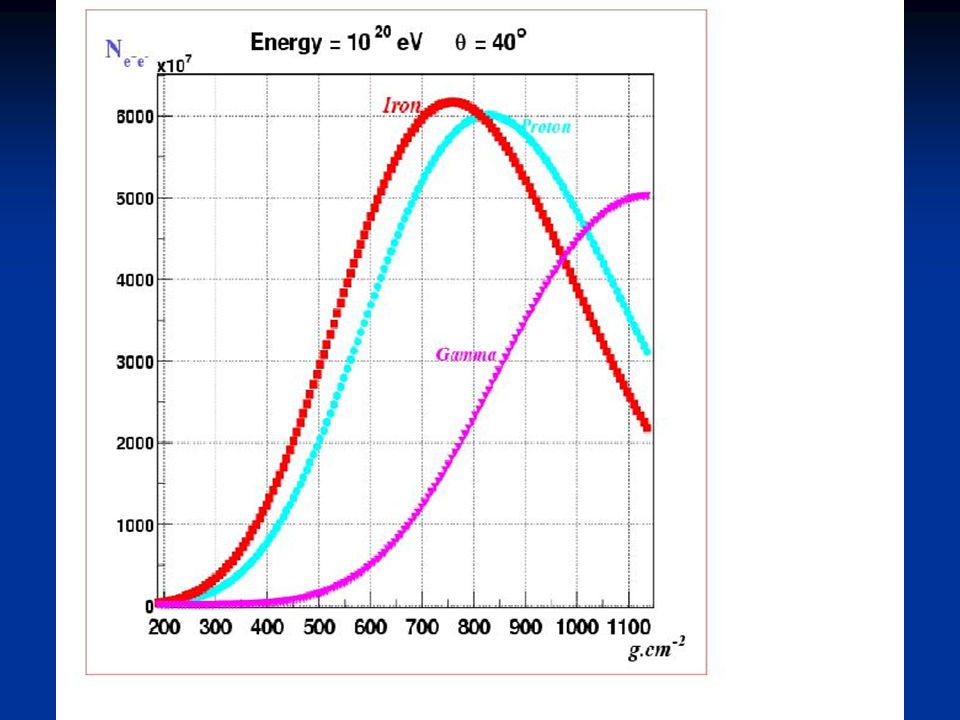
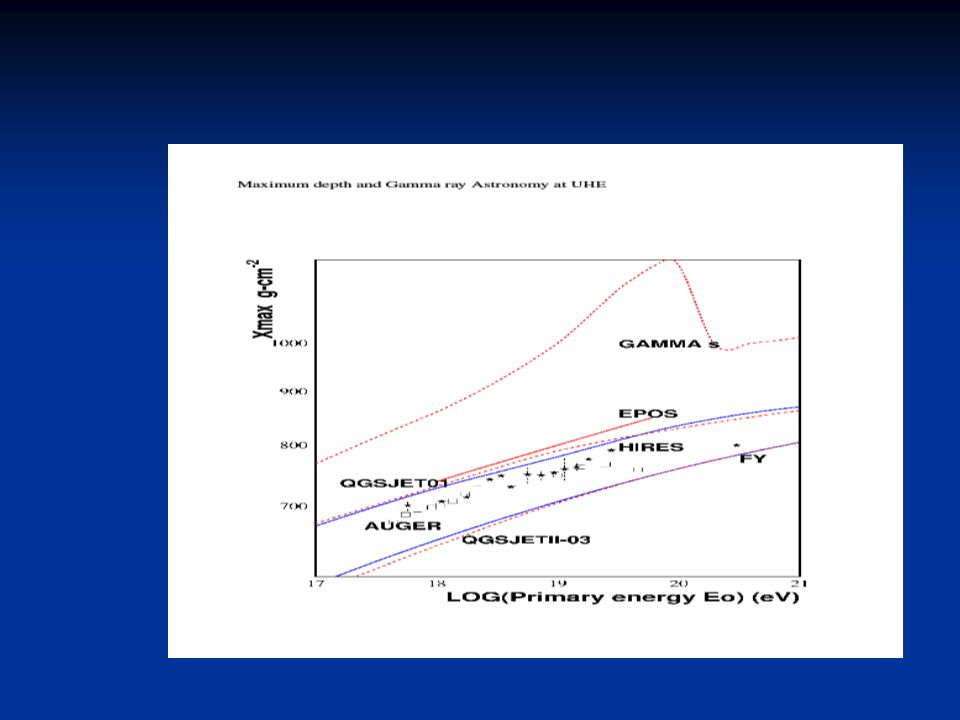
Xmax (g/cm2) and Nmax for p, Fe initiated showers
 and Nmax for p, Fe initiated showers")
5
Geminated Cascades From Centaurus (4 l.y.) From Centaurus (4 l.y.) pair of ’s (10 19 eV) separated by 700 km pair of ’s (10 19 eV) separated by 700 km time delay for a pair p- ( as 1/ L 2, L lorentz factor) time delay for a pair p- ( as 1/ L 2, L lorentz factor) a proton (or n) of 10 20 eV is delayed by 0.6µs a proton (or n) of 10 20 eV is delayed by 0.6µs From spiral arms(6000 l.y) pair of ’s lost ! Time delay for a pair p(or n)- ~ 1ms still interesting in the case of sources analysis possible in JEM-EUSO up to 100 l.y.
- ~ 1ms still interesting in the case of sources analysis possible in JEM-EUSO up to 100 l.y..")
7
Extrapolation des modèles d’interactions hadroniques Première interaction importante donne les caractéristiques générales de la gerbe (Nmax, Xmax et profil latéral) Modèles théoriques sont ajustés sur les données expérimentales Or pas de données au-delà de 1,8 TeV dans le centre de masse (collisions pp) extrapolation Distribution de pseudo-rapidité
 Modèles théoriques sont ajustés sur les données expérimentales Or pas de données au-delà de 1,8 TeV dans le centre de masse (collisions pp) extrapolation Distribution de pseudo-rapidité")
8
Pythia 6.122 A Pythia 6.122 modele 4 Pythia 5.724 Atlas PHOJET 1.11sajet Herwig 5.9 Isajet 7.32 Incertitudes Prédictions pour le LHC à 14 TeV dans le centre de masse Multiplicité entre 70 (Isajet ) et 125 (Pythia 6.122A) Combien de particules ? Quelle énergie emportée par la particule leader

9
Violation du scaling de KNO (1000 collisions) 10 20 eV
 eV")
12
Very large tension for the diquark partners ?

15
1 = 500 g/cm 2 2 = 594 g/cm 2 AGASA conversion 600 600 Treatment of inclined EAS data from surface arrays and GZK prediction Jean Noël CAPDEVIELLE, F.COHEN, B.SZABELSKA, J.SZABELSKI Measured: lateral distribution + direction (θ, φ) Density (600m, θ) Density(600m, 0) Energy That conversion is energy/size independent
 Density (600m, θ) Density(600m, 0) Energy That conversion is energy/size independent")
16
Treatment of inclined EAS data from surface arrays and GZK prediction Jean Noël CAPDEVIELLE, F.COHEN, B.SZABELSKA, J.SZABELSKI Results of CORSIKA simulations show complicated and energy dependent form example: Conversion to ''vertical density''

17
Treatment of inclined EAS data from surface arrays and GZK prediction Jean Noël CAPDEVIELLE, F.COHEN, B.SZABELSKA, J.SZABELSKI How does the conversion to ''vertical density'' work ?

18
Treatment of inclined EAS data from surface arrays and GZK prediction Jean Noël CAPDEVIELLE, F.COHEN, B.SZABELSKA, J.SZABELSKI Cascade theory and CORSIKA simulations results for the highest energies depend on interaction model, but suggest overestimation of energy at AGASA

20
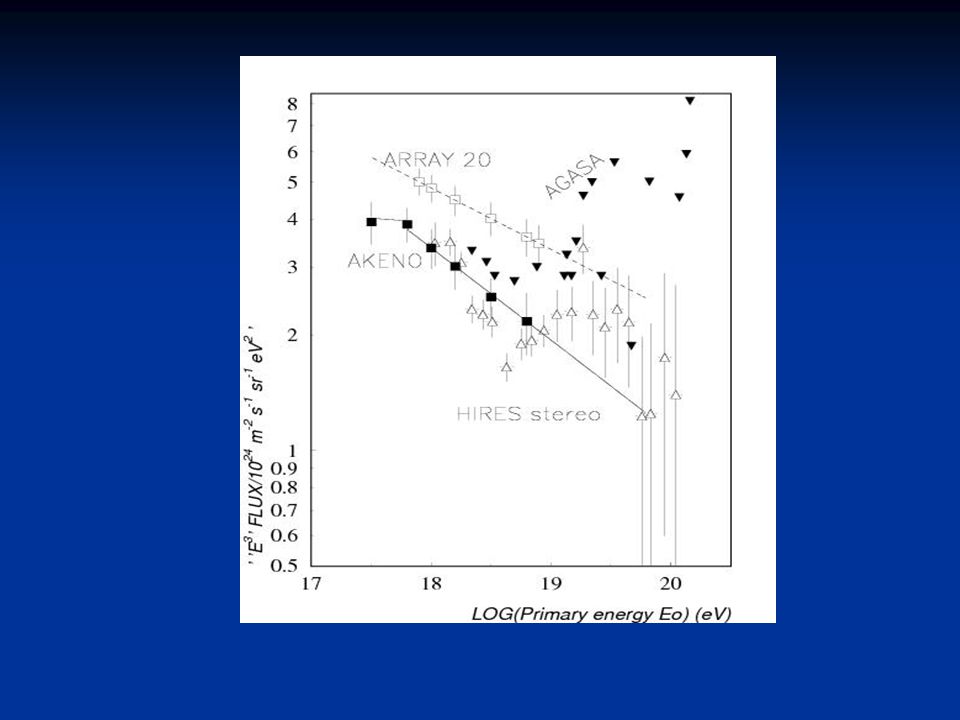
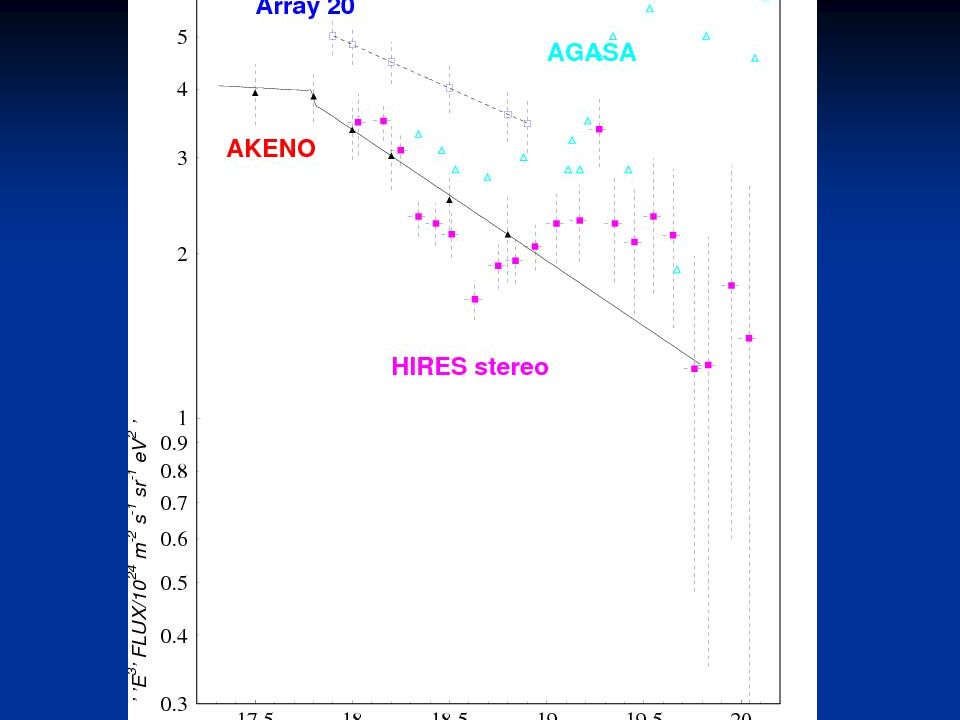
Treatment of inclined EAS data from surface arrays and GZK prediction Jean Noël CAPDEVIELLE, F.COHEN, B.SZABELSKA, J.SZABELSKI From Bergman spectrum to AGASA spectrum using AGASA conversion Grey area: D.R.Bergman et al. (HiRes Collaboration) 29th ICRC, Pune, India, 2005 Red points: AGASA energy spectrum histograms: MC generated spectrum following Bergman approximately recalculated spectrum using AGASA conversion
 29th ICRC, Pune, India, 2005 Red points: AGASA energy spectrum histograms: MC generated spectrum following Bergman approximately recalculated spectrum using AGASA conversion.")
21
Treatment of inclined EAS data from surface arrays and GZK prediction The spectrum from surface array has to be corrected from the overestimation of the primary energy between 10°-35° in the last decade the amended spectrum of AGASA (ISVHECRI aug. 06) is progressing in this direction GZK after 4 decades is going to be confirmed by HIRES, AUGER, AGASA… The overestimation in AGASA data is mainly coming of the special properties of 3D Electromagnetic cascade near maximum, however this correction is small if the distance between maximum and AGASA level is more than 3 c.u. or for heavy composition
 is progressing in this direction GZK after 4 decades is going to be confirmed by HIRES, AUGER, AGASA… The overestimation in AGASA data is mainly coming of the special properties of 3D Electromagnetic cascade near maximum, however this correction is small if the distance between maximum and AGASA level is more than 3 c.u. or for heavy composition.")
25
Signal dans Auger Simulation densité de particules Détecteurs Auger signal en Vertical Equivalent Muons (VEM) Signal (r) = C 1 e+e- (r) + C 2 (r) VEM Des simulations avec géant4 de la cuve d’Auger : C 1 = 0,47 C 2 = 0,9 – 1
 Signal (r) = C 1 e+e- (r) + C 2 (r) VEM Des simulations avec géant4 de la cuve d’Auger : C 1 = 0,47 C 2 = 0,9 – 1")
32
Trans GZK AREA New scales Adequate Advanced Technologies Milesbornes to Quantum Gravity earliest approaches, EUSO and JEM-EUSO

33
EUSO ~ 1000 x AGASA ~ 30 x Auger EUSO (Instantaneous) ~ 5000 x AGASA ~ 150 x Auger AGASA JEM-EUSO tilt-mode JEM-EUSO FoV
 ~ 5000 x AGASA ~ 150 x Auger AGASA JEM-EUSO tilt-mode JEM-EUSO FoV")
34
by Boris Khrenov 2006 Progress of the study of EECR expected in the near future: 4×10 5 JEM-EUSO(nadir) JEM-EUSO (tilt)
 JEM-EUSO (tilt)")
35
Conclusions New chances for Gamma ray Astronomy at UHE from ISS with JEM-EUSO New results of LHC updating the simulation GZK behaviour confirmed but some ambiguities on composition remain Xmax different from Xmax via fluorescence ? Change in p-Air interaction above 3 EeV? New Astrophysics with heavy component at UHE? Crucial period for JEM-EUSO entering in the trans GZK area

Similar presentations


 Pierre Sokolsky University of Utah.>")


 Conclusions Isola.>")

