Download presentation
Presentation is loading. Please wait.

1
LHC-Collider Physics and Simulation for High Energy Cosmic Rays
J. N. Capdevielle, APC, University Paris Diderot

2
Outline General properties of giant EAS The extrapolation at UHE
The treatment of inclined GAS in AGASA The treatment of the vertical energy estimator Amendments of experimental data and general convergence to GZK prediction Mass composition at UHE

3
Hybrid approach to the primary cosmic ray composition
R. Attallah1 and J.N. Capdevielle2 1Physics Department, Univ. of Annaba, Algeria 2APC, Univ. of Paris 7, France

4
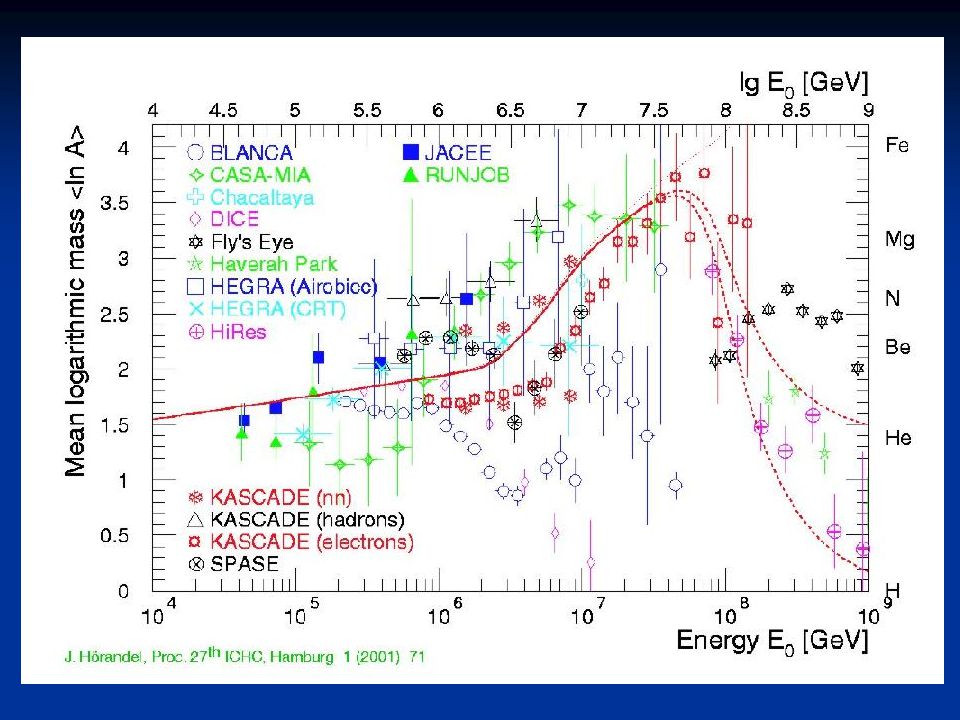
Introduction The chemical composition of primary cosmic rays furnishes crucial clues on their sources; A direct measurement of their high energy component runs out of statistics; Above 1014 eV, observation must resort to indirect method (air shower measurements);
;")
5
Chemical composition Air shower interpretation is hampered by our lack of knowledge of the particle interaction physics; Air showers present very large fluctuations; Classic air shower experiments only sample the air shower at one depth. Extensive fitting and interpolation are needed.

6
A novel technique by IACT
Ground-based detection of the Direct Cherenkov (DC) light emitted by the primary particle; The intensity of this light is proportional to Z 2; Measurement of the energy spectrum for cosmic ray nuclei in the range TeV (H.E.S.S.); Limited energy window.
 light emitted by the primary particle; The intensity of this light is proportional to Z 2; Measurement of the energy spectrum for cosmic ray nuclei in the range TeV (H.E.S.S.); Limited energy window.")
7
(

8
Hybrid detector DC-light detection can be combined with a classic air shower experiment in order to measure on an event-by-event basis: 1. the mass and energy of the primary particle; 2. the particle content of the shower; to test experimentally the different critera used for the identification of primary cosmic rays. to approach the elemental composition around the knee with validated criteria.

9
Monte Carlo calculations
CORSIKA package v (Heck et al. 1998). Two independant high energy hadronic interaction models: 1. QGSJET v. II-03 (Ostapchenko 2006) 2. SIBYLL v. 2.3 (Engel et al. 1999). Fluka model v at low energy (Ferrari et al. 2005).
. Two independant high energy hadronic interaction models: 1. QGSJET v. II-03 (Ostapchenko 2006) 2. SIBYLL v. 2.3 (Engel et al. 1999). Fluka model v at low energy (Ferrari et al. 2005).")
10
Experimental conditions
Primary particles considered: p, N, Fe (vertical). Primary energy: 50 TeV and 200 TeV Observation level at H.E.S.S. altitude (1830 m; g/cm2). Detection energy thresholds: E 300 MeV, Ee 2 MeV 100 showers per run.
. Primary energy: 50 TeV and 200 TeV. Observation level at H.E.S.S. altitude. (1830 m; g/cm2). Detection energy thresholds: E 300 MeV, Ee 2 MeV. 100 showers per run.")
11
Electron lateral distribution

12
Muon lateral distribution

13
Hadron lateral distribution

14
Number of particles (50 TeV)
Muons Hadrons 10 m 20 m Proton 8.8 (8.3) 24.3 (23.2) 6.5 (4.9) 11.1 (8.5) Nitrogen 6.9 (6.9) 21.9 (21.5) 2.5 (2.6) 5.5 (5.3) Iron 4.9 (4.5) 16.6 (14.7) 1.0 (0.8) 2.3
 (23.2) 6.5. (4.9) (8.5) Nitrogen (6.9) (21.5) 2.5. (2.6) 5.5. (5.3) Iron (4.5) (14.7) 1.0. (0.8) 2.3.")
15
Number of particles (200 TeV)
Muons Hadrons 10 m 20 m Proton 40.0 (37.2) 105.4 (97.8) 38.2 (35.4) 62.8 (56.5) Nitrogen 38.0 (33.1) 104.7 (94.7) 20.7 (18.1) 37.6 (32.1) Iron 29.5 (26.0) 89.1 (82.6) 13.0 (9.7) 25.4 (19.8)
 (97.8) (35.4) (56.5) Nitrogen (33.1) (94.7) (18.1) (32.1) Iron (26.0) (82.6) (9.7) (19.8)")
16
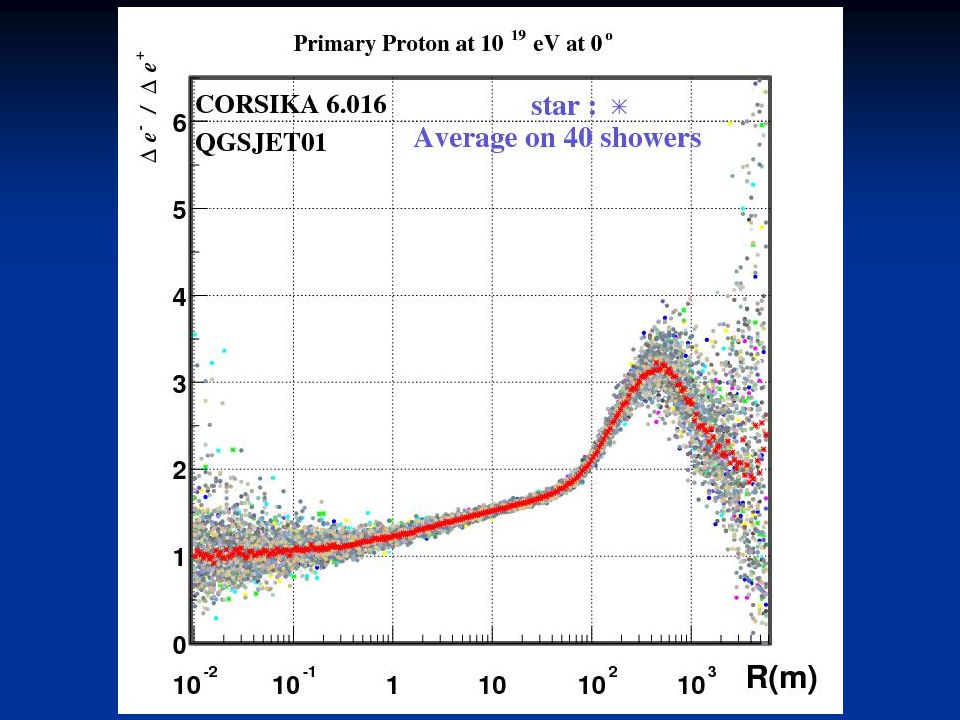
Electrons vs. positrons

17
Electron size

18
Muon size

19
Primary Energy

20
Conclusion DC-light detection can be combined with a classic air shower experiment. Such a hybrid detector is able to test the different criteria used for primary cosmic ray identification. Validated criteria can be used to study the cosmic ray compostion around the knee.

24
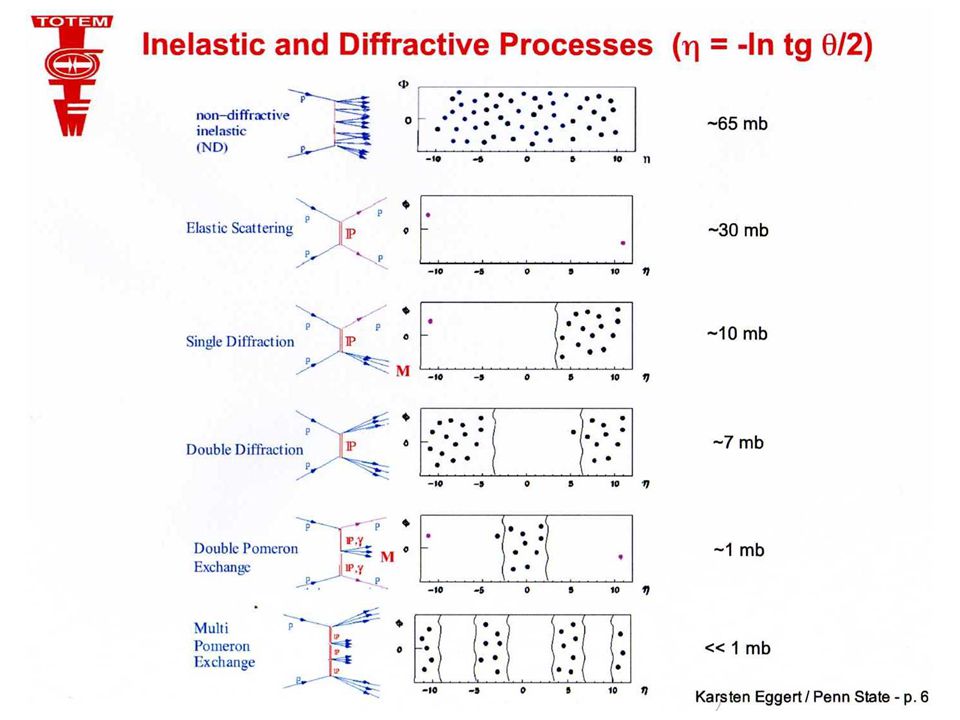
Total p-p Cross-Section
~ ln2 s Current models predictions: mb Aim of TOTEM: ~1% accuracy COMPETE Collaboration fits all available hadronic data and predicts: LHC: [PRL (2002)]
]")
26
Acceptance All detectors with trigger capability
non-diffractive minimum bias events dNch/dh [1/unit] Energy(GeV) per event Charged particles per event single-diffractive events = - ln tg All detectors with trigger capability Trigger acceptance > 95% for all inelastic events
 per event. Charged particles. per event. single-diffractive events. = - ln tg All detectors with trigger capability. Trigger acceptance > 95% for all inelastic events.")
32
Concorde Fox Charlie, Roissy, Octobre 78 Une centaine d’AR Paris New York pour exposer à 17000m d’altitude deux chambres à émulsion (pendant 270H).
.")
33
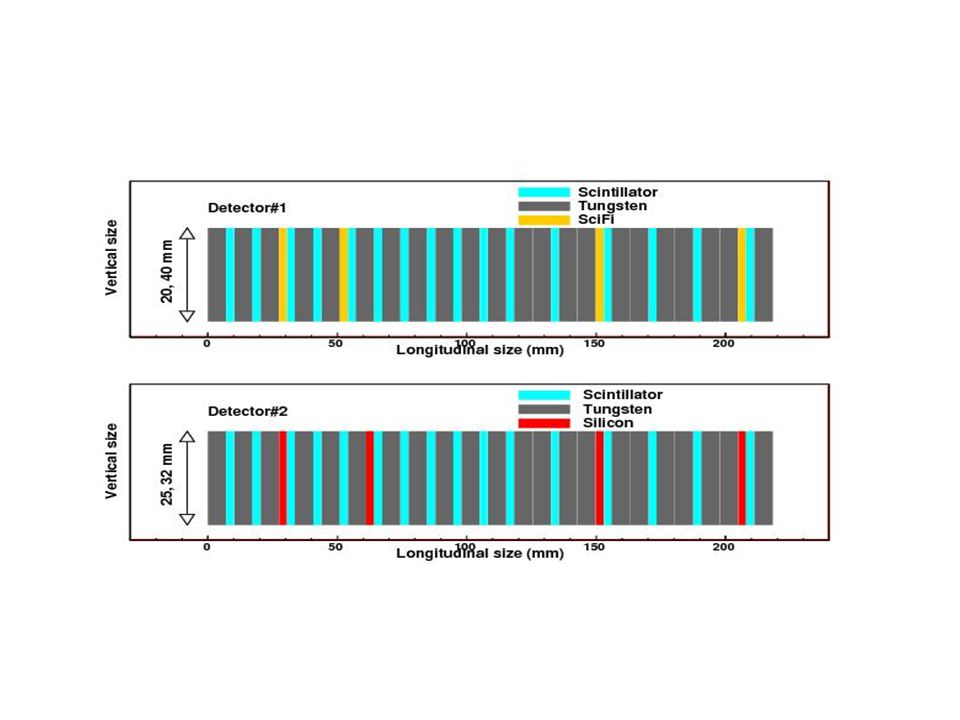
Chambers for Balloon and Airborne Experiments
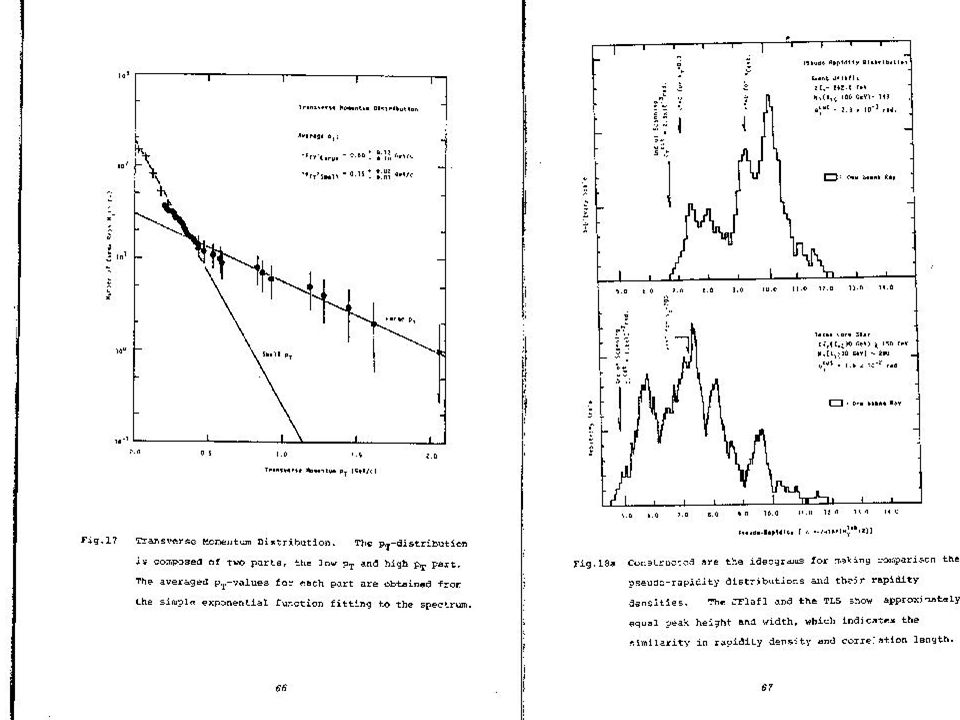
Evis=E(h)+E Energy threshold Stratospheric 200 GeV Mountain altitude 2-4 TeV Particle physics observed in XREC - n, E, <r>, < E r> nch, EH, <rH>, < EH rH> - Energy and PT distributions - pseudorapidity distributions - dN/d=f() - correlations <PT>, dN/d (more or less completely) - direct interaction in the chambers - near direct interactions with localized origin
+E Energy threshold. Stratospheric 200 GeV. Mountain altitude 2-4 TeV. Particle physics observed in XREC. - n, E, <r>, < E r> nch, EH, <rH>, < EH rH> - Energy and PT distributions. - pseudorapidity distributions. - dN/d=f() - correlations <PT>, dN/d (more or less completely) - direct interaction in the chambers. - near direct interactions with. localized origin.")
34
CERN Courier Octobre 1981 Début des expériences Octobre 1978
Une collision de 106 GeV (forte multiplicité, spikes dans la distribution de pseudo-rapidité)
")
36
Chambres à émulsion sur Concorde
Impact d ’un photon de 200 TeV, l ’un des 211 g d ’une collision de 107 GeV. Evènement à émission coplanaire. 50ch sur A H 500 p 1PeV, PeV 250 familles g , 10 PeV , 3 au LHC (100 PeV)
")
38
JF2af2 (Concorde) Xray film under 8 c.u.
Lego plot with the 4 most energetic Gamma ’s

39
Jf2af2 (Concorde) 34 g ’s aligned about 50% of the visible energy
 34 g ’s aligned about 50% of the visible energy")
41
Very large tension for the diquark partners ?

42
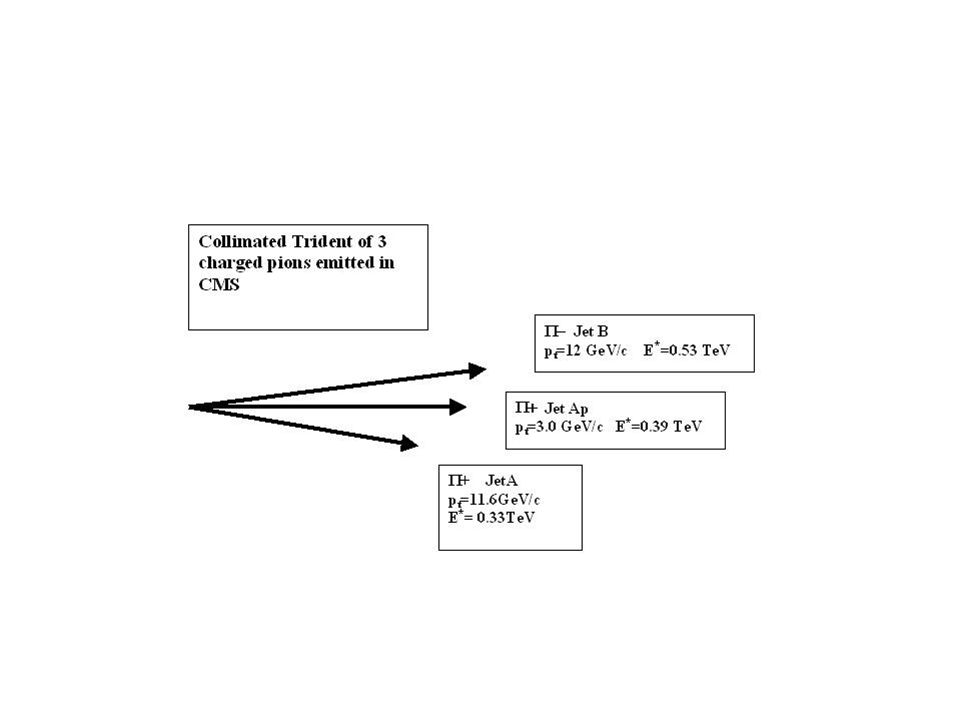
3 most energetic clusters in JF2af2

43
One possible configuration
External ’s and total <ER> factors indicate a common origin under 2.2km above the chamber Like in Strana, we need pt ‘ s > 10 GeV/c for the emission of 3 high energy hadrons generating A, Ap, B Threshold energy for valence quarks in alignment ~200 GeV in c.m.s.(proton of 1016 eV in Lab)
")
45
Most energetic events above LHC energy
Tadjikistan Andromeda Fianit normal hadron and g ’s content reproduced with CORSIKA (1500 g ’s in Fianit, but few chances to reproduce the 10 PeV g ’s in the halo)
")
46
ANDROMEDA

48
TADJIKISTAN

49
Comment Coplanar emission , even if partly explained by fluctuations, needs more attention p-A and A-A collisions have to be considered, for peripheral collisions (RHIC results) to point out QGP signatures in spikes or very large Pt .Semi inclusive data consequences may be important New experiements(LHC energy, forward region) with emulsion bricks can be performed with air cargo liners and at mountain altitude
 to point out QGP signatures in spikes or very large Pt .Semi inclusive data consequences may be important. New experiements(LHC energy, forward region) with emulsion bricks can be performed with air cargo liners and at mountain altitude.")
53
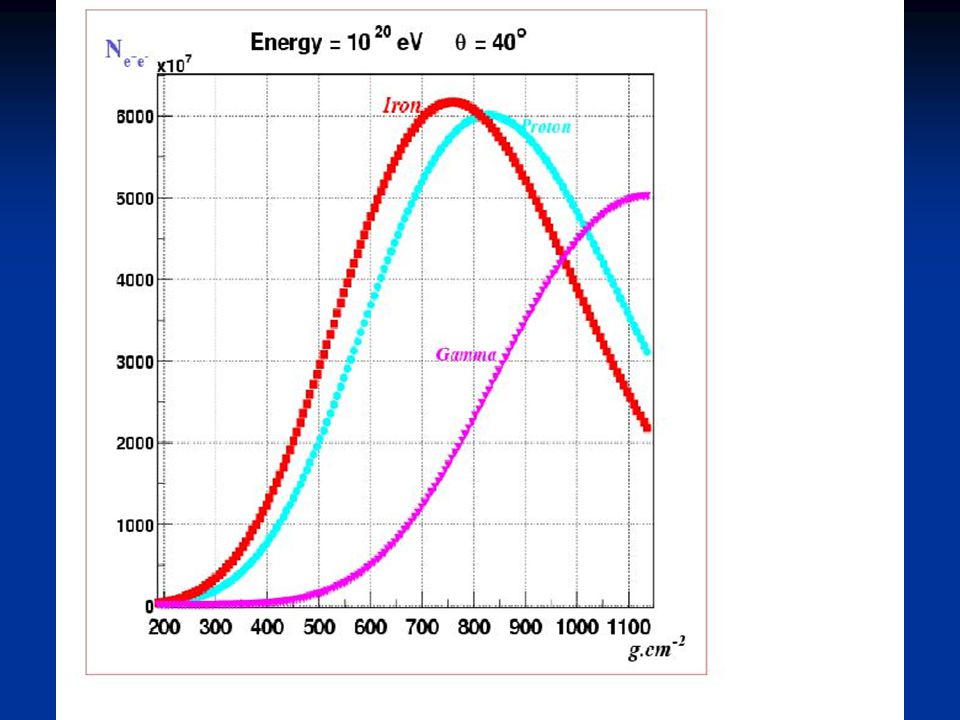
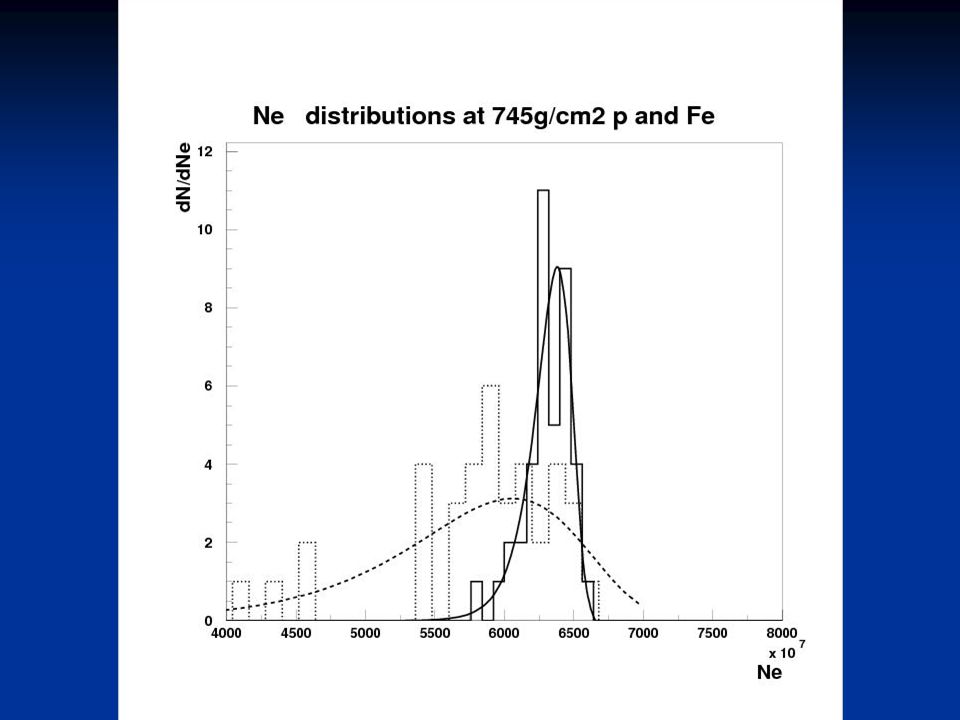
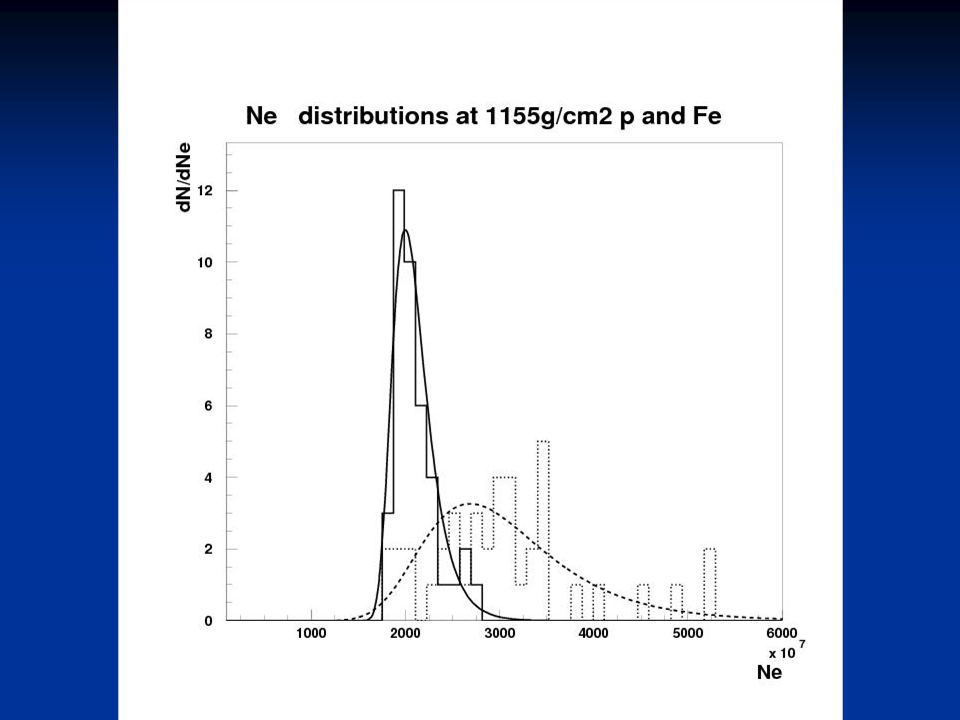
Xmax (g/cm2) and Nmax for p, Fe initiated showers
 and Nmax for p, Fe initiated showers")
55
Propagation : coupure GZK
Greisen, Zatsepin, Kuzmin Interaction des hadrons avec le fond de photons à 3K (CMB) Eseuil = 70 EeV protons Les sources doivent être proches !
 Eseuil = 70 EeV. protons. Les sources doivent être proches !")
56
Treatment of inclined EAS data from surface arrays and GZK prediction
Jean Noël CAPDEVIELLE, F.COHEN, B.SZABELSKA, J.SZABELSKI Georgi Timofeevich Zatsepin (2006) Vadim Alekseyevich Kuzmin (2006)
 Vadim Alekseyevich. Kuzmin (2006)")
57
Individual showers

58
Fonction Gaussienne hypergéométrique
f(x) = Ne x s-a (1+x) s-b(1+d.x)-c Électrons Avec x = r / r0 et d = r0 / r1 f(x) = N x - (1+x)-(-)(1+.x)- Muons Avec x = r / r’0 et = r’0 / r’1 À angle fixe, il va falloir ajuster les paramètres : a, b, c, r0, r1, , , , r’0 et r’1 Ne , N et “s” sont donnés par la simulation
 = Ne x s-a (1+x) s-b(1+d.x)-c. Électrons. Avec x = r / r0 et d = r0 / r1. f(x) = N x - (1+x)-(-)(1+.x)- Muons. Avec x = r / r’0 et = r’0 / r’1. À angle fixe, il va falloir ajuster les paramètres : a, b, c, r0, r1, , , , r’0 et r’1. Ne , N et s sont donnés par la simulation.")
59
Résultats des ajustements

60
Résultats des ajustements

63
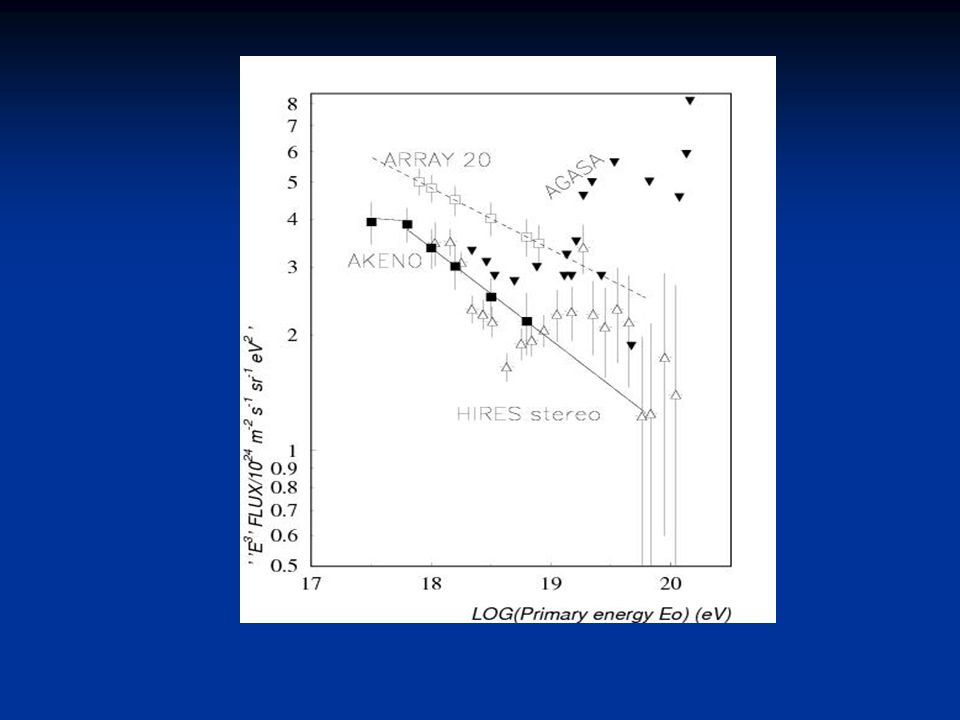
Differential Primary Energy Spectrum of Cosmic Rays
Isotropic distribution of sources

65
Treatment of inclined EAS data from surface arrays and GZK prediction
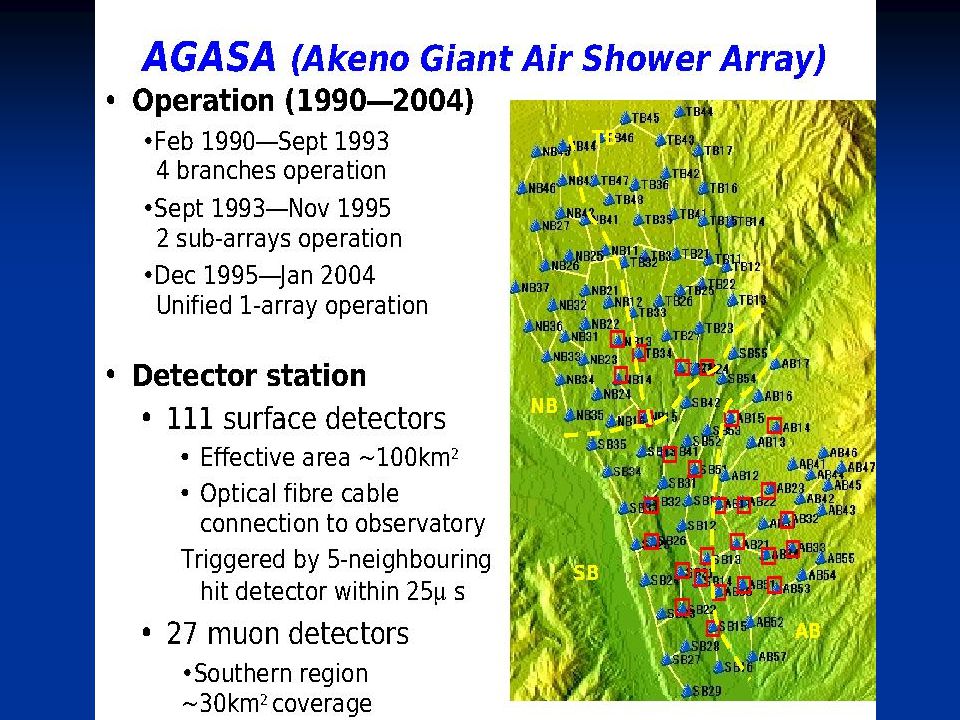
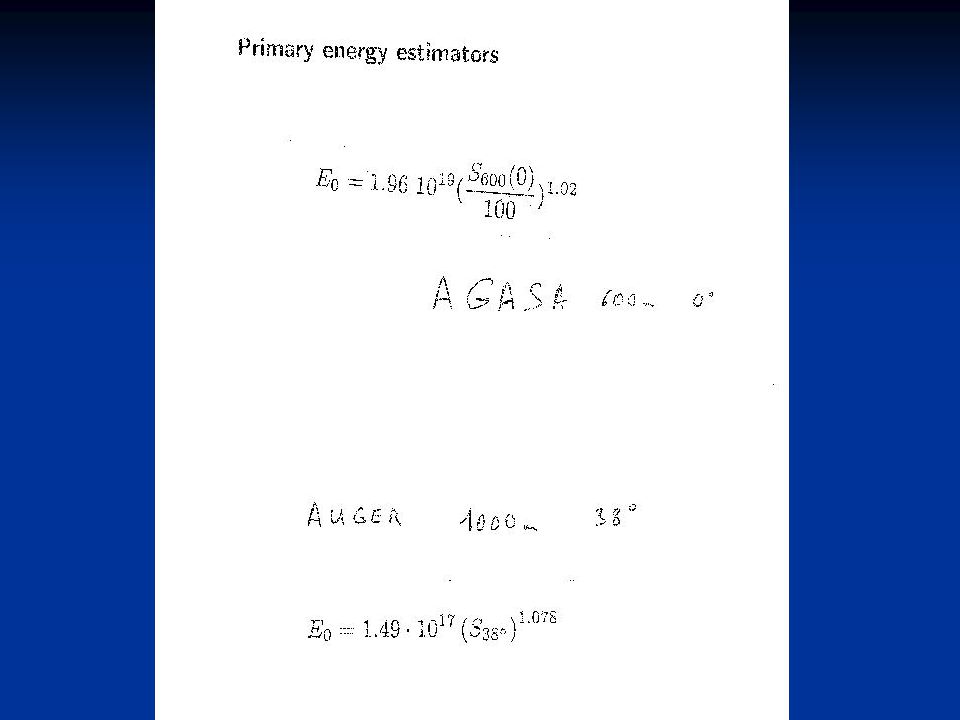
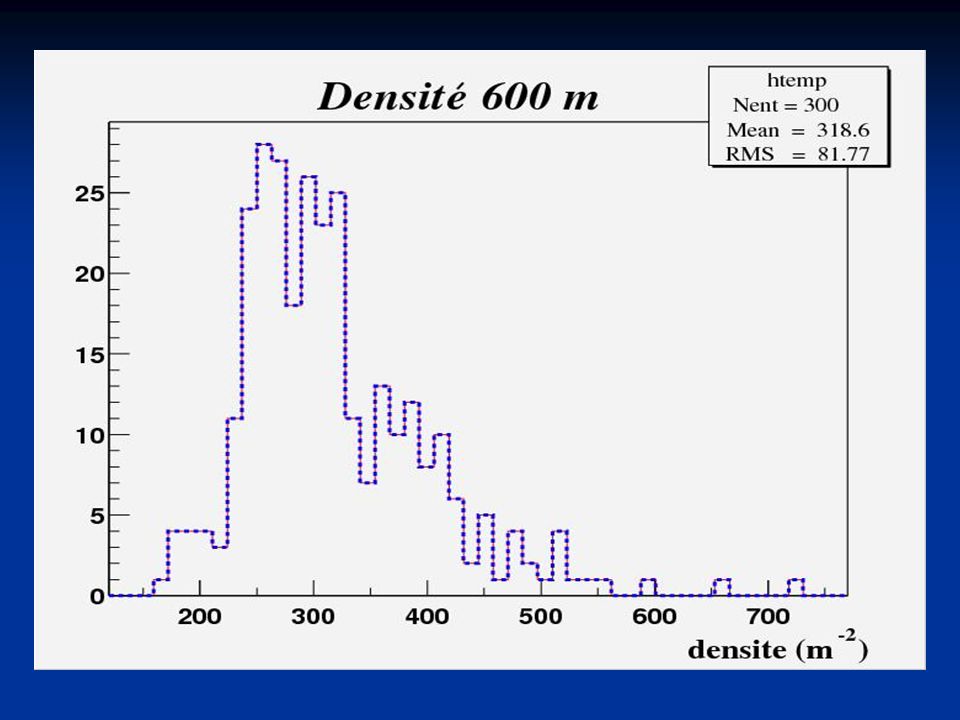
Jean Noël CAPDEVIELLE, F.COHEN, B.SZABELSKA, J.SZABELSKI Measured: lateral distribution + direction (θ, φ) Density (600m, θ) Density(600m, 0) Energy AGASA conversion 600 600: 1 = 500 g/cm2 2 = 594 g/cm2 That conversion is energy/size independent
 Density (600m, θ) Density(600m, 0) Energy. AGASA conversion 600 600: 1 = 500 g/cm2 2 = 594 g/cm2. That conversion is energy/size independent.")
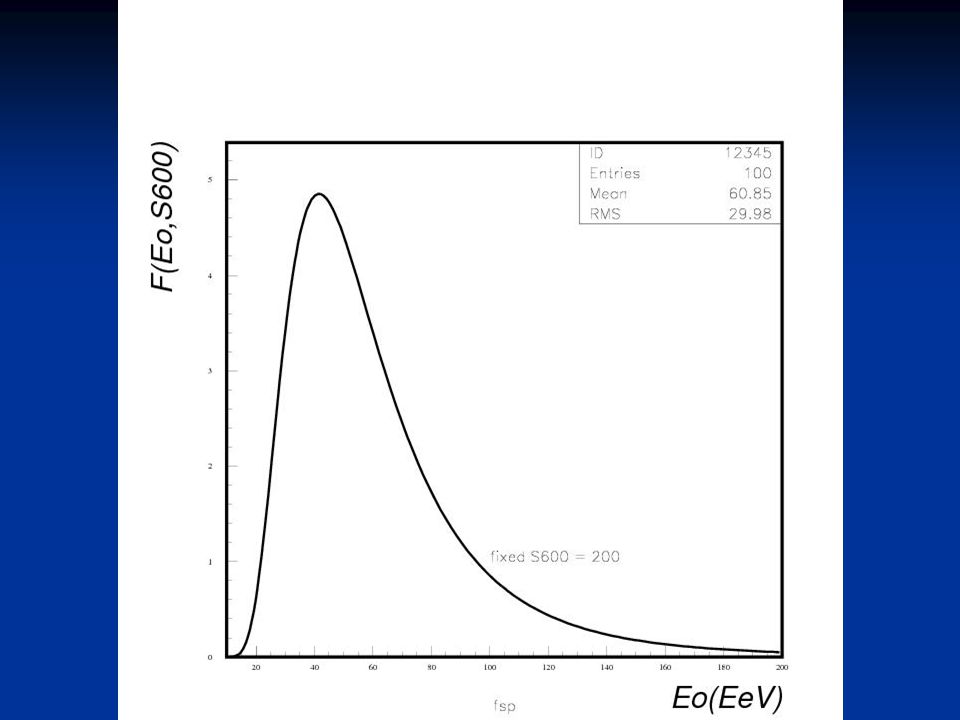
67
Treatment of inclined EAS data from surface arrays and GZK prediction
Jean Noël CAPDEVIELLE, F.COHEN, B.SZABELSKA, J.SZABELSKI Conversion to ''vertical density'' example: Results of CORSIKA simulations show complicated and energy dependent form

68
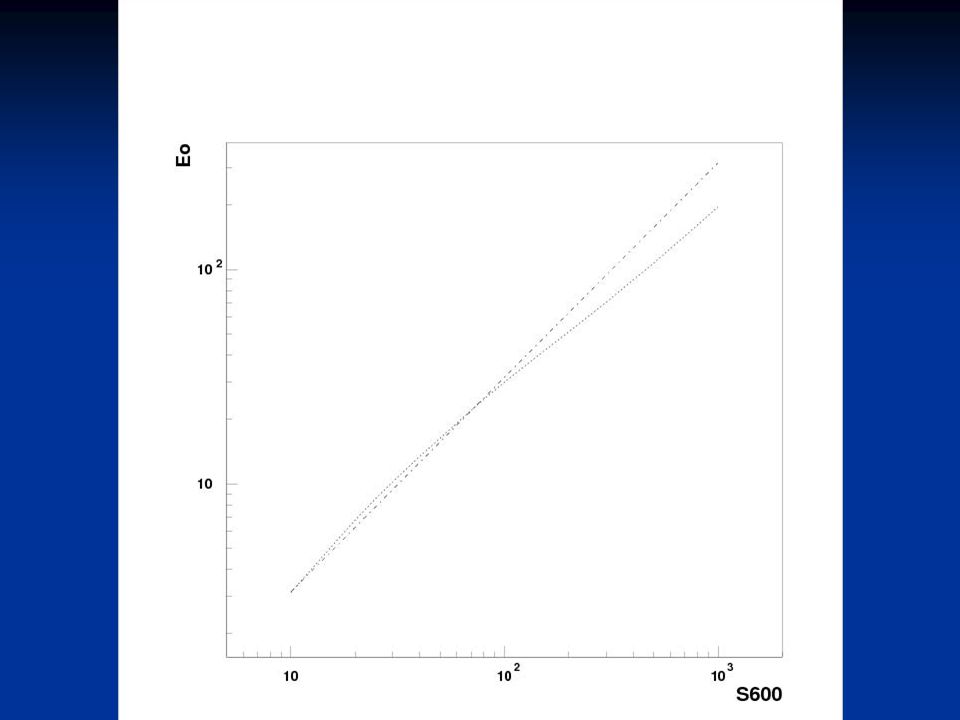
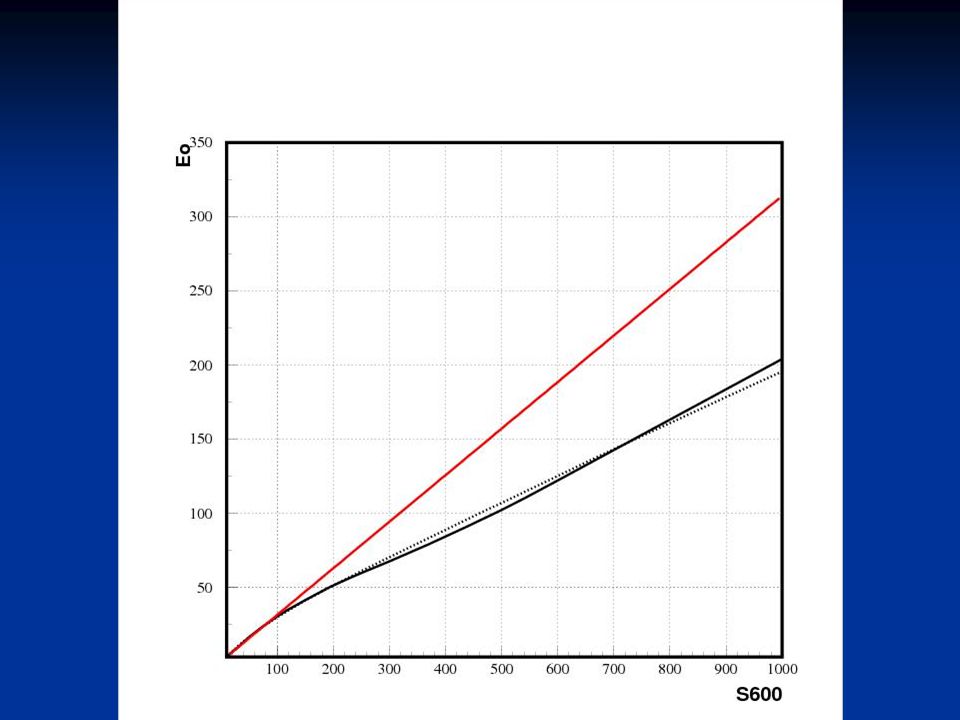
Treatment of inclined EAS data from surface arrays and GZK prediction
Jean Noël CAPDEVIELLE, F.COHEN, B.SZABELSKA, J.SZABELSKI Cascade theory and CORSIKA simulations results for the highest energies depend on interaction model, but suggest overestimation of energy at AGASA

70
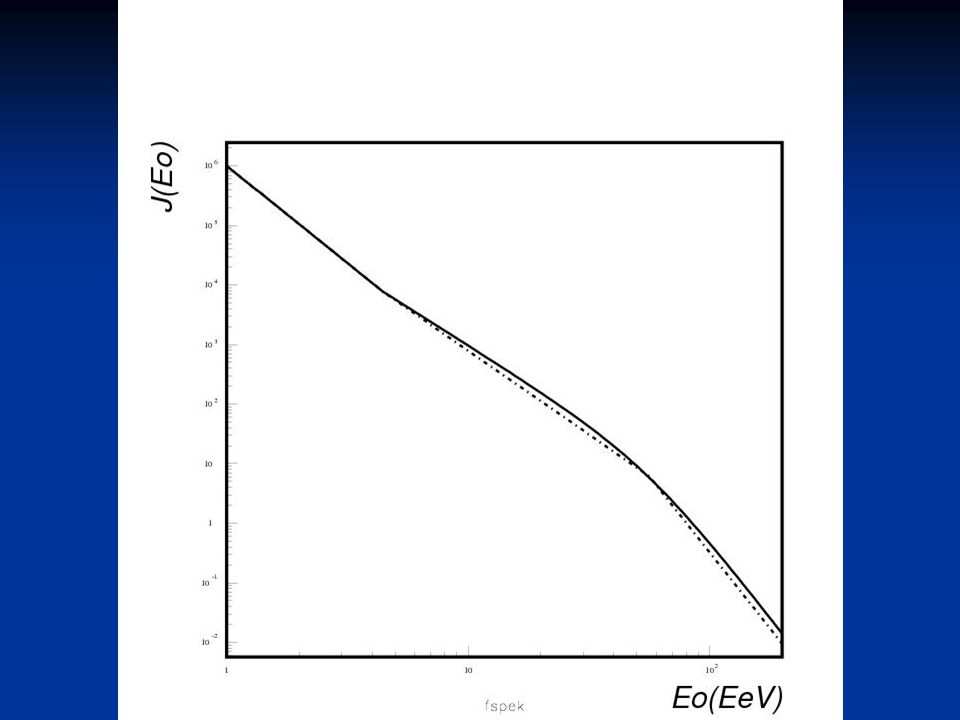
Treatment of inclined EAS data from surface arrays and GZK prediction
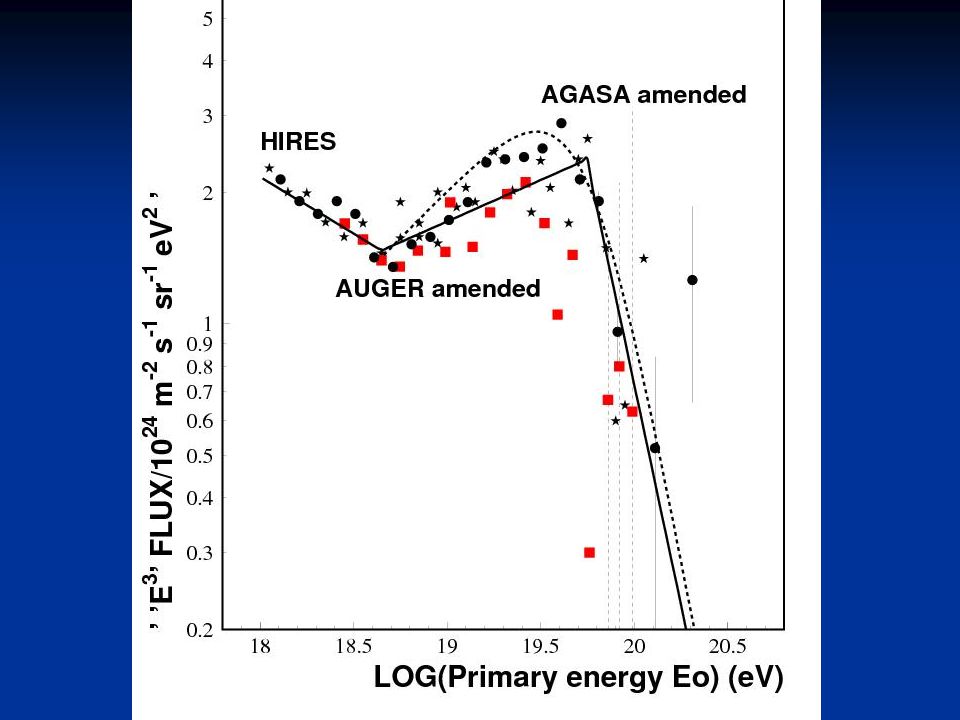
Jean Noël CAPDEVIELLE, F.COHEN, B.SZABELSKA, J.SZABELSKI From Bergman spectrum to AGASA spectrum using AGASA conversion Red points: AGASA energy spectrum Grey area: D.R.Bergman et al. (HiRes Collaboration) 29th ICRC, Pune, India, 2005 histograms: MC generated spectrum following Bergman approximately recalculated spectrum using AGASA conversion
 29th ICRC, Pune, India, histograms: MC generated spectrum following Bergman. approximately recalculated spectrum using AGASA conversion.")
71
Treatment of inclined EAS data from surface arrays and GZK prediction
Jean Noël CAPDEVIELLE, F.COHEN, B.SZABELSKA, J.SZABELSKI How does the conversion to ''vertical density'' work ?

76
Treatment of inclined EAS data from surface arrays and GZK prediction
The spectrum from surface array has to be corrected from the overestimation of the primary energy between 10°-35° in the last decade the amended spectrum of AGASA (ISVHECRI aug. 06) is progressing in this direction GZK after 4 decades is going to be confirmed by HIRES, AUGER, AGASA… The overestimation in AGASA data was mainly coming of the special properties of 3D Electromagnetic cascade near maximum
 is progressing in this direction. GZK after 4 decades is going to be confirmed by HIRES, AUGER, AGASA… The overestimation in AGASA data was mainly coming of the special properties of 3D Electromagnetic cascade near maximum.")
102
JEM-EUSO FoV EUSO ~ 1000 x AGASA ~ 30 x Auger
EUSO (Instantaneous) ~ 5000 x AGASA ~ 150 x Auger JEM-EUSO tilt-mode AGASA
 ~ 5000 x AGASA. ~ 150 x Auger. JEM-EUSO tilt-mode. AGASA.")
103
Principle of EUSO - first remote-sensing from space, opening a new window for the highest energy regime TPC-like natural chamber 1020 eV Cf: Ground-based arrays < 100 EUSO Scintillator array,(2)Fluorescence telescope array From College de France: better data now
Fluorescence telescope array. From College de France: better data now.")
104
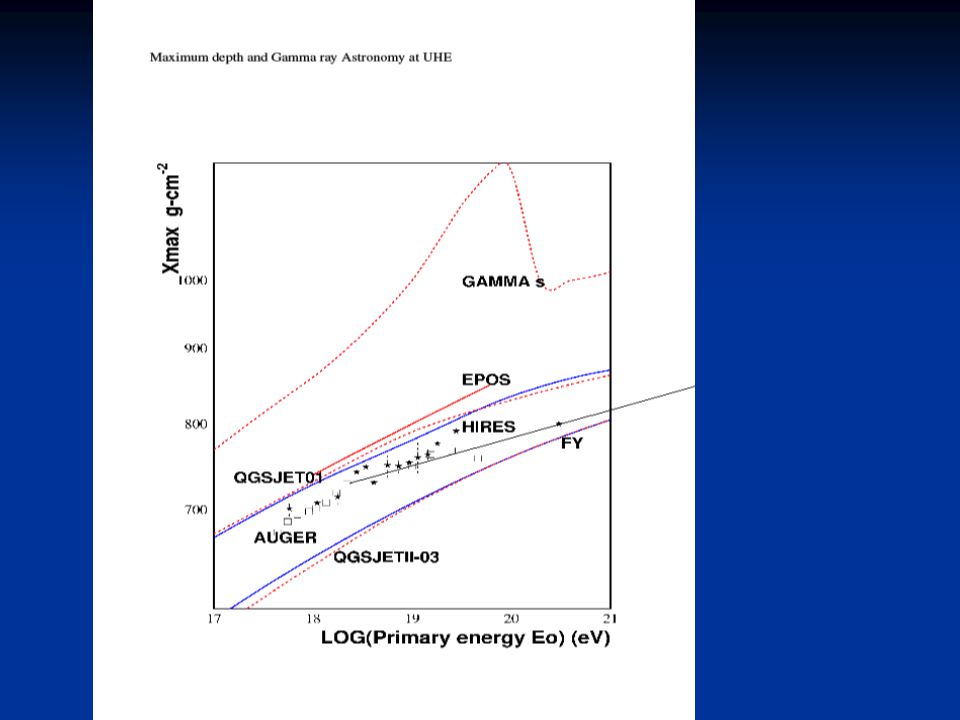
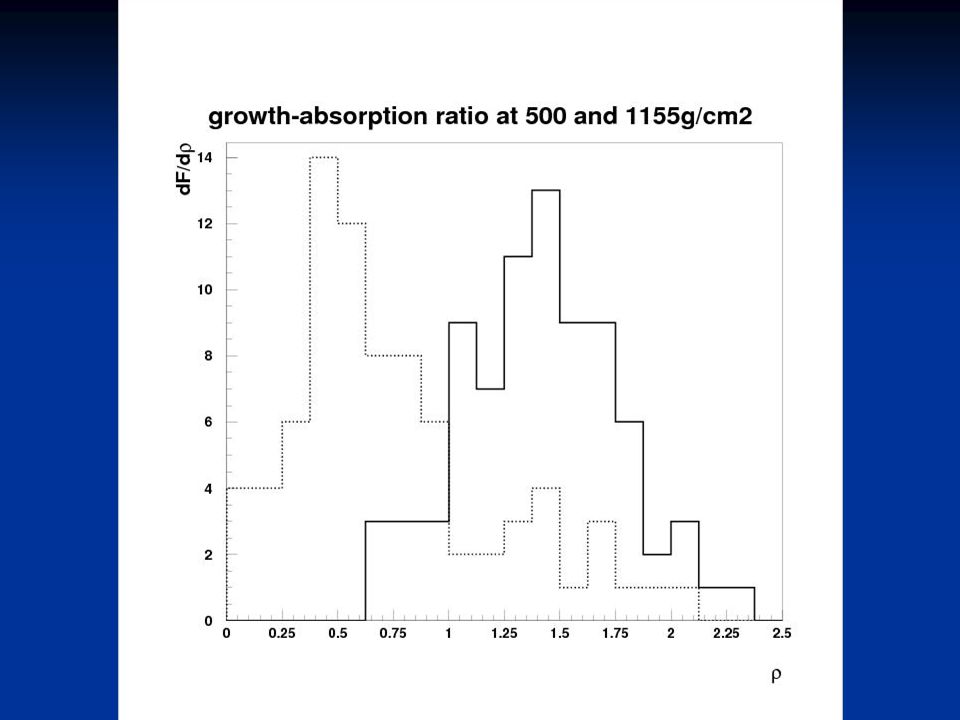
Conclusions New chances for Proton &Gamma ray Astronomy at UHE from ISS with JEM-EUSO New results of LHC updating the simulation GZK tendancies confirmed after specific treatment of inclined EAS and particular procedure in the conversion of vertical signal to primary energy. Xmax behaviour and change in p-Air interaction above 3 EeV? Ratio of light at 500g/cm2 to 1100g/cm2 depends on mass (in favour of p composition at UHE for HIRES

106
Ne t G.COCCONI, 1961 De r

107
Cascade électromagnétique (NKG)
")
108
Signal (r) = C1 e+e- (r) + C2 (r)
Signal dans Auger Simulation densité de particules Détecteurs Auger signal en Vertical Equivalent Muons (VEM) Signal (r) = C1 e+e- (r) + C2 (r) VEM Des simulations avec géant4 de la cuve d’Auger : C1 = 0,47 C2 = 0,9 – 1
 Signal (r) = C1 e+e- (r) + C2 (r) VEM. Des simulations avec géant4 de la cuve d’Auger : C1 = 0,47. C2 = 0,9 – 1.")
109
Trans GZK AREA New scales Adequate Advanced Technologies
Milesbornes to Quantum Gravity earliest approaches, EUSO and JEM-EUSO

110
Astronomie proton 1000 evts à répartir sur un certain nombre de sources éventuelles avec leur spectre respectif

112
LPM effect Maximum deeper in atmosphere for pure e.m. cascades
trigger more difficult for registration of near vertical e.m. cascade with surface arrays

116
Total p-p Cross-Section
~ ln2 s Current models predictions: mb Aim of TOTEM: ~1% accuracy COMPETE Collaboration fits all available hadronic data and predicts: LHC: [PRL (2002)]
]")
117
Extrapolation des modèles d’interactions hadroniques
Distribution de pseudo-rapidité Première interaction importante donne les caractéristiques générales de la gerbe (Nmax, Xmax et profil latéral) Modèles théoriques sont ajustés sur les données expérimentales Or pas de données au-delà de 1,8 TeV dans le centre de masse (collisions pp) extrapolation
 Modèles théoriques sont ajustés. sur les données expérimentales. Or pas de données. au-delà de 1,8 TeV. dans le centre de masse (collisions pp) extrapolation.")
118
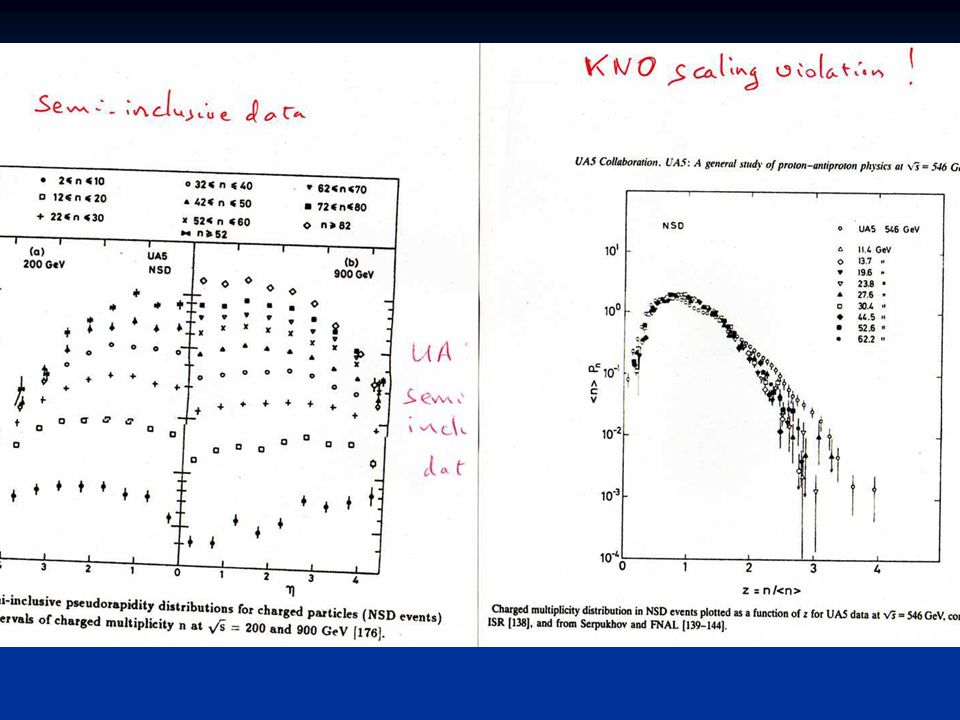
Distribution de pseudo-rapidité
Incertitudes Distribution de pseudo-rapidité Pythia A Pythia modele 4 Pythia Atlas PHOJET 1.11sajet Herwig 5.9 Isajet 7.32 Prédictions pour le LHC à 14 TeV dans le centre de masse Multiplicité entre 70 (Isajet ) et 125 (Pythia 6.122A) Combien de particules ? Quelle énergie emportée par la particule leader
 et 125 (Pythia 6.122A) Combien de particules Quelle énergie emportée par. la particule leader.")
120
Violation du scaling de KNO (1000 collisions) 1020 eV
 1020 eV")
Similar presentations


 J. N. Capdevielle, APC, University Paris Diderot>")


 Conclusions Isola.>")


