Download presentation
Presentation is loading. Please wait.

1
Energy and the New Reality, Volume 1: Energy Efficiency and the Demand for Energy Services Chapter 6: Industrial Energy Use L. D. Danny Harvey harvey@geog.utoronto.ca harvey@geog.utoronto.ca This material is intended for use in lectures, presentations and as handouts to students, and is provided in Powerpoint format so as to allow customization for the individual needs of course instructors. Permission of the author and publisher is required for any other usage. Please see www.earthscan.co.uk for contact details. www.earthscan.co.uk Publisher: Earthscan, UK Homepage: www.earthscan.co.uk/?tabid=101807www.earthscan.co.uk/?tabid=101807

2
Major Industrial Sectors - Iron & Steel - Aluminum - Copper - Cement - Glass - Pulp & Paper - Plastics - Petroleum refining - Chemicals (including fertilizers – Chapter 7) - Food processing (Chapter 7) - General manufacturing
 - Food processing (Chapter 7) - General manufacturing")
3
Figure 6.1 Industrial Energy use in 2005 as a percent of total energy use in various regions

4
Figure 6.2a Industrial energy use in OECD countries in 2005

5
Figure 6.2b Industrial energy use in non-OECD countries

6
Figure 6.3 Global primary energy use for production of the 12 commodities (other than the production of fuels) using the most energy
 using the most energy")
7
Definitions : Primary metals: made from virgin ores (raw materials) Secondary metals: recycled from scrap Feedstock energy: The energy content of fossil fuels that become part of the material in a commodity. It is equal to the heating value of the final product. Process energy: energy (in the form of heat or electricity) used to power a chemical transformation. It is equal to the total energy inputs to the production process minus the embodied energy of the final products Embodied energy: the total amount of energy (process + feedstock) that went into making something
 used to power a chemical transformation. It is equal to the total energy inputs to the production process minus the embodied energy of the final products Embodied energy: the total amount of energy (process + feedstock) that went into making something.")
8
Overview of global production of major commodities of energy interest

9
Figure 6.4: Trends in production of major commodities (solid lines use the left scale, dashed lines the right scale)
")
10
Processing of Minerals Most minerals of interest occur as oxide minerals in ores (rock bodies with various minerals mixed together, besides the ones of interest) The steps in processing minerals are thus – separation of the minerals of interest from the other minerals in the ores - removal of oxygen (reduction) - purification
 The steps in processing minerals are thus – separation of the minerals of interest from the other minerals in the ores - removal of oxygen (reduction) - purification")
11
Reduction of oxide minerals, calcination of CaCO 3 (during production of cement), and processing of silica and limestone to make glass all release CO 2 Iron: 2Fe 2 O 3 +3C → 4Fe+3CO 2 Alumina (made first from bauxite): 2Al 2 O 3 + 3C → 4Al+3CO 2 Cuprite (produced by roasting Cu-containing minerals): 2CuO+C→2Cu+CO 2
, and processing of silica and limestone to make glass all release CO 2 Iron: 2Fe 2 O 3 +3C → 4Fe+3CO 2 Alumina (made first from bauxite): 2Al 2 O 3 + 3C → 4Al+3CO 2 Cuprite (produced by roasting Cu-containing minerals): 2CuO+C→2Cu+CO 2")
12
Calcination of limestone to make cement: CaCO 3 →CaO+CO 2 Production of glass: nSiO 2 + mCaCO 3 + xNa 2 CO 3 +.... → Glass + CO 2

13
In the case of iron, aluminum and copper, the C used for reduction comes from fossil fuel inputs, or from materials (such as C anodes) made from fossil fuels, and so is accounted for in the energy use data combined with the emission factors (kgC/kg fuel) for these energy inputs. Thus, fossil fuel energy inputs play two roles in producing Fe, Al, or Cu – as a source of C for the reduction reaction and as a source of heat (through combustion) to drive the reaction.
 to drive the reaction..")
14
In the case of calcination of limestone or transformation of raw materials into glass, however, the C that is released as CO 2 comes from the raw materials themselves and so is not accounted for in the energy use data. Thus, you will find that national CO 2 emission data are given separately for coal, oil, natural gas, and production of cement. This latter category refers to the CO 2 that is produced through the chemical reactions involved in the formation of cement, and is in addition to the CO 2 released from burning the fossil fuels used at the cement plants.

15
Chemical emissions from the production of glass are only about 1% of those from cement (due to about 30 times less global production and a 3 times smaller emission factor), and tend to be ignored in compilations of national emissions.
, and tend to be ignored in compilations of national emissions.")
16
Iron and Steel

17
Figure 6.5a: World production of primary + secondary raw steel

18
Figure 6.5b: Production of raw steel in 2007

19
Figure 6.5c End uses of steel in the US in 2003

20
Figure 6.6 Anthropogenic iron flows in 2000 (Tg Fe/yr) Source: Wang et al (2007, Environmental Science and Technology 41, 5120–5129)
 Source: Wang et al (2007, Environmental Science and Technology 41, 5120–5129)")
21
Traditional Steps in Making Steel: Beneficiation of iron ores (removal of impurities) Agglomeration of fine particles Reduction of iron ore to make crude iron Refining of crude iron to make steel (removing impurities, adding trace elements) Shaping of steel into final products
 Agglomeration of fine particles Reduction of iron ore to make crude iron Refining of crude iron to make steel (removing impurities, adding trace elements) Shaping of steel into final products")
22
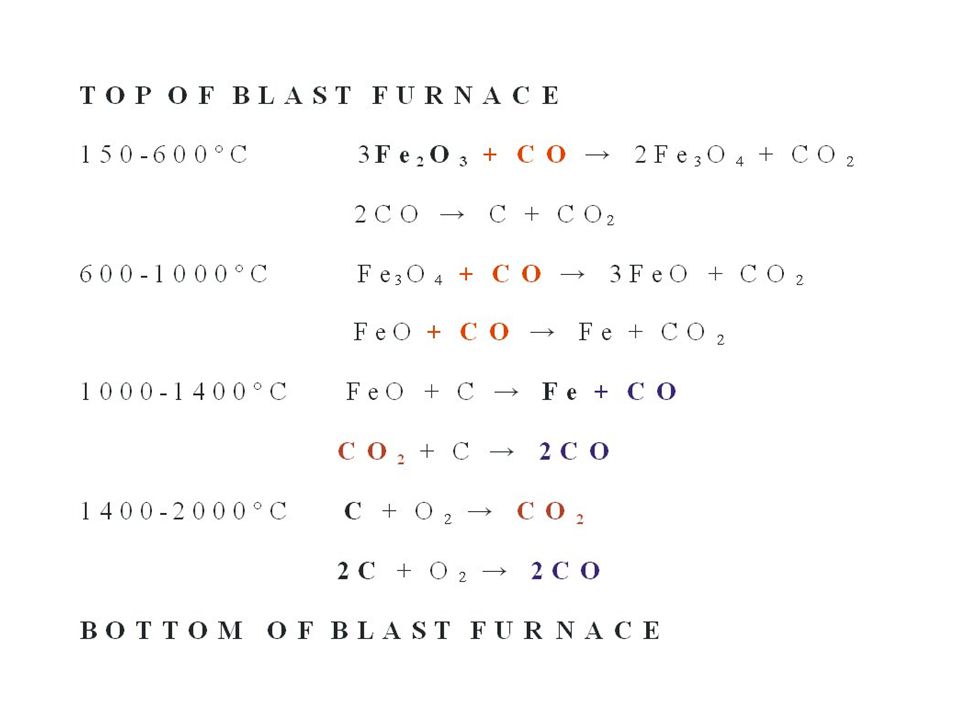
Reduction of iron ore Commonly done in a blast furnace C from coke (which is like charcoal, and made from coal by driving off volatile materials) is used as a reducing agent Theoretical minimum energy requirement is 6.8 GJ/t Practical lower limit is 10 GJ/t, best blast furnaces use about 12 GJ/y, world average is about 14.4 GJ/t Coke provides some of the heat energy required (as well as serving as a reducing agent), with the balance supplied by coal
 is used as a reducing agent Theoretical minimum energy requirement is 6.8 GJ/t Practical lower limit is 10 GJ/t, best blast furnaces use about 12 GJ/y, world average is about 14.4 GJ/t Coke provides some of the heat energy required (as well as serving as a reducing agent), with the balance supplied by coal")
24
Refining of crude iron 3 options are: Open-hearth furnace, Basic Oxygen Furnace (BOF), Electric air furnace (EAF) BOF requires pure oxygen (separated from air) EAF is used for scrap metal and in the new direct-reduction process Energy by EAFs per tonne of steel fell in half between 1960-1900
, Electric air furnace (EAF) BOF requires pure oxygen (separated from air) EAF is used for scrap metal and in the new direct-reduction process Energy by EAFs per tonne of steel fell in half between")
25
Figure 6.7 Refining of reduced iron to produce steel

26
Figure 6.8 Energy used by EAFs per tonne of crude steel Source: de Beer et al (1998a, Annual Review of Energy and the Environment 23, 123–205)
")
27
Shaping of Steel, Traditional Method Produce steel in cubical blocks, small bars, or slabs using a continuous caster, then convert into final products using various hot mills (heating and cooling occurs between steps, with an energy loss each time)
")
28
Shaping of Steel, Alternative approaches: Cast the molten steel closer to the desired final shape, using thin-slab casting, thin-strip casting, or powder metallurgy Thin-strip casting has the potential to reduce energy use for shaping by 90-95% In thin-strip casting, the length of the production line has been reduced from 500-800 m to 60 m – about a factor of ten reduction!

29
Alternative Approaches for Reducing Iron Ore: Blast Furnace with coke through reaction with CO while the ore is still solid (traditional approach) Direct reduction of the ore using coal or natural gas to produce a H 2 -rich gas (or direct use of purchased H 2 ) combined with a DC current Smelting reduction of the ore in the liquid state, directly using coal
 Direct reduction of the ore using coal or natural gas to produce a H 2 -rich gas (or direct use of purchased H 2 ) combined with a DC current Smelting reduction of the ore in the liquid state, directly using coal")
30
Figure 6.9a Primary energy use with best current blast- furnace/BOF route for making primary steel

31
Figure 6.9b Primary energy use with advanced blast-furnace/BOF making primary steel By comparison, the present world average primary energy requirement for primary steel is about 36 GJ/t

32
Figure 6.9c Primary energy use with best current direct reduction/EAF steel making

33
Figure 6.9d Primary energy use with advanced direct reduction/EAF steel making and advanced refining, casting, and shaping

34
Figure 6.9e Primary energy use with advanced smelting-reduction/BOF steel making and advanced refining, casting, and shaping This is a reduction by 63% (~two thirds) compared to the present average primary energy use for primary steel of 36 GJ/t. The savings is due in part to an assumed improvement in the efficiency in generating the electricity that is supplied to the steel plant from 40% to 60%.

35
Figure 6.10a Current mill using scrap steel to make secondary steel Source: de Beer et al (1998a, Annual Review of Energy and the Environment 23, 123–205)
")
36
Figure 6.10b Advanced mill using scrap steel to make secondary steel This is a reduction by 50% from the present world average of 7 GJ/t for secondary steel. The savings is due in part to an assumed improvement in the efficiency in generating the electricity that is supplied to the steel plant from 40% to 60%. de Beer et al (1998a, Annual Review of Energy and the Environment 23, 123–205) Source: de Beer et al (1998a, Annual Review of Energy and the Environment 23, 123–205)
 Source: de Beer et al (1998a, Annual Review of Energy and the Environment 23, 123–205).")
37
Steel Summary: Primary Energy Requirements Primary Steel: - 36 GJ/t world average today, assuming electricity supplied at 40% efficiency Secondary Steel: - 7 GJ/t world average today – a reduction by about a factor of 5 compared to primary steel

38
Steel Summary (continued): Current average with 32% secondary: 26.3 GJ/t Future average with 90% secondary and current best practice as average: 6.9 GJ/t This is a reduction by a factor of 3.8 Future average with 90% secondary, best projected energy intensities for primary and secondary steel: 5.9 GJ/t This is a reduction by a factor of 4.5 All of the above plus 60% electricity supply efficiency instead of 40%: 4.5 GJ/t This is a reduction by a factor of 5.8 Thus, the overall potential reduction in the average primary energy intensity of steel is a factor of 4.5 to 6
: Current average with 32% secondary: 26.3 GJ/t Future average with 90% secondary and current best practice as average: 6.9 GJ/t This is a reduction by a factor of 3.8 Future average with 90% secondary, best projected energy intensities for primary and secondary steel: 5.9 GJ/t This is a reduction by a factor of 4.5 All of the above plus 60% electricity supply efficiency instead of 40%: 4.5 GJ/t This is a reduction by a factor of 5.8 Thus, the overall potential reduction in the average primary energy intensity of steel is a factor of 4.5 to 6")
39
Aluminium

40
Figure 6.11a World production of primary aluminium

41
Figure 6.11b Production of primary aluminium in 2007

42
Figure 6.11c End uses of aluminium in the US in 2003

43
Production of Aluminium Mining of bauxite (mostly Al(OH) 3 and AlO(OH)) (most of the mining is through strip mining) Refining of bauxite into alumina (Al 2 O 3 ) -grinding, then digestion with caustic soda at high T and P Smelting of alumina into aluminium, through electrolysis of alumina that has been dissolved into cryolite (Na 3 AlF 6 ) at 900 o C -both the cathode and anode are made of C -the net reaction is 2Al 2 O 3 +3C→4Al+3CO 2
 3 and AlO(OH)) (most of the mining is through strip mining) Refining of bauxite into alumina (Al 2 O 3 ) -grinding, then digestion with caustic soda at high T and P Smelting of alumina into aluminium, through electrolysis of alumina that has been dissolved into cryolite (Na 3 AlF 6 ) at 900 o C -both the cathode and anode are made of C -the net reaction is 2Al 2 O 3 +3C→4Al+3CO 2")
44
Figure 6.12 Aluminium Mass Flow in 2005 From this diagram it can be seen that a little over 4 t of dry bauxite are mined for every tonne of primary aluminium that is produced Source: IAI (www.world-aluminium.org)

45
Figure 6.13 Secondary energy used in making aluminium metal

46
Figure 6.14: World average electricity use for the production of aluminium

47
Figure 6.15 Efficiencies of individual processes in producing aluminium Source: Thekdi (2003, Aluminum 2003, The Minerals, Metals & Materials Society, 225–237)
")
48
Figure 6.16: World production of primary and secondary aluminium, and the secondary share of total production

49
Aluminium Summary: Primary Energy Requirements Primary aluminium: - 193 GJ/t world average today, assuming electricity supplied at 40% efficiency Secondary aluminium: - 17 GJ/t world average today – more than a factor of 10 smaller than for primary aluminium Average of the above (with 18.7% recycled) is 160.3 GJ/t (more than 5 times that of steel)
 is GJ/t (more than 5 times that of steel)")
50
Aluminium Summary (continued): Future average with 90% secondary and current average energy use separately for primary and secondary Al: 34.5 GJ/t This is a reduction by a factor of 4.6 Future average with 90% secondary, best projected energy intensities for primary and secondary steel: 23.3 GJ/t This is a reduction by a factor of 6.9 All of the above plus 60% electricity supply efficiency instead of 40%: 19.1 GJ/t This is a reduction by a factor of 8.4 Thus, the overall potential reduction in the average primary energy intensity of aluminium is a factor of 5 to 8
: Future average with 90% secondary and current average energy use separately for primary and secondary Al: 34.5 GJ/t This is a reduction by a factor of 4.6 Future average with 90% secondary, best projected energy intensities for primary and secondary steel: 23.3 GJ/t This is a reduction by a factor of 6.9 All of the above plus 60% electricity supply efficiency instead of 40%: 19.1 GJ/t This is a reduction by a factor of 8.4 Thus, the overall potential reduction in the average primary energy intensity of aluminium is a factor of 5 to 8")
51
Copper

52
Figure 6.17a World copper mining

53
Figure 6.17b Copper mining in 2007

54
Figure 6.17c End uses of copper in the US in 2003

55
Figure 6.18 Anthropogenic copper flows in ca. 1994 in Gg Cu/yr Source: Graedel et al (2004, Environmental Science and Technology 38, 1242–1252)
.")
56
Production of Copper Metal Copper minerals occur either as oxides (combined with CO 3 or SiO 2 ) or as sulfides (combined with S). A given ore body tends to have oxide minerals in the upper zone (close to air) and sulfide minerals in the lower zone There are two different produciton routes: Hydrometallurgy (acid related) – tends to be applied to oxide minerals Pyrometallurgy (heat related) – tends to be applied to sulfide minerals In the transition zone of the ore body, either technique can be applied, but there has been a shift to more use of hydrometallurgy
 and sulfide minerals in the lower zone There are two different produciton routes: Hydrometallurgy (acid related) – tends to be applied to oxide minerals Pyrometallurgy (heat related) – tends to be applied to sulfide minerals In the transition zone of the ore body, either technique can be applied, but there has been a shift to more use of hydrometallurgy.")
57
Steps in Pyrometallurgy (1): Extraction from the mine, crushing, and grinding Froth flotation – mix with chemical foaming agents, as ore minerals adhere to bubbles and float to surface and can be skimmed off. Produces a concentrate of 25-30% copper, mostly CuFeS 2. Smelting – heating the concentrate in oxygen-enriched air to 1200-1250 o C, with addition of silica (SiO 2 ), partially oxidizing the Fe and S, releasing SO 2 gas, and producing a molten copper matte (Cu 2 S*FeS) and molten slag (FeO*SiO 2 ): CuFeS 2 + O 2 + SiO 2 → Cu-Fe-S + FeO*SiO 2 + SO 2 + heat
, partially oxidizing the Fe and S, releasing SO 2 gas, and producing a molten copper matte (Cu 2 S*FeS) and molten slag (FeO*SiO 2 ): CuFeS 2 + O 2 + SiO 2 → Cu-Fe-S + FeO*SiO 2 + SO 2 + heat.")
58
Steps in Pyrometallurgy (2): Converting – separating the Cu 2 S from the FeS in the copper matte and oxidizing the S. Produces blister copper (99% copper) and further iron slag Cu 2 S + O 2 → 2Cu° + 2SO 2 + heat 2FeS + 3O 2 + SiO 2 → 2FeOSiO 2 + 2SO 2 + heat The smelting and converting reactions are exothermic – and the heat released is sufficient to maintain the required temperature once the process has started. This eliminates the need for fuel energy in state-of-the-art smelters & converters, but requires continuous rather than batch processing.
 and further iron slag Cu 2 S + O 2 → 2Cu° + 2SO 2 + heat 2FeS + 3O 2 + SiO 2 → 2FeOSiO 2 + 2SO 2 + heat The smelting and converting reactions are exothermic – and the heat released is sufficient to maintain the required temperature once the process has started. This eliminates the need for fuel energy in state-of-the-art smelters & converters, but requires continuous rather than batch processing..")
59
Steps in Pyrometallurgy (3): Fire refining. This is a process for removing most of the remaining O and S and, like previous steps, is carried out at a temperature of about 1200 o C. The O is removed as CO 2 through reaction with a hydrocarbon reducing agent (typically 5-7 kg per tonne of copper), while S is removed as SO 2 through reaction with atmospheric oxygen. Fire refining is carried out in special rotating furnaces that are heated by combusting hydrocarbon fuels. The liquid product is directly cast into thin anodes that are interleaved with cathodes in electro- refining cells. The copper anodes still contain about 0.15% O and 0.002% S.
, while S is removed as SO 2 through reaction with atmospheric oxygen. Fire refining is carried out in special rotating furnaces that are heated by combusting hydrocarbon fuels. The liquid product is directly cast into thin anodes that are interleaved with cathodes in electro- refining cells. The copper anodes still contain about 0.15% O and 0.002% S..")
60
Steps in Pyrometallurgy (4): Electro-refining. This is an electrolysis process that involves electrochemically dissolving copper from impure copper anodes into a CuSO 2 -H 2 SO 4 -H 2 O electrolyte and electroplating pure copper from the electrolyte onto a cathode without the impurities. After 7-14 days the cathodes are removed from the cell and the pure metal is scrapped off. The reactions are: Cuº anode → Cu 2+ + 2e - at the anode, and Cu 2+ + 2e- → Cuº at the cathode.

61
Steps in Hydrometallurgy: Leaching – excavate ores, pile in a heap, and add acid to dissolve the ore, or drill holes into the ore body and pump in acid, and weeks to months later, pump out the leachate Concentration – add organic solvents to the acid solution, to selectively absorb copper from the solution Refining – an electrolysis process called electro- winning, similar to electro-refining except that the anode consists of an inert Pb-Sn-Ca mixture. The copper is electroplated onto the cathode from the Cu solution supplied from the concentration step rather than supplied by dissolution of a copper anode. The combination of acid leaching and electro-winning is called the solvent-extraction electro-winning process, or SX-EW.

62
As previously noted, SX-EW (hydrometallurgy) is being used more and more. There are three disadvantages with this process: Any gold, silver, or molybdenum in the ore is lost The fraction of the Cu present in the ore that can be extracted is much less than using pyrometallurgy Electro-winning requires much more electricity (1800- 2800 kWh/t) than the electro-refining process (300-400 kWh/t) used in pyrometallurgy
 than the electro-refining process ( kWh/t) used in pyrometallurgy.")
63
On the other hand, hydrometallurgy only requires crushing the mined ore to a 10-13 cm size, rather than grinding it down to the size of individual mineral grains (100-200 μ m) (as in pyrometallurgy). The grinding stage is very energy intensive. If 20 kWh of electricity are required per tonne of ore, the amount require per tonne of copper is 20 kWh/(copper fraction in the ore). Thus, for ore with 1% copper (a grade of 1%), the grinding energy requirement is 2000 kWh/tonne – comparable to the energy used for electro-winning (1800-2800 kWh/t) in the hydrometallurgy route.
. Thus, for ore with 1% copper (a grade of 1%), the grinding energy requirement is 2000 kWh/tonne – comparable to the energy used for electro-winning ( kWh/t) in the hydrometallurgy route..")
64
Thus, the amount of energy used in producing copper increases rapidly with decreasing grade of ore. This is because mining and concentrating the Cu account for 1/3 to 1/2 half of the total energy used in producing the pure metal for 1% ores, in contrast to iron and aluminum, where the metal concentrations in the ores are high (40- 50% for Al, 60-70% for Fe) and mining and concentrating are a very small fraction of the total energy use
 and mining and concentrating are a very small fraction of the total energy use.")
65
Figure 6.19 Estimated primary energy requirement to produce rolled copper tubes

66
Table 6.12: Average grade of the remaining Cu ores in different parts of the world Source: Giurco (2005, Towards sustainable metal cycles: The case of copper’, PhD Thesis, Department of Chemical Engineering, University of Sydney)
")
67
Energy Use in Producing Secondary Copper Depends strongly on the extent to which the scrap copper is contaminated with other materials Purest copper can be simply melted and recast Less pure copper is re-melted and cast as anodes, followed by electro-refining Impure copper must be smelted and converted

68
Figure 6.20 Flowchart for refining and smelting of contaminated copper Source: Davenport et al (2002, Extractive Metallurgy of Copper, Elsevier Academic Press, Amsterdam)
")
69
Figure 6.21a Global production of primary and secondary copper, and scrap flow

70
Figure 6.21b Recycling rate of scrap copper

71
Figure 6.22 Distribution of the copper stock in the US of 238 kg per person

72
Energy requirements for recycling Cu: ~ 4 GJ/t for Grade 1 scrap ~ 20 GJ/t for Grade 2 scrap (≥ 94% Cu) ~ 50 GJ/t for Grade 3 scrap (contaminated) By comparison, 80-90 GJ/t are required for 1% ore and 180 GJ/t for 0.3% ore (however, one worker gives the primary energy requirement as only ~ 50 GJ/t for 0.35% ore) So, except possibly for contaminated scrap compared to cases of primary Cu with low energy requirements, recycling saves a lot energy – potentially reducing the energy requirement by more than a factor of 40
 ~ 50 GJ/t for Grade 3 scrap (contaminated) By comparison, GJ/t are required for 1% ore and 180 GJ/t for 0.3% ore (however, one worker gives the primary energy requirement as only ~ 50 GJ/t for 0.35% ore) So, except possibly for contaminated scrap compared to cases of primary Cu with low energy requirements, recycling saves a lot energy – potentially reducing the energy requirement by more than a factor of 40")
73
This dismal picture will likely change soon, as Cu mining is expected by some analysts to peak in about 20 years, due to supply constraints

74
Figure 6.23 Quantity of metals vs grade of ores, showing two modes – corresponding to mineral crystals and atomic substitution Source: Ayres et al (2003, The Life Cycle of Copper, Its Co-Products and Byproducts, Kluwer, Dordrecht)
")
75
Ways to limit demand for copper: More compact and smaller housing – less length of wire needed Smaller growth in electricity demand Replacement of copper with glass fibre in telecommunications Replacement of copper with PVC pipes in plumbing (PVC pipes are less energy-intensive)
")
76
Cement

77
Figure 6.24a World cement production

78
Figure 6.24b Cement production in 2007

79
Figure 6.24c Disposition of cement produced in the US in 2003

80
Production of Cement Crushing, grinding, and blending of raw materials into a homogenous powder Heating the raw materials to over 1400ºC in a kiln to produce clinker Grinding the clinker to a fine powder and mixing it with additions to form cement Concrete is a mixture of about 10% cement and 90% aggregates (sand and gravel), with cement serving as the binding material. When stronger concrete is required, the proportion of cement is increased, so this increases the embodied energy of the concrete (as cement is the energy-intensive part of concrete).
..")
81
Table 6.17: Composition of Portland cement Portland cement (named after the Peninsula Portland in England) is 95% clinker and 5% gypsum. The elemental composition of clinker is as follows: Source: van Oss and Padovani (2002, Journal of Industrial Ecology 6, 89–105 )
.")
82
Reactions occurring inside a cement kiln: Calcination, CaCO 3 → CaO + CO 2 Clinkering, 29C+8S+2A+F→2C 2 S + 6C 3 S+C 4 AF “alite” “belite”

83
Table 6.18: Composition of clinker and roles of the different components Source: van Oss and Padovani (2002, Journal of Industrial Ecology 6, 89–105 )
")
84
Figure 6.25 Layout of the zones in various cement kilns Source: Van Oss and Padovani (2002, Background Facts and Issues Concerning Cement and Cement Data, Open File Report 2005-1152, US Geological Survey, Reston, Virginia)
")
85
The binding properties of cement occur when it is mixed with water, which forms hydrated molecules that cling to each other. The binding requires materials with a high surface area (which must therefore be ground to a very fine powder) and materials that can form hydrates. This is relevant to the possibility of producing lower-energy alternatives to traditional Portland cement. Hydration of alite (gives early strength): 2C 3 S+6H(water)→C 3 S 2 H 3 (CSH gel)+3CH (hydrated lime) Hydration of belite (gives long term strength): 2C 2 S + 4H(water)→C 3 S 2 H 3 +CH
 and materials that can form hydrates. This is relevant to the possibility of producing lower-energy alternatives to traditional Portland cement. Hydration of alite (gives early strength): 2C 3 S+6H(water)→C 3 S 2 H 3 (CSH gel)+3CH (hydrated lime) Hydration of belite (gives long term strength): 2C 2 S + 4H(water)→C 3 S 2 H 3 +CH.")
86
Current national average energy use for producing cement: Theoretical minimum for clinkering: 1.67 GJ/t Japan, 3.1 GJ/t Germany, 3.8 GJ/t European average, 4.1 GJ/t China, 5.0 GJ/t India, 5.0 GJ/t Canada, 5.1 GJ/t USA, 5.5 GJ/t Columbia, 6.1 GJ/t

87
Options for reducing energy use in making cement: Shifting from wet to dry kilns Better recovery of waste heat from kilns Improved grinding techniques Reducing the clinker portion (95% in Portland cement) by blending in other materials, such as -blast furnace slag -fly ash from coal-fired powerplants -volcanic materials -natural limestone (easy to grind) -ordinary quartz sand (hard to grind)
 by blending in other materials, such as -blast furnace slag -fly ash from coal-fired powerplants -volcanic materials -natural limestone (easy to grind) -ordinary quartz sand (hard to grind)")
88
Figure 6.26 Supply of fly ash and blast furnace slag Source: Humphreys and Mahasenan (2002, Toward a Sustainable Cement Industry, Substudy 8: Climate Change, World Business Council for Sustainable Development, Cement Sustainability Initiative, www.wbcsdcement.orgwww.wbcsdcement.org

89
Other options: Development of entirely new cements Integrated production of cement and electricity (using waste heat at 300ºC from the clinker cooler) Use of concentrated solar energy Improved durability of cement (or of steel reinforcing) Reduced use where feasible without compromising safety (i.e., baffled basement walls)
 Use of concentrated solar energy Improved durability of cement (or of steel reinforcing) Reduced use where feasible without compromising safety (i.e., baffled basement walls)")
90
Glass

91
Types: container, flat or “float”, and fibrous (insulation, textile fibreglass) Raw materials: sand, limestone, maybe soda ash, borate, feldspar and clay Production process: - preparation of inputs - melting of raw materials and refining (removal of bubbles) - shaping the molten glass into the desired final shapes
 Raw materials: sand, limestone, maybe soda ash, borate, feldspar and clay Production process: - preparation of inputs - melting of raw materials and refining (removal of bubbles) - shaping the molten glass into the desired final shapes")
92
Table 6.22: Typical inputs to glass Source: Ruth and Dell’Anno (1997, Resources Policy 23, 109–124)
")
93
Types of furnaces for melting of raw materials: Regenerative, recuperative - use fuels (natural gas), maximum efficiency now ~50% ((heat added to raw materials) / (fuel energy used)), could be pushed to 75% (giving a 1/3 reduction in fuel use) Electric – efficiency of 70-90%, but must account for losses in generating and transmitting electricity. - applied to fibrous glass

94
Typical primary energy use today Flat and container glass: ~ 20-30 GJ/t Fibrous glass at 40% electricity supply efficiency: ~ 60 GJ/t Fibrous glass at 60% electricity supply efficiency: ~ 40 GJ/t Savings through recycling: ~ 20-30%

95
Figure 6.27 Rates of Recycling of Glass Containers

96
Paper and Paper Products

97
Production of Paper and Paper Products Acquisition of fibres Pulping Bleaching Manufacture of paper from pulp

98
Figure 6.28a Production of different kinds of paper and paper products

99
Figure 6.28b Production of paper and paper products by region

100
Figure 6.29 Annual per capita paper consumption

101
Figure 6.30 Rates of paper recycling

102
Sources of Fibre for Paper: Roundwood (wood removed from forests or other areas) Sawmill residues Discarded paper
 Sawmill residues Discarded paper")
103
Pulping Processes Mechanical Chemical Semi-chemical

104
Mechanical Pulping Breaks apart the wood by grinding Both fibre and lignin are turned into pulp, so the pulp yield is high - 85% of the original wood mass. Lots of heat is generated that can be used elsewhere in the paper mill

105
Chemical Pulping Soften wood chips with steam Then cook for several hours at 160-170 o C under pressure in a highly alkaline solution (contains NaOH and Na 2 S) called white liquor This dissolves the lignin, leaving only the fibres (40-55% of the wood) to form pulp The spent liquor (now called black liquor) and bark are burned to produce heat and electricity for use by the pulp and paper mill
 called white liquor This dissolves the lignin, leaving only the fibres (40-55% of the wood) to form pulp The spent liquor (now called black liquor) and bark are burned to produce heat and electricity for use by the pulp and paper mill")
106
Figure 6.31 Annual trade of different kinds of pulp

107
Bleaching Process of removing residual lignin from the pulp, which otherwise causes the pulp to be dark Requires a chemical (Cl 2, ClO 2, H 2 O 2 or O 3 ) that oxidizes the lignin but not the fibre (cellulose and hemi-cellulose) Cl 2 bleaching causes severe water pollution, so there is a move toward elemental chlorine-free (ECF) bleaching (using ClO 2 ) or totally chlorine- free (TCF) bleaching (using H 2 O 2 or O 3 )
 that oxidizes the lignin but not the fibre (cellulose and hemi-cellulose) Cl 2 bleaching causes severe water pollution, so there is a move toward elemental chlorine-free (ECF) bleaching (using ClO 2 ) or totally chlorine- free (TCF) bleaching (using H 2 O 2 or O 3 )")
108
Steps in making paper from pulp Addition of water sufficient to give a water:fibre ratio of 100:1 (i.e., a consistency of 1%). Forming – spread stock over a wire screen, then remove sufficient water through gravity and suction to give a consistency of 20% Pressing – increase consistency to 40-45% by passing the sheet with felt through 3-4 pairs of press cylinders Drying – pass sheet through 40-50 steam-heated cylinders, to give a consistency of 90-95%

109
Options to reduce energy use per unit of paper made Integration of pulp and paper mills Heat recovery from mechanical pulping Reductions in market demand for bleached paper products (through consumer awareness) More efficient drying of initial pulp sheets More efficient cogeneration Increased recycling
 More efficient drying of initial pulp sheets More efficient cogeneration Increased recycling")
110
Cogeneration in the pulp and paper industry Currently very inefficient – only 10-15% electrical efficiency, in part to avoid producing excess electricity because it can’t be sent to the grid in many jurisdictions due to monopolistic practices by power utilities Potential electrical efficiency of 27-30% (and 72% overall efficiency) with gasification of black liquor followed by combined-cycle power generation. Some problems still to be worked out This could make the pulp and paper mill a net source of energy – this would be renewable, biomass-based energy

111
Other possibilities: Production of dimethyl ether (a substitute for diesel fuel in the transportation sector) from biomass wastes, integrated with pulp and paper production, is potentially more attractive in terms of energy saving than is cogeneration of heat and electricity Development of completely closed mills – all liquids flow back through the mill, rather than be ejected with heat (and pollutants) to the environment. At present it would be hard to make use of the saved heat.

112
The energy balance in recycling of paper includes: The net energy required to make paper from virgin fibres, taking into account the energy that can be produced from black liquor and forestry residues and the energy required to make any fertilizers that are applied to plantation forests The energy that can be obtained from incineration of waste paper to cogenerate heat and electricity if it is not recycled (landfilling is totally out of the question) The energy required during recycling of waste paper, including the energy required to collect waste paper and transport it to the recycling plant The energy that could be supplied from the biomass that is saved when waste paper is recycled
 The energy required during recycling of waste paper, including the energy required to collect waste paper and transport it to the recycling plant The energy that could be supplied from the biomass that is saved when waste paper is recycled")
113
Rough energy balance: Paper from wood: gross energy requirement: ~ 29 GJ/t Potential energy production: ~ 31 GJ/t Net energy requirement: -2 GJ/t Paper from waste paper: ~ 20 GJ/t So, in terms of gross energy requirements, recycling gives a 30% savings. However, in terms of net energy use, recycling increases the energy requirement.

114
There is, of course, more to it Incineration of waste paper with cogeneration saves ~26 GJ/t of primary energy, so the overall energy gain with production of paper from virgin fibres and later incineration is ~ 28 GJ/t BUT – for each tonne of waste paper that is recycled, 2.2 tonnes of biomass are saved. For the set of assumptions in Table 6.29, this saves 52 GJ of primary energy, for a net energy gain of ~ 32 GJ/t Thus, recycling is slightly better from an energy point of view, but for slightly different assumptions, it could be slightly worse.

115
Plastics Produced by reacting steam with hydrocarbons at high T and P, thereby breaking the C-C bonds in the hydrocarbons (so this process is called steam cracking) Most are made from naptha, an intermediate product in the refining of petroleum Cracking produces methane, olefins, and aromatics, which are the precursors to various kinds of plastic
 Most are made from naptha, an intermediate product in the refining of petroleum Cracking produces methane, olefins, and aromatics, which are the precursors to various kinds of plastic")
116
Figure 6.32a: Plastics production in 2007

117
Figure 6.32b: Uses of plastics in Europe

118
Figure 6.33 Plastics and other petrochemicals made from petroleum Source: Geiser (2001, Materials Matter: Towards a Sustainable Materials Policy, MIT Press, Cambridge)
")
119
Most plastics are long chains of molecules (monomers), hence the prefix “poly” in the names of most plastics. The major plastics are: Polyethylene Polypropylene Polyvinyl chloride Polystyrene

120
Figure 6.34 Production of plastics in Europe

121
Energy Use in Making Plastics Feedstock Energy: 20-40 GJ/t Process energy: 20-120 GJ/t Total energy: 50-160 GJ/t Energy is used for heating to up to 1000 o C (to “crack” naphtha or other raw materials), for chilling (sudden cooling to as low as -150 o C is needed for some of the reaction and separation steps), and for pumps and motors
, for chilling (sudden cooling to as low as -150 o C is needed for some of the reaction and separation steps), and for pumps and motors")
122
Figure 6.35 Primary energy inputs to make plastic

123
Energy Savings Potential For the cracking step – 25% or more savings should be typically possible in the medium term (with modest further improvement of existing state-of-the- art crackers) Improved cogeneration (if present) or implementation of cogeneration (if not already used) (both steam and electricity are required) Adjustment of piping systems, use of variable speed drives (mentioned in the Buildings chapter), better chiller controls and increasing the temperature of chilled water produced by the chillers reduced electricity use by 50% in one case
 Improved cogeneration (if present) or implementation of cogeneration (if not already used) (both steam and electricity are required) Adjustment of piping systems, use of variable speed drives (mentioned in the Buildings chapter), better chiller controls and increasing the temperature of chilled water produced by the chillers reduced electricity use by 50% in one case")
124
Energy Savings Through Recycling The feedstock energy is saved (except possibly for small material losses during the recycling process) Some (often large) portion of the process energy is also saved (no need to crack hydrocarbons again) Energy savings is typically 85-90% according to the one source Obstacle: the need to separate different kinds of plastic from one another
 Some (often large) portion of the process energy is also saved (no need to crack hydrocarbons again) Energy savings is typically 85-90% according to the one source Obstacle: the need to separate different kinds of plastic from one another")
125
Figure 6.36 Disposition of plastics waste in Europe Source: Plastics Europe (2008, The Compelling Facts about Plastics 2007: An Analysis of Plastics Production, Demand and Recovery for 2007 in Europe, www.plasticseurope.org)

126
Where was this photo was taken?

127
Answer: in the middle of the Pacific Ocean, 1400 km north of Hawaii!

128
Eastern and Western Pacific Garbage Patches – about 3-5 Mt each?

129
Floating debris occasionally washes ashore on Hawaii Urban runoff

130
Contents of the gut of an albatross, killed by ingesting floating plastic garbage

131
For more information, go to www.greatgarbagepatch.org

132
Petroleum refining Potential for 20% savings in the US if no other changes occur. However: 10% increase in energy use if S concentration is decreased from 30 ppm to 1 ppm to meet more stringent pollution emission requirements (current most-stringent regulations are around a 15 ppm limit) Increasing energy use with a shift to heavier grades of oil as the lighter grades are depleted. Big jump in processing energy use for oil shales and tar sands
 Increasing energy use with a shift to heavier grades of oil as the lighter grades are depleted. Big jump in processing energy use for oil shales and tar sands.")
133
Table 6.31: Energy Use for Petroleum Refining Source: (S&T) 2 Consultants (2005, Documentation for Natural Resources Canada’s GHGenius Model 3.0, www.ghgenius.ca )
 2 Consultants (2005, Documentation for Natural Resources Canada’s GHGenius Model 3.0, )")
134
Chemicals, General Considerations Importance of improved catalysts Importance of advanced membranes (for separating materials) in reducing general energy use in the chemical industry Importance in capturing exothermic heat (most reactions in the chemical industry are exothermic, and the total exothermic release equals 60% of the overall process energy used in the manufacture of products produced by exothermic reactions)
 in reducing general energy use in the chemical industry Importance in capturing exothermic heat (most reactions in the chemical industry are exothermic, and the total exothermic release equals 60% of the overall process energy used in the manufacture of products produced by exothermic reactions)")
135
Figure 6.37 Membranes Source: Goldemberg et al (1998, Energy for a Sustainable World, Wiley Eastern, New Dehli)
")
136
Cogeneration and heat management It is estimated that the amount of waste heat in exhaust flows and pressurized gases in US industry that could be used in practice to generate electricity is sufficient to supply about 13% of US electricity demand, with no extra fuel use Efficiencies of electricity generation, and overall efficiencies in industrial cogeneration are quite low, but leave room for substantial improvement (although there are often logistical difficulties in upgrading existing facilities)
")
137
Figure 6.38a Industrial cogeneration using an internal combustion engine or simple-cycle gas turbine Typical electrical efficiencies: 22-35% Typical overall efficiencies: 39-54%

138
Figure 6.38b Industrial cogeneration using a steam turbine Typical electrical efficiency: 9-13% Typical overall efficiency: 61-68%

139
Figure 6.38c Combined-cycle industrial cogeneration Typical electrical and overall efficiencies: 30-36% and 60-70%

140
Pinch Analysis Many industrial processes have simultaneous heating and cooling requirements Pinch analysis is a powerful technique integrating the two (when cold and hot fluid streams are brought together, the hot stream will be cooled and the cold stream warmed) Heating and cooling energy savings of 50% or more can sometimes be achieved.
 Heating and cooling energy savings of 50% or more can sometimes be achieved.")
141
Figure 6.39 Pinch Analysis Heating only above the pinch point Cooling only below the pinch point No heat flow from above to below the pinch point should be allowed

Similar presentations
 3316 2531 Fax: (07)3295 9570 www.oresomeresources.com.>")


>")
