Download presentation
Presentation is loading. Please wait.

1
Intense Spring Sea Breezes Along the New York - New Jersey Coast Stanley David Gedzelman and Kwan-Yin Kong EAS Department and NOAA CREST Center City College of New York and Shermane Austin Computer Sciences Department Medgar Evers College Supported by NASA MUSPIN NOAA CREST

2
Overview During 1998, over 50 private weather stations recorded hourly weather data mainly in New Jersey. When added to NWS stations, the grid provided a mesoscale view of diverse weather phenomena including Sea Breezes, Urban Heat Islands, Back Door Cold Fronts (no good 1998 cases), and Squall Lines. At the end of March 1998, record warmth inland and cold SST’s caused a few days of extremely strong sea breezes. We present sea breeze statistics and diagnose the intense sea breeze of 28 March.
, and Squall Lines. At the end of March 1998, record warmth inland and cold SST’s caused a few days of extremely strong sea breezes. We present sea breeze statistics and diagnose the intense sea breeze of 28 March..")
3
Sea Breeze Strength is indicated by 1. Wind speed on the coast 2. Cooling along the coast 3. Penetration distance inland Cooling by the sea breeze was measured by taking the average mid afternoon temperature difference between 3 (black) inland and 3 (white) coastal stations (shown on the map of the next slide). The inland stations may seem close to the coast, but the westerly synoptic scale wind component on most sea breeze days was fast enough to minimize the sea’s impact. The nearest SST’s were measured at NWS Buoy 44025. Nearest soundings were taken at OKX. The daily temperature cycle of one inland and one shore station and the impact of the wind direction during the strong sea breezes at the end of March 1998 are shown on the slide after the map.
 inland and 3 (white) coastal stations (shown on the map of the next slide). The inland stations may seem close to the coast, but the westerly synoptic scale wind component on most sea breeze days was fast enough to minimize the sea’s impact. The nearest SST’s were measured at NWS Buoy Nearest soundings were taken at OKX. The daily temperature cycle of one inland and one shore station and the impact of the wind direction during the strong sea breezes at the end of March 1998 are shown on the slide after the map..")
4
LBI FRI JFK TEB NBR BLM Cooling by Sea Breeze T INLAND - T SHORE 44025 BUOY OKX NYC

5
WSWNWSWE

6
Sea Breeze Potential The motive force for a sea breeze is the difference between land and sea temperatures. The maximum possible air temperature over land is roughly equal to 850 - SST, where 850 equals T 850 brought dry adiabatically to sea level (although superadiabatic lapse rates near the ground are possible in late spring and early summer). The maximum possible temperature difference is indicated on the next slide by the black curve. Actual cooling due to the sea breeze (T INLAND - T SHORE ) is indicated by the yellow curve. Note that the two strongest sea breezes occurred at the end of March and in mid May. Sea breeze potential is much weaker in summer when SST’s are relatively warm.
. The maximum possible temperature difference is indicated on the next slide by the black curve. Actual cooling due to the sea breeze (T INLAND - T SHORE ) is indicated by the yellow curve. Note that the two strongest sea breezes occurred at the end of March and in mid May. Sea breeze potential is much weaker in summer when SST’s are relatively warm..")
7
Potential vs Actual Cooling of Sea Breeze

8
Sea Breeze Days Did inland temperatures approach the maximum possible value indicated by the 850 hPa Chart? This is indicated on the next slide when the green curve matches the black curve. Answer: Yes, on many spring and summer days, but No on most Fall and Winter days Sea Breeze days are indicated by yellow triangles and squares on the next slide. The criteria for a sea breeze day are faster southerly wind component (by 5 knots) and cooler afternoon temperatures (by 5°F) at JFK than at NYC. Note that the black curve grossly overestimates potential for a sea breeze on days of back door cold fronts and NE winds in early May 1998.
 and cooler afternoon temperatures (by 5°F) at JFK than at NYC. Note that the black curve grossly overestimates potential for a sea breeze on days of back door cold fronts and NE winds in early May")
9
Sea Breeze Days vs Potential Cooling of Sea Back Door Days

10
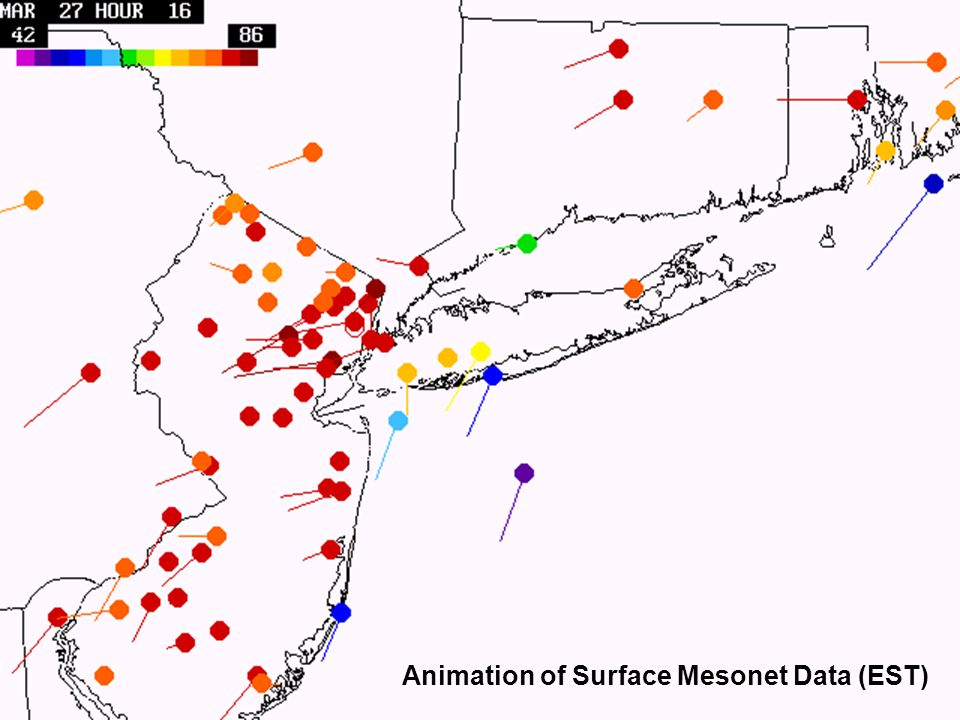
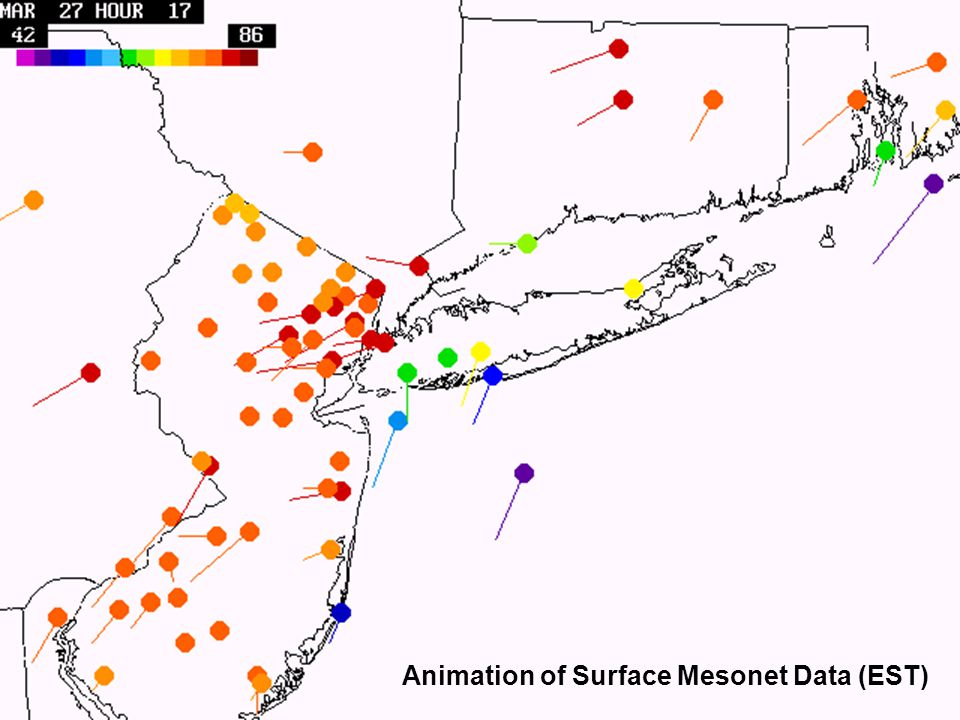
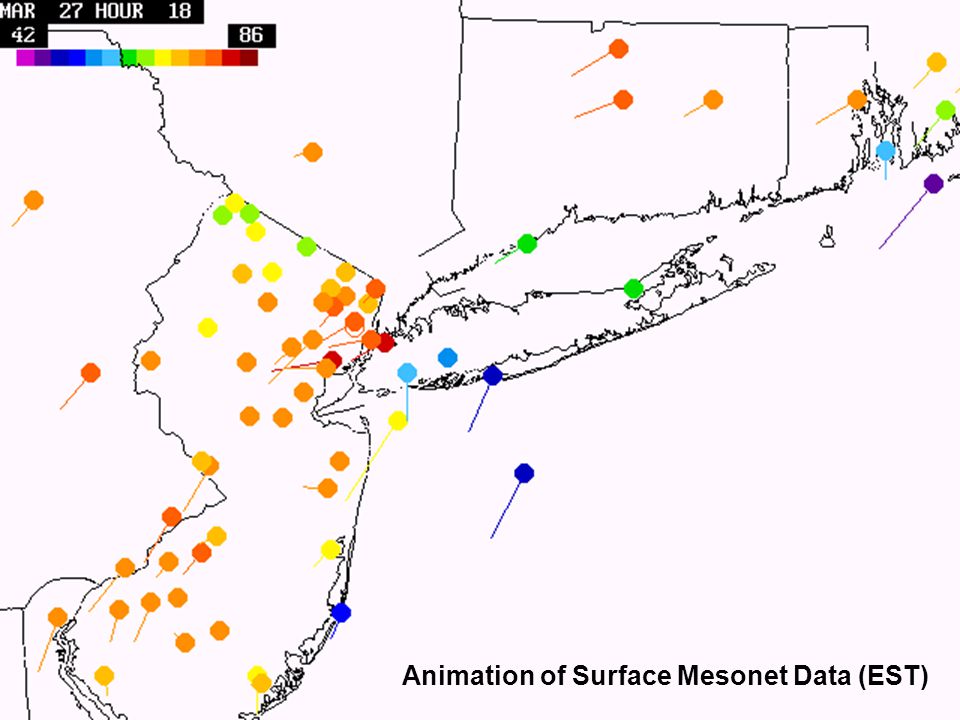
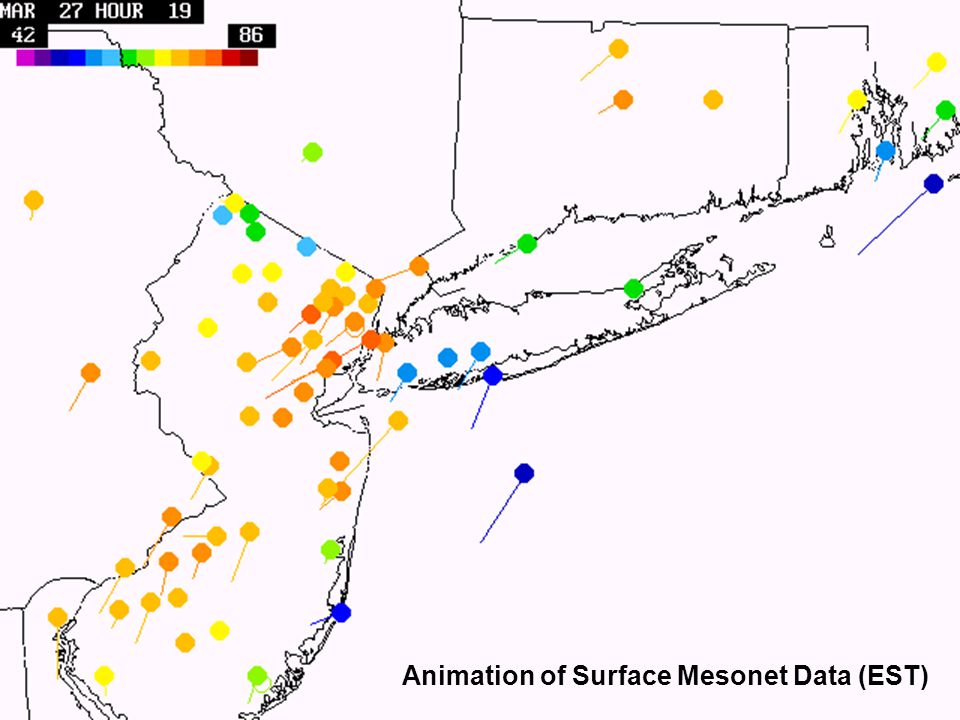
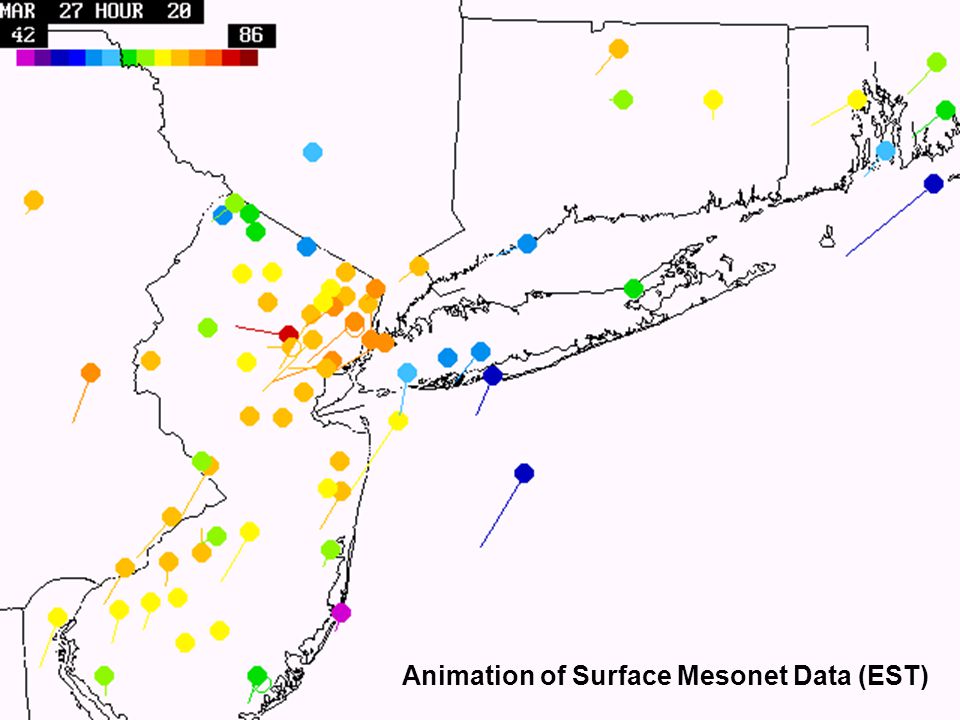
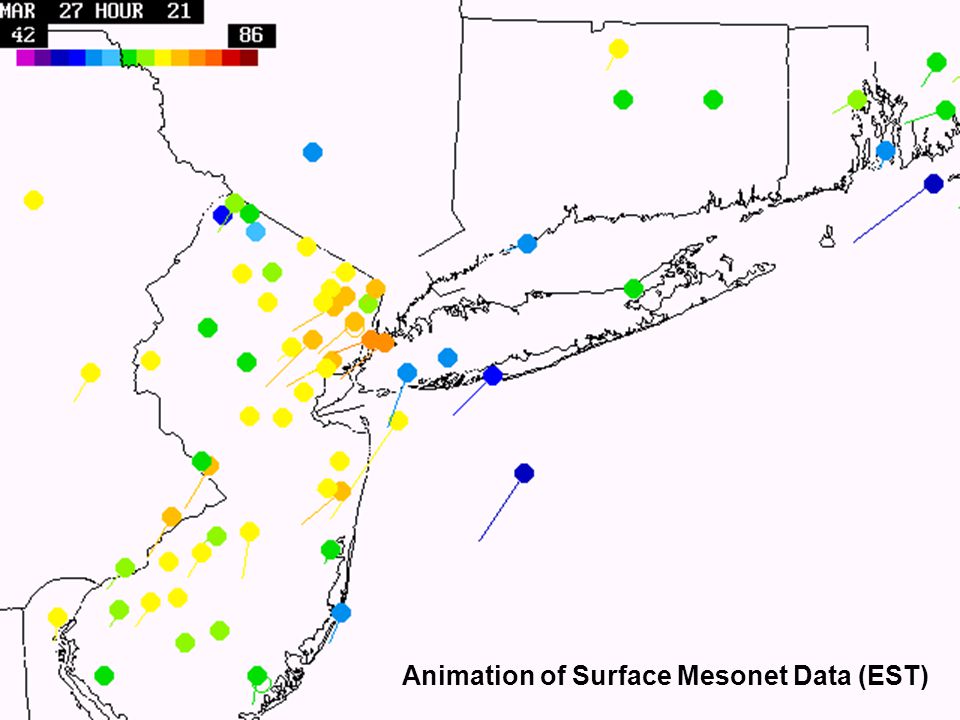
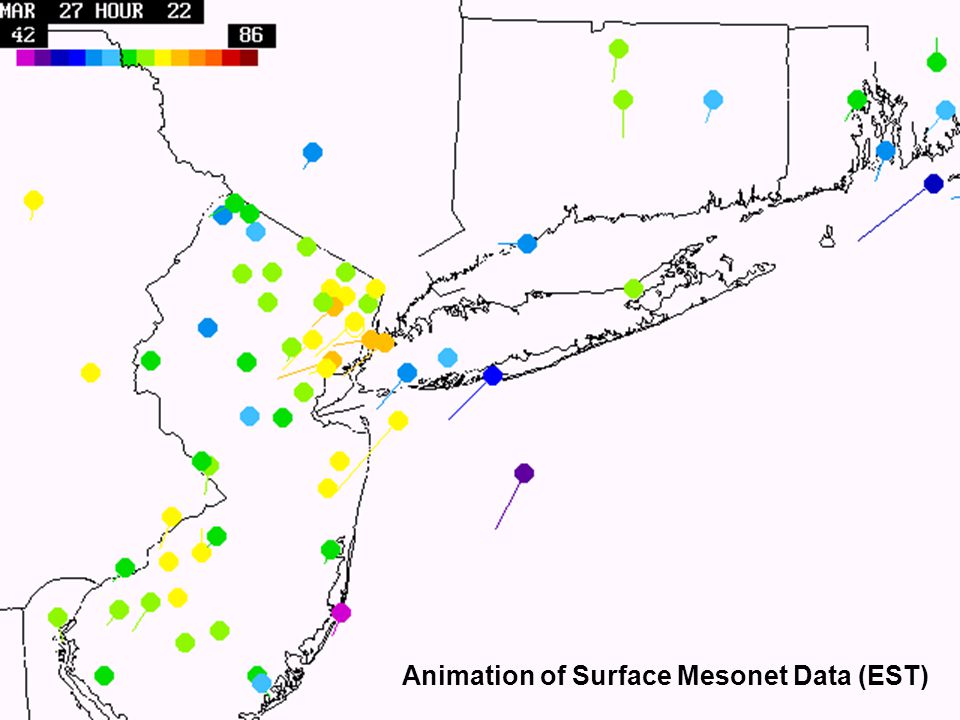
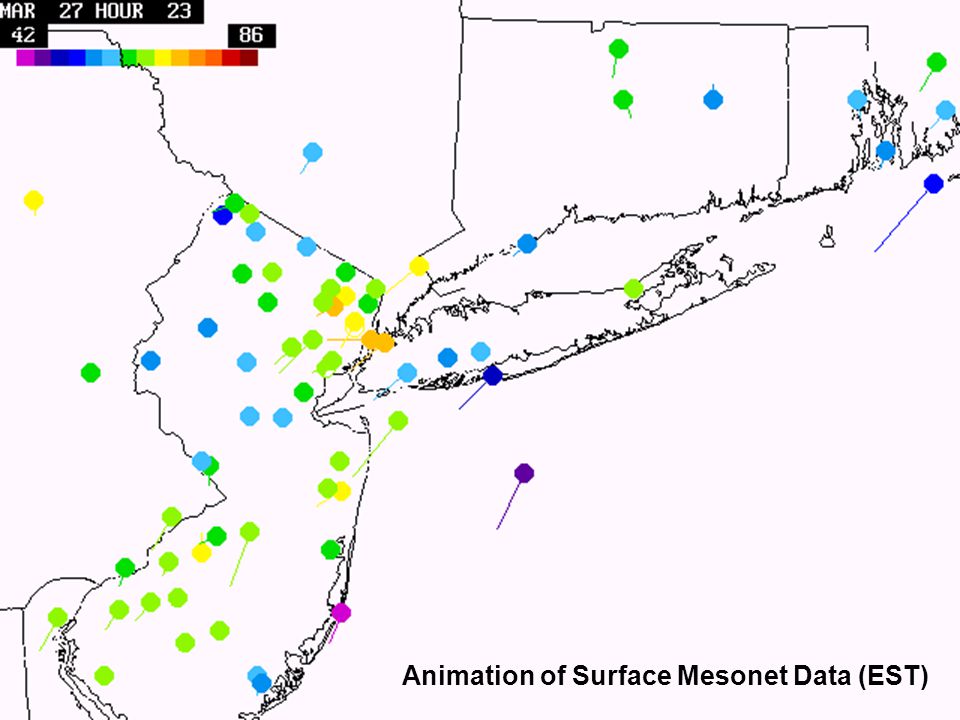
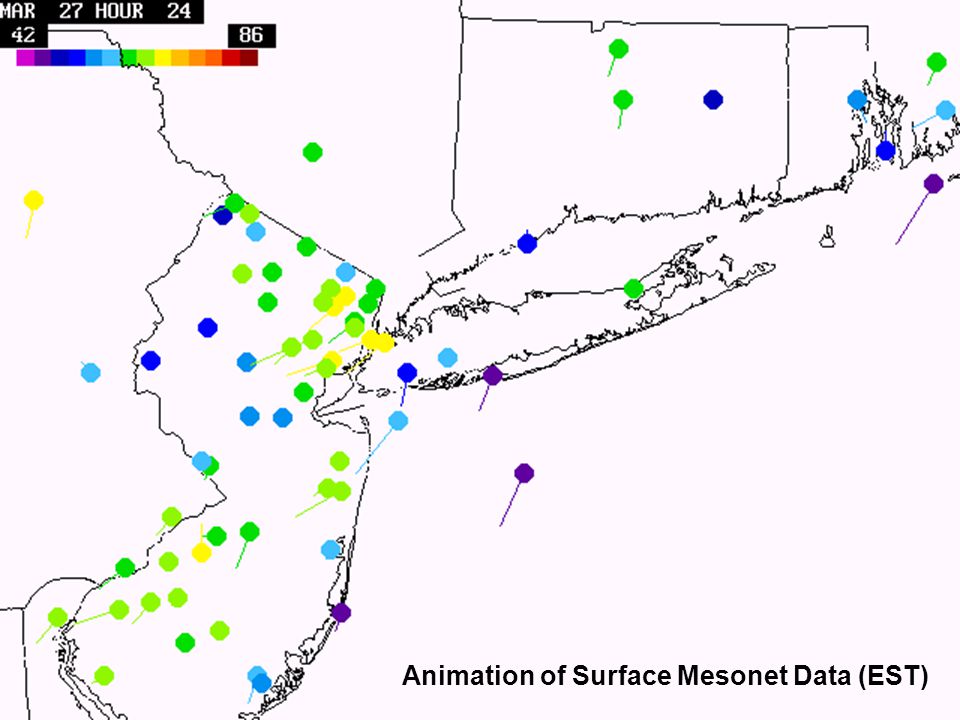
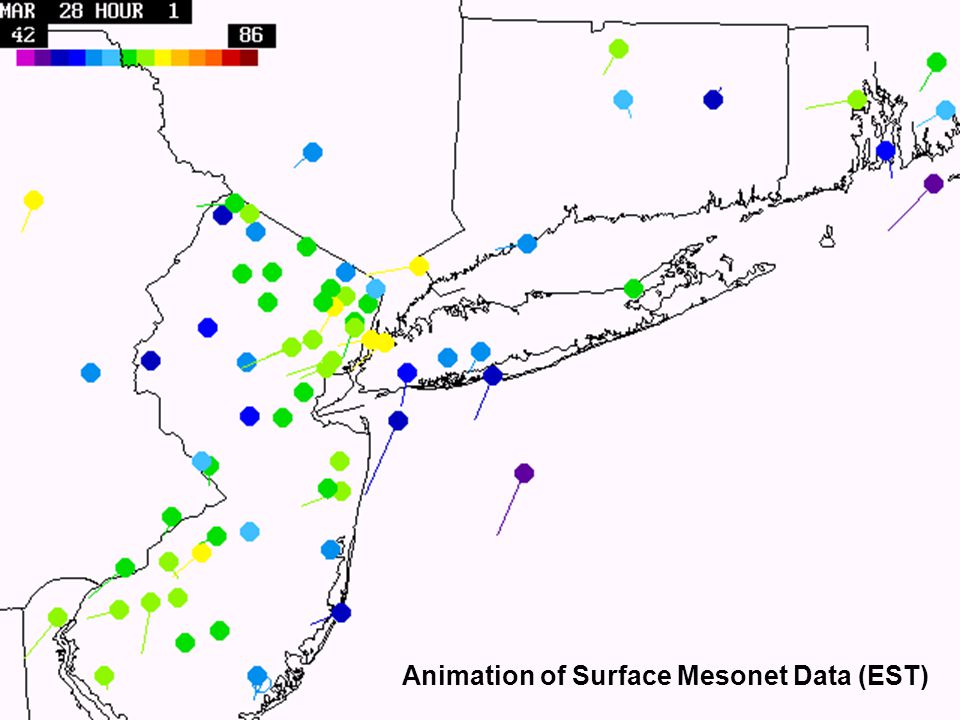
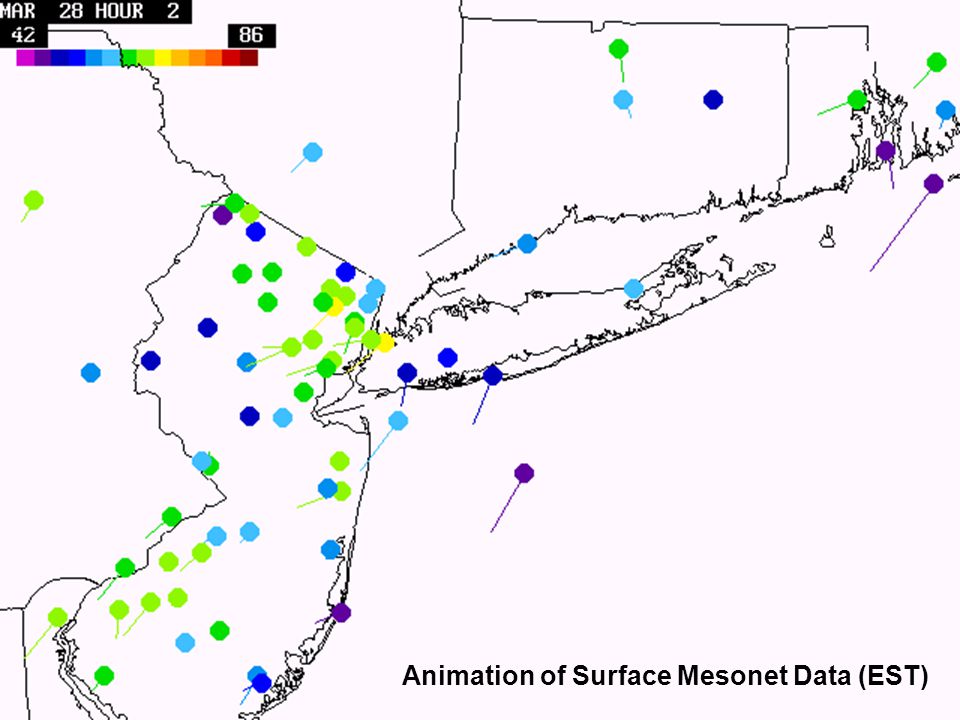
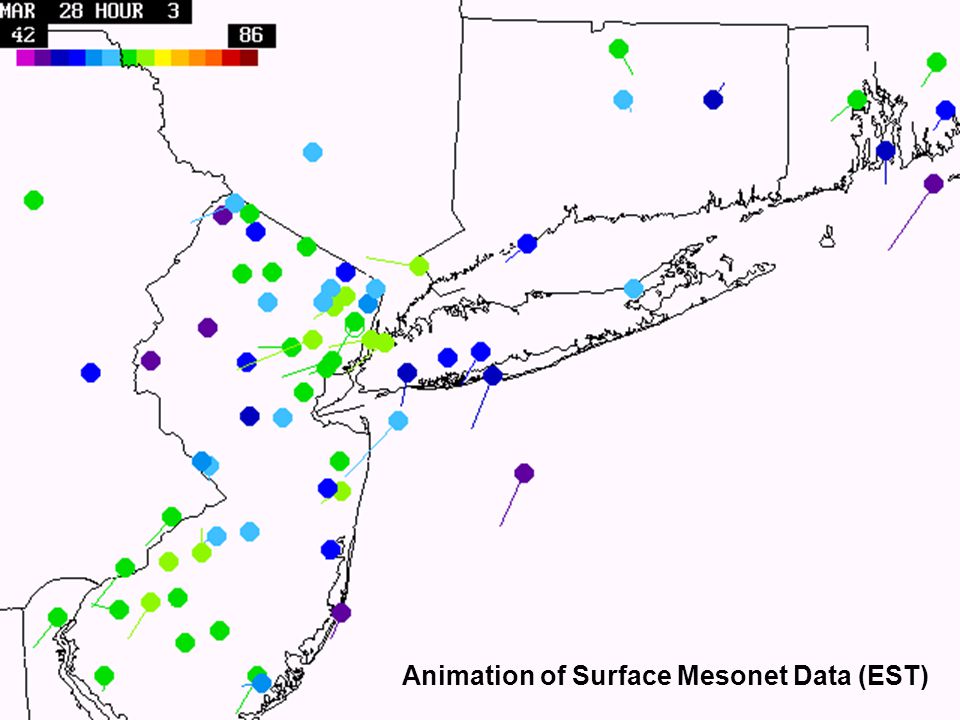
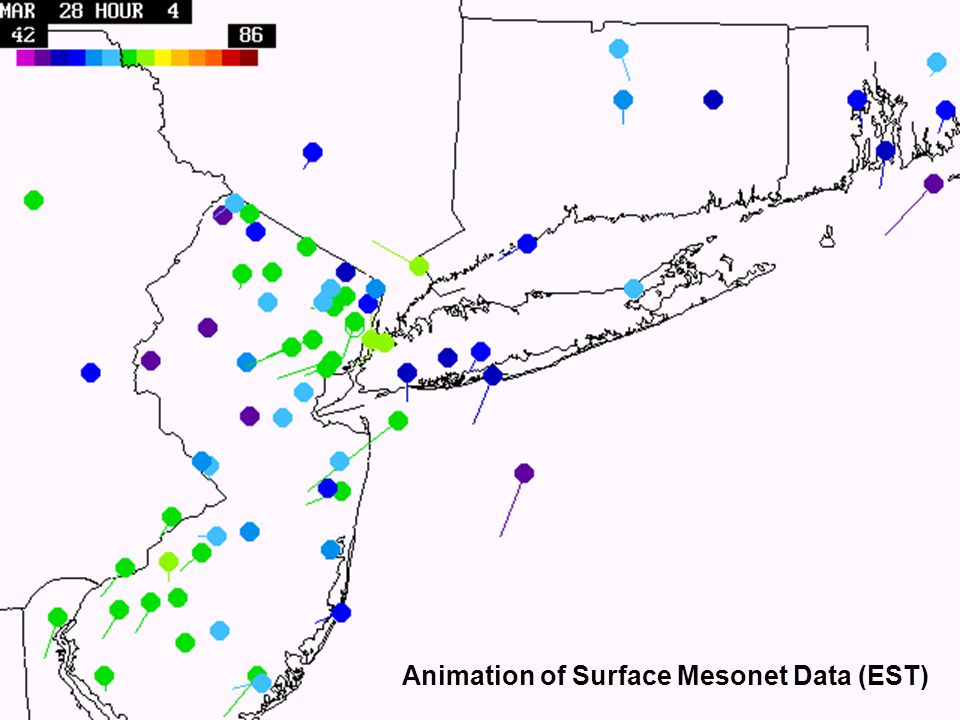
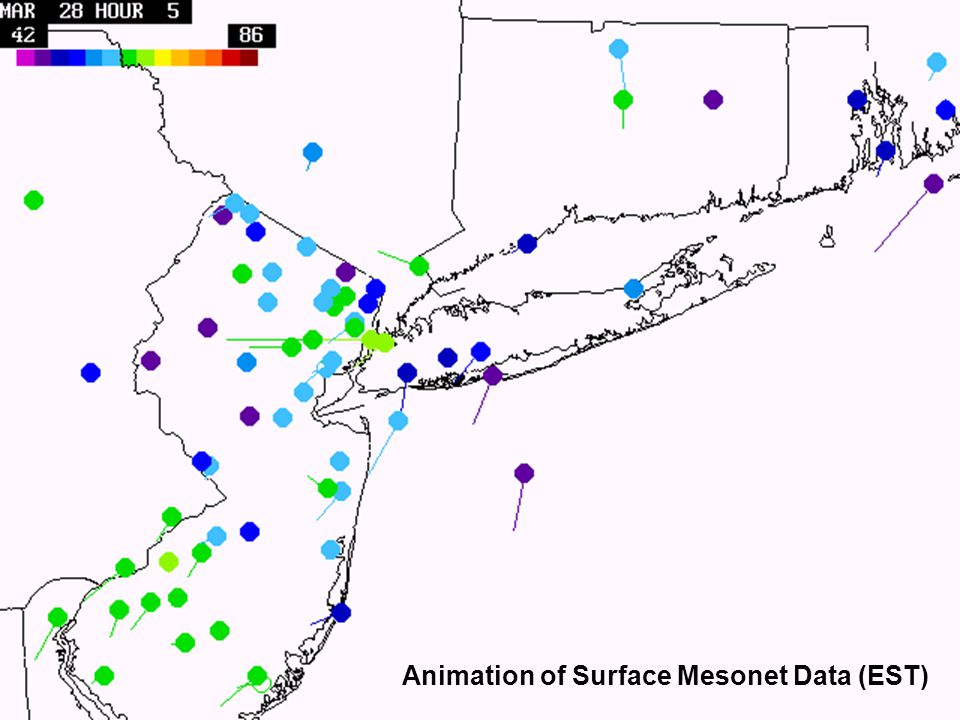
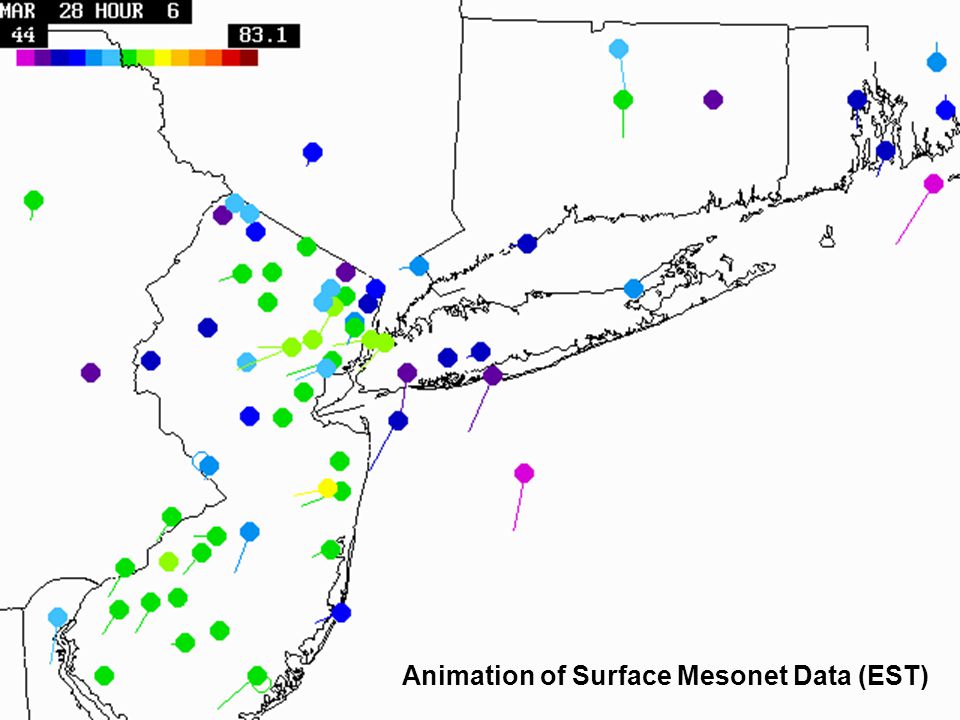
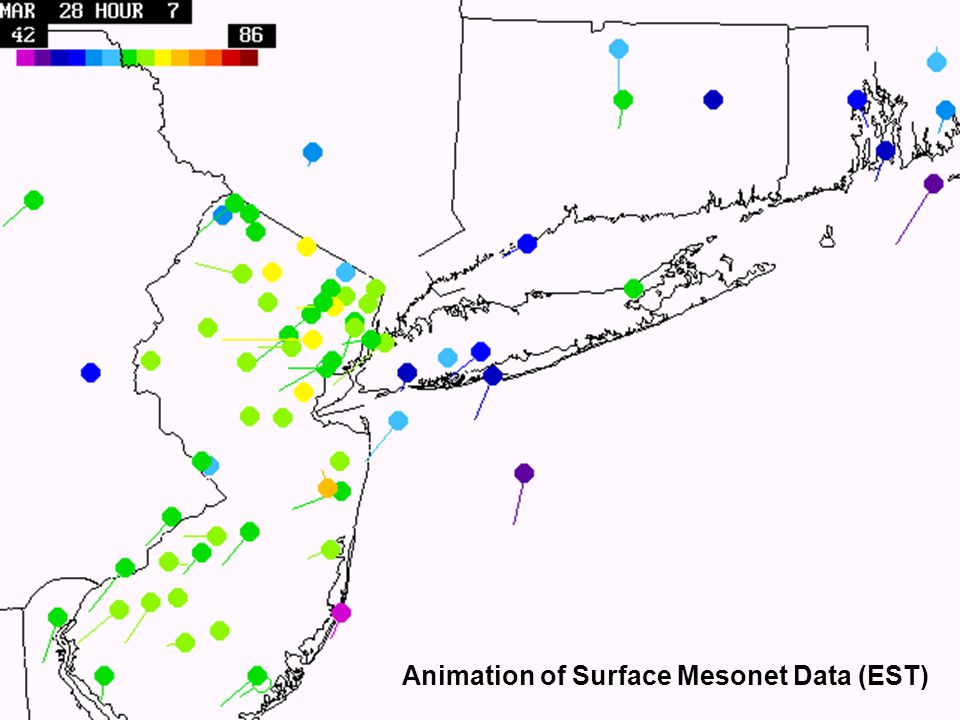
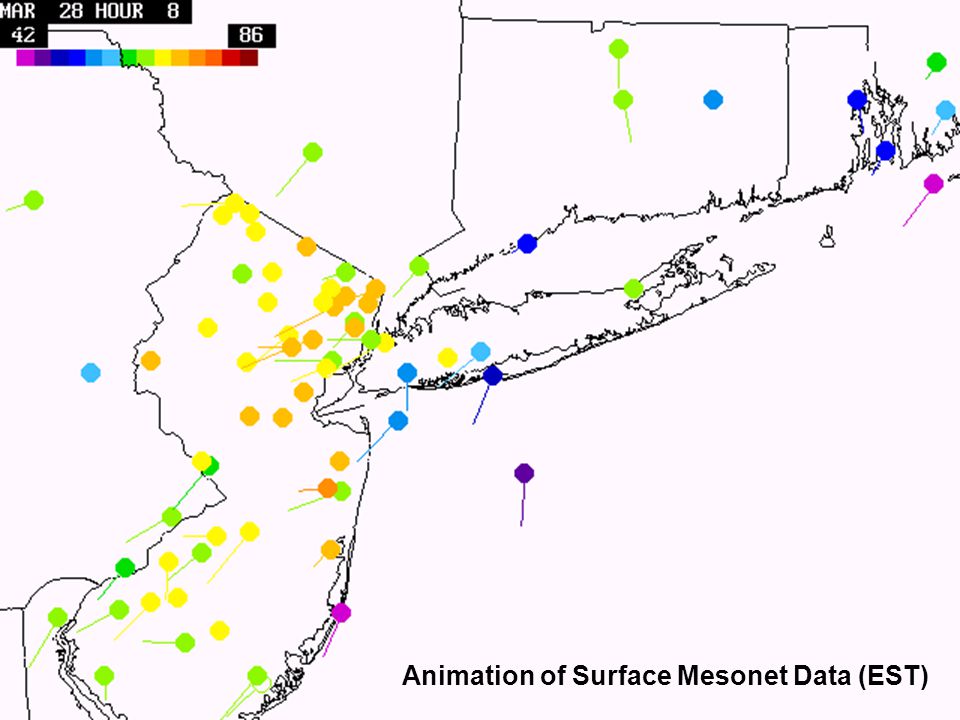
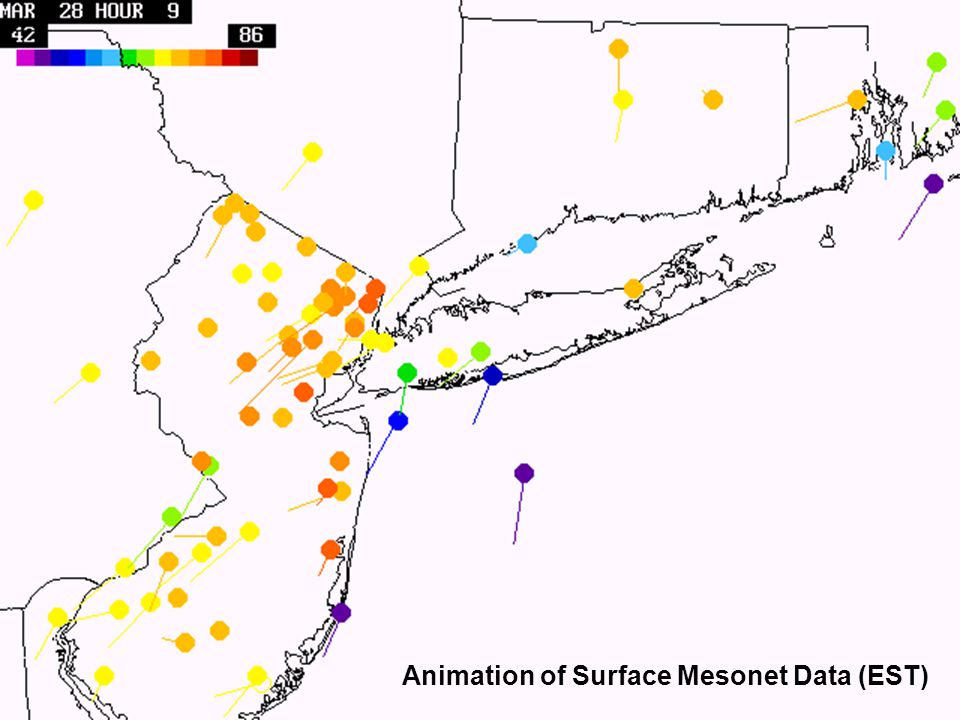
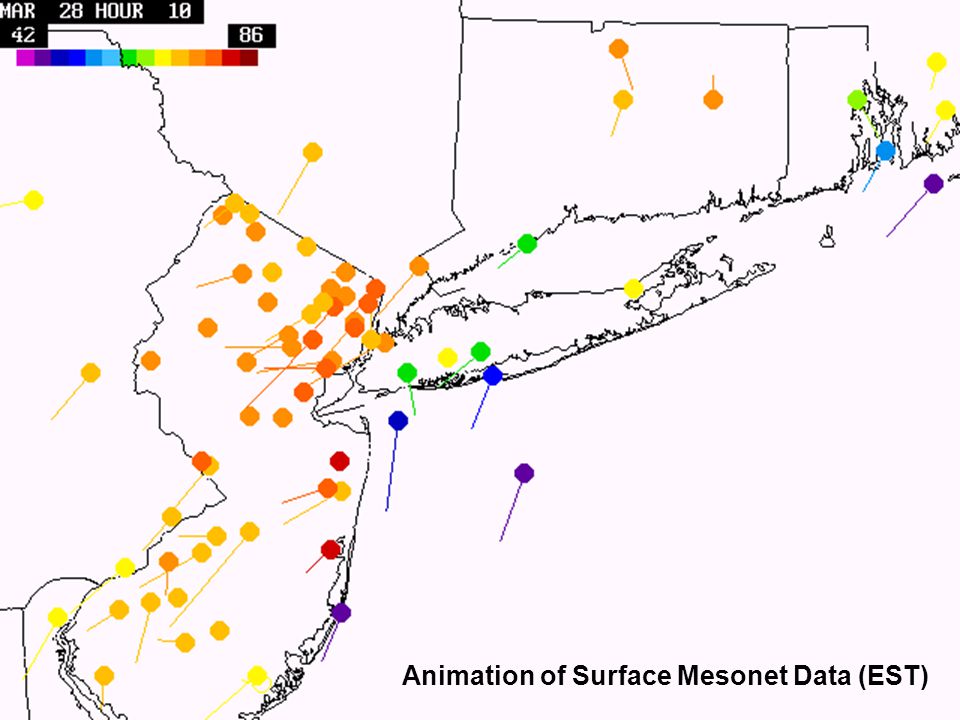
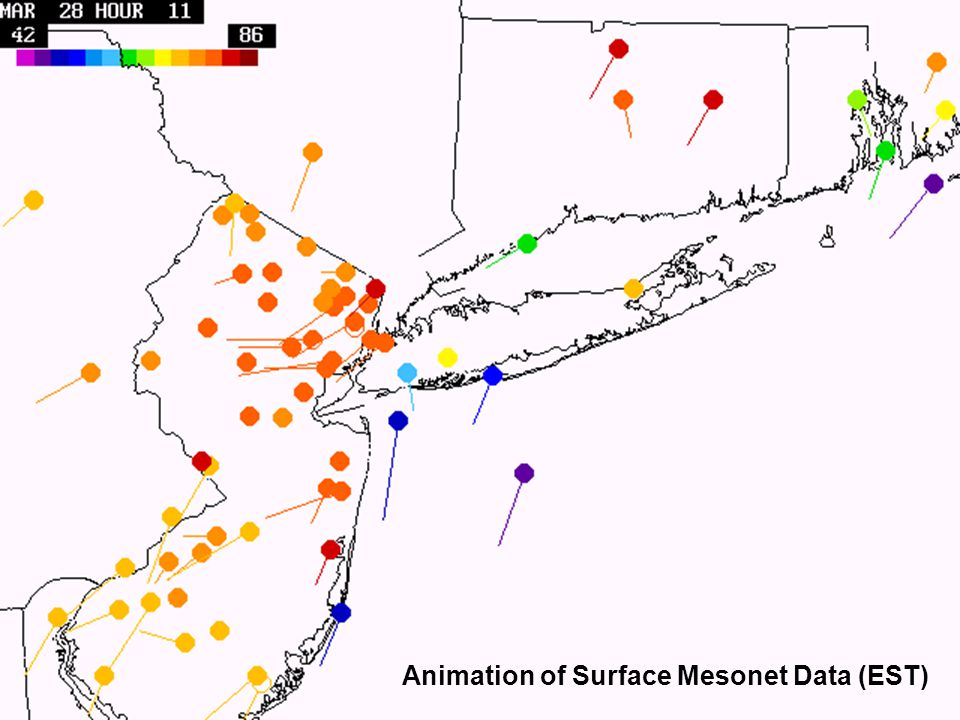
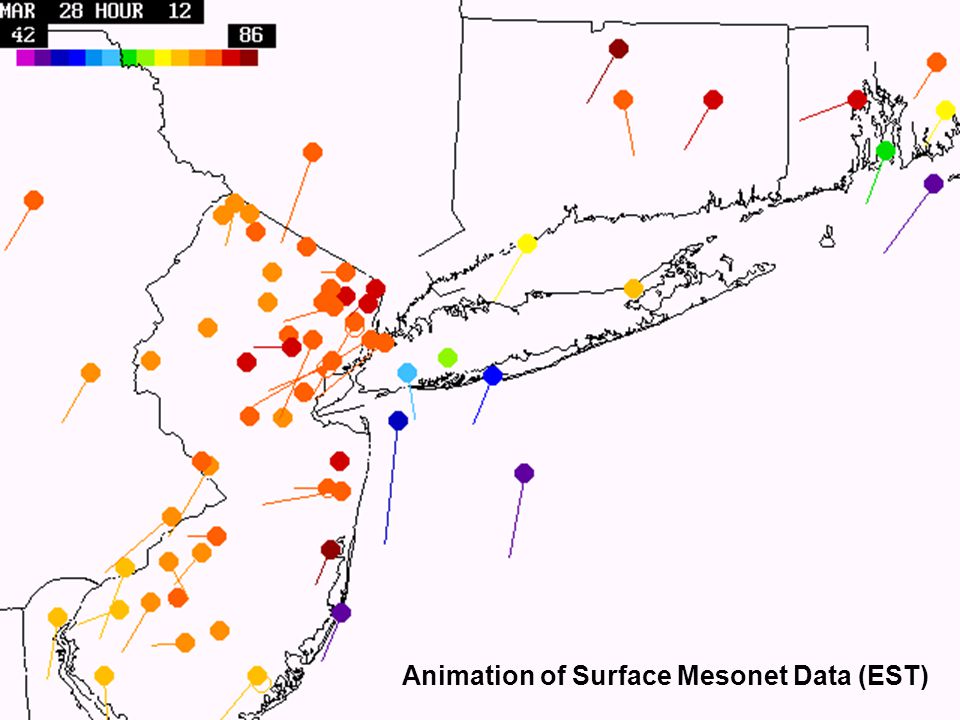
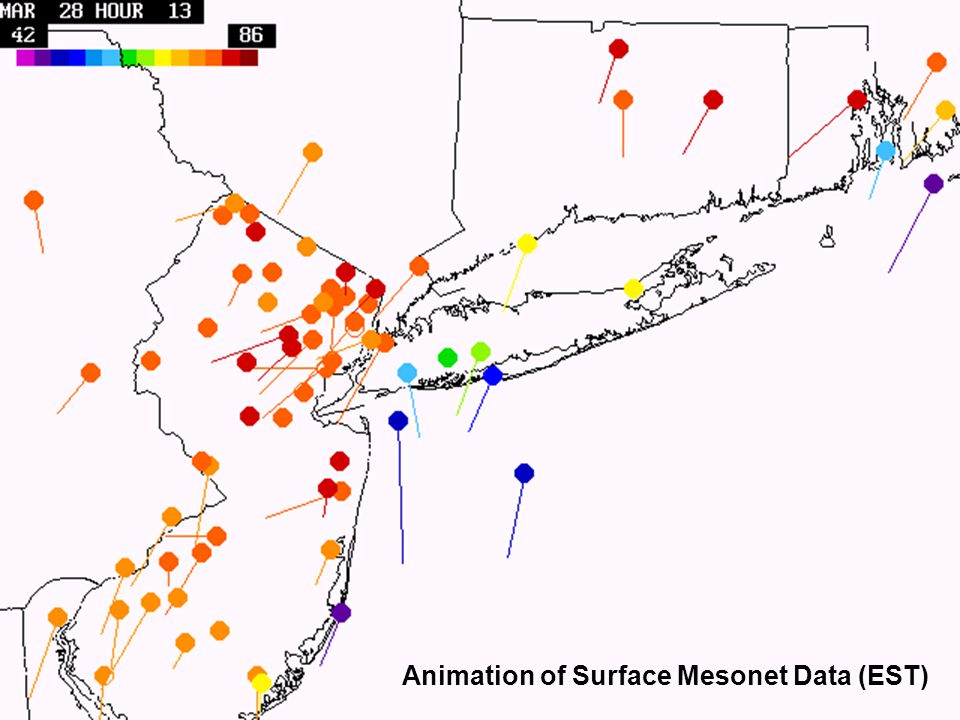
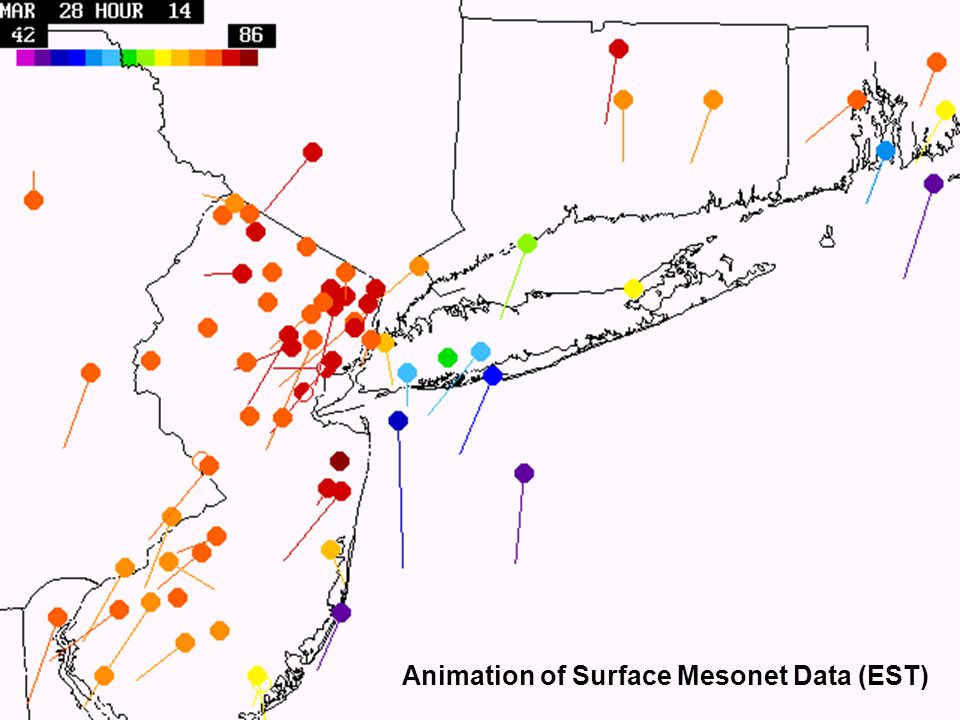
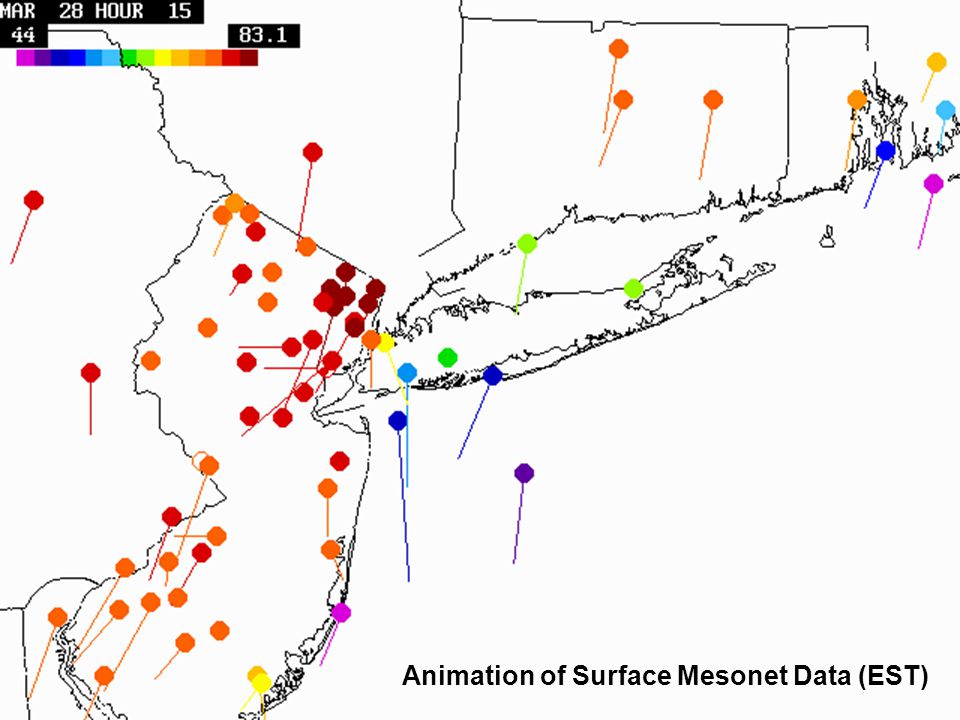
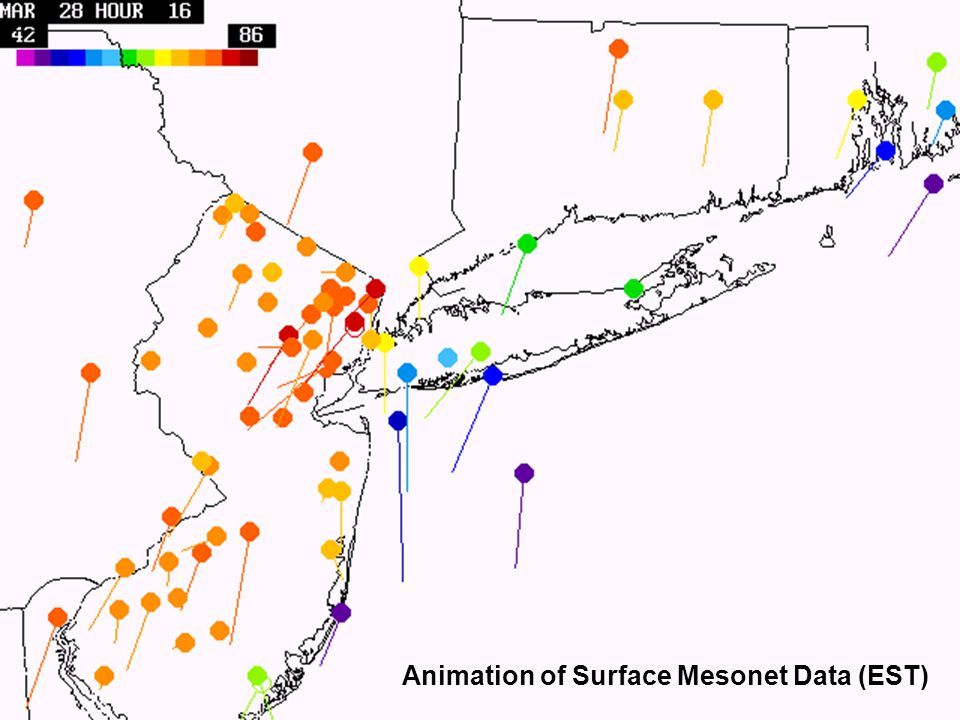
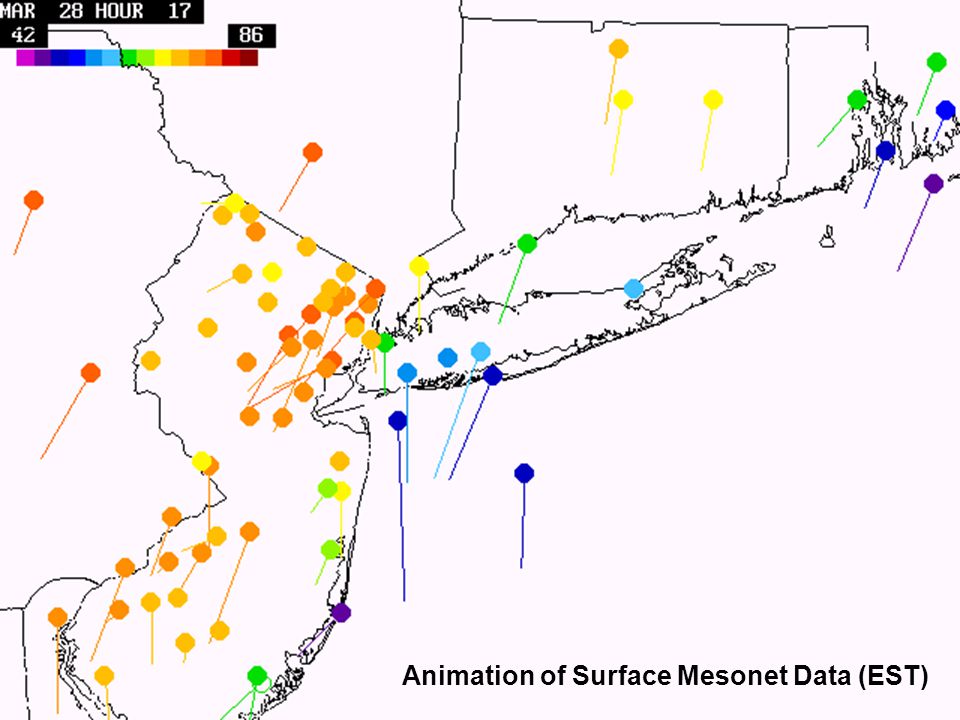
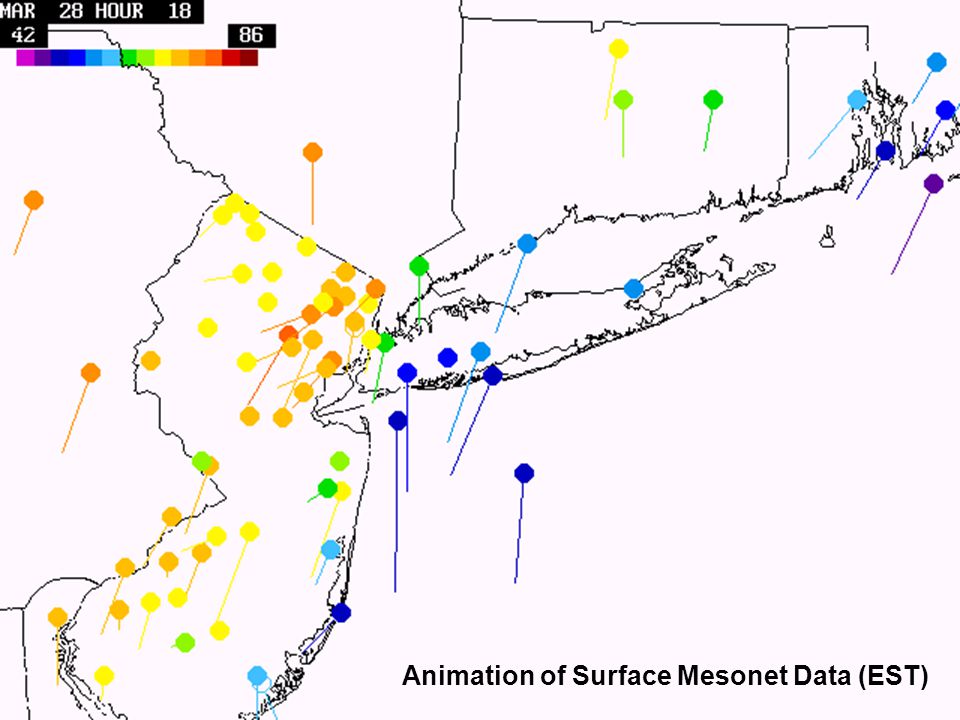
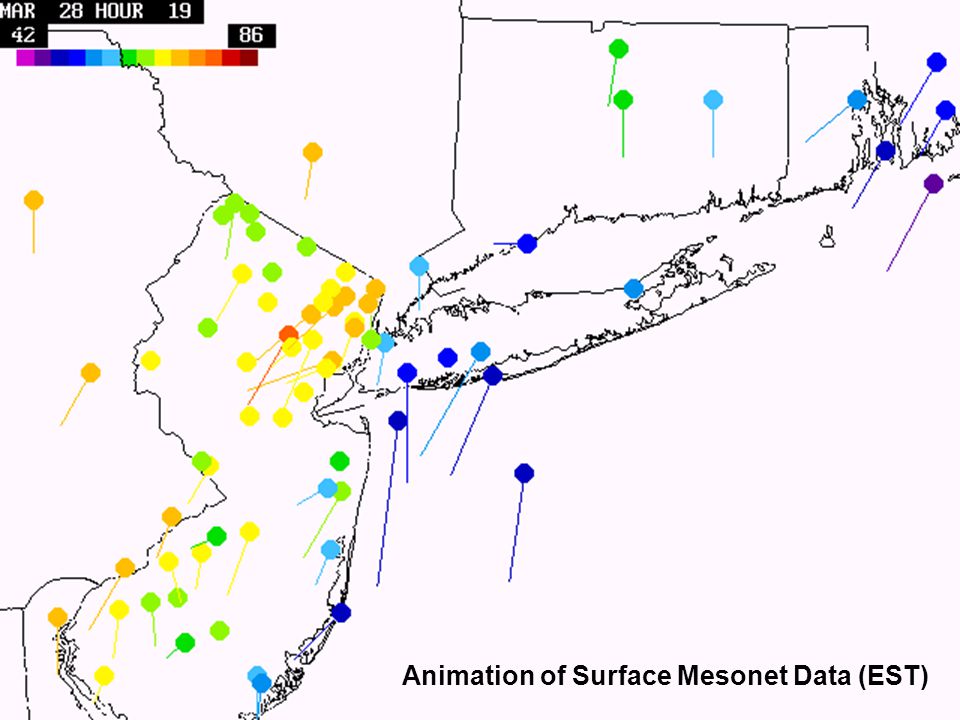
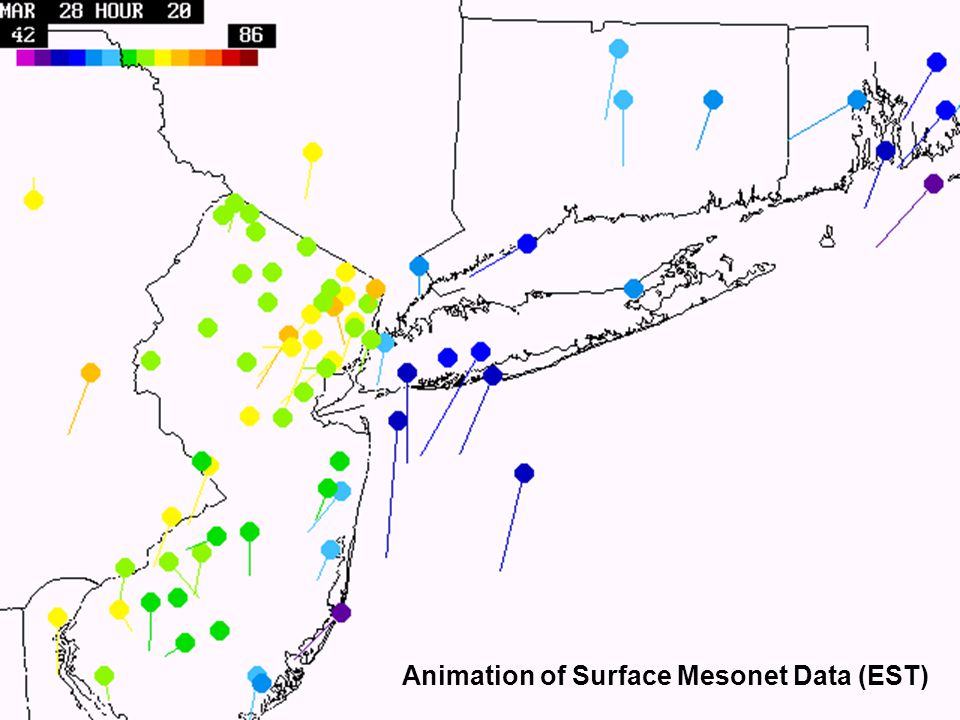
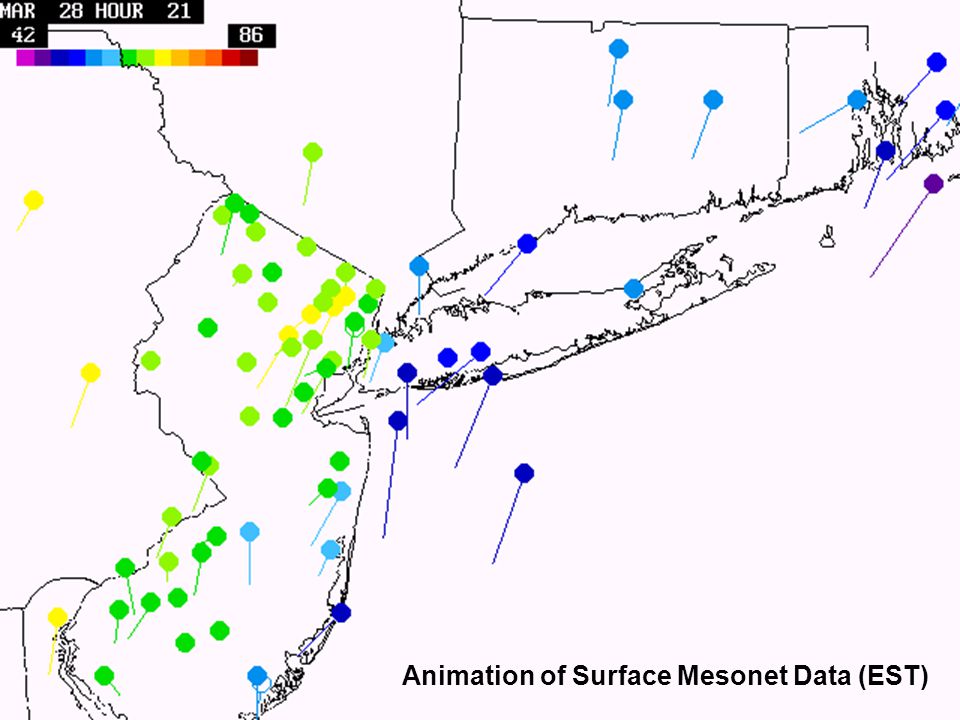
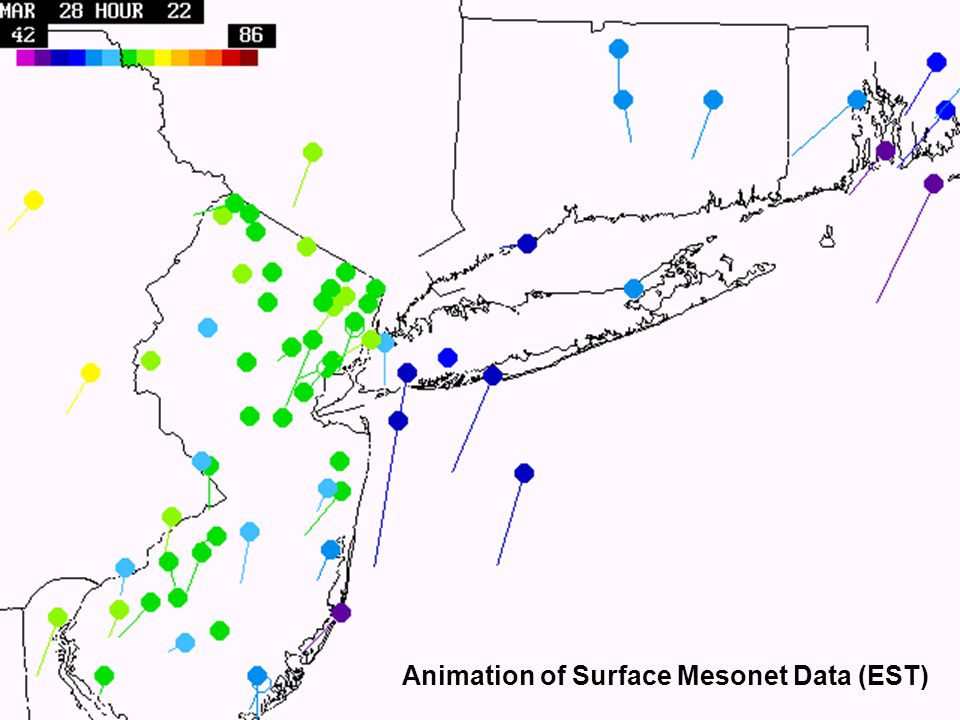
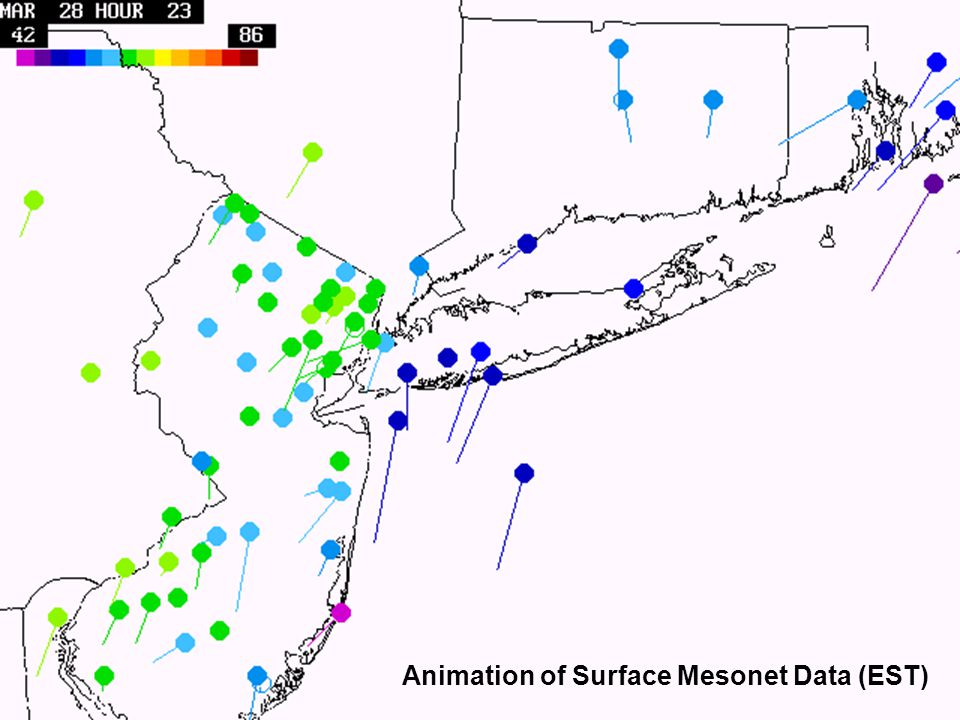
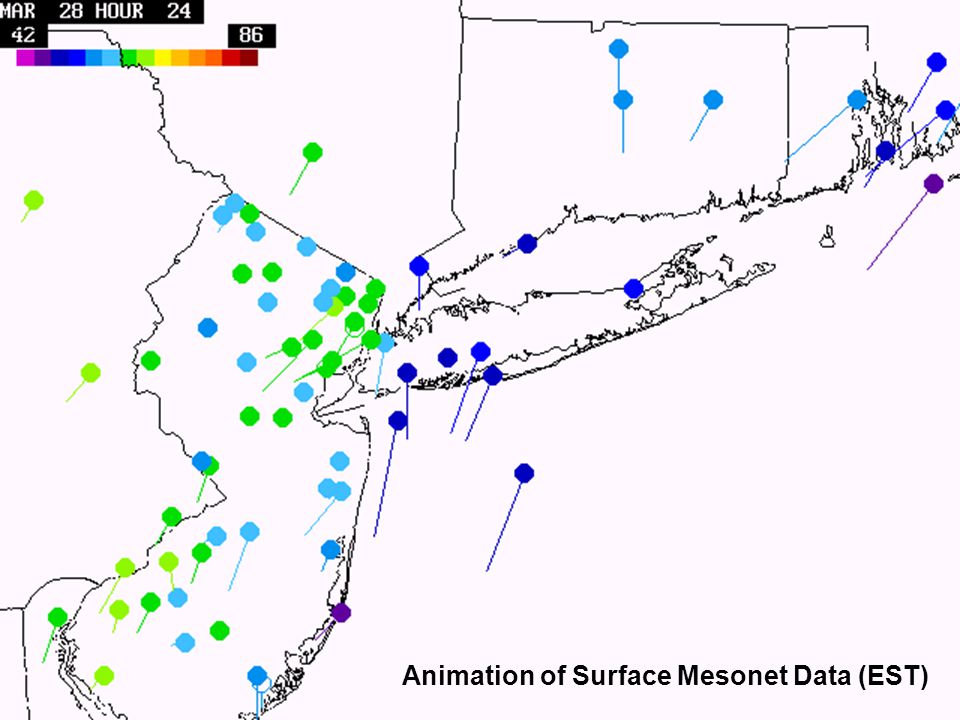
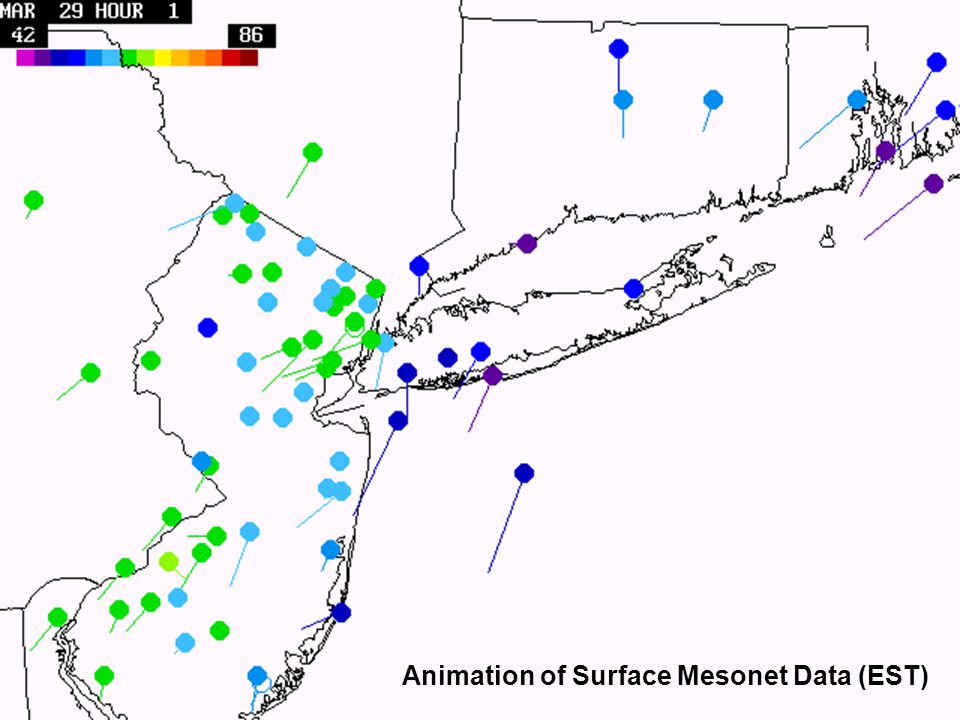
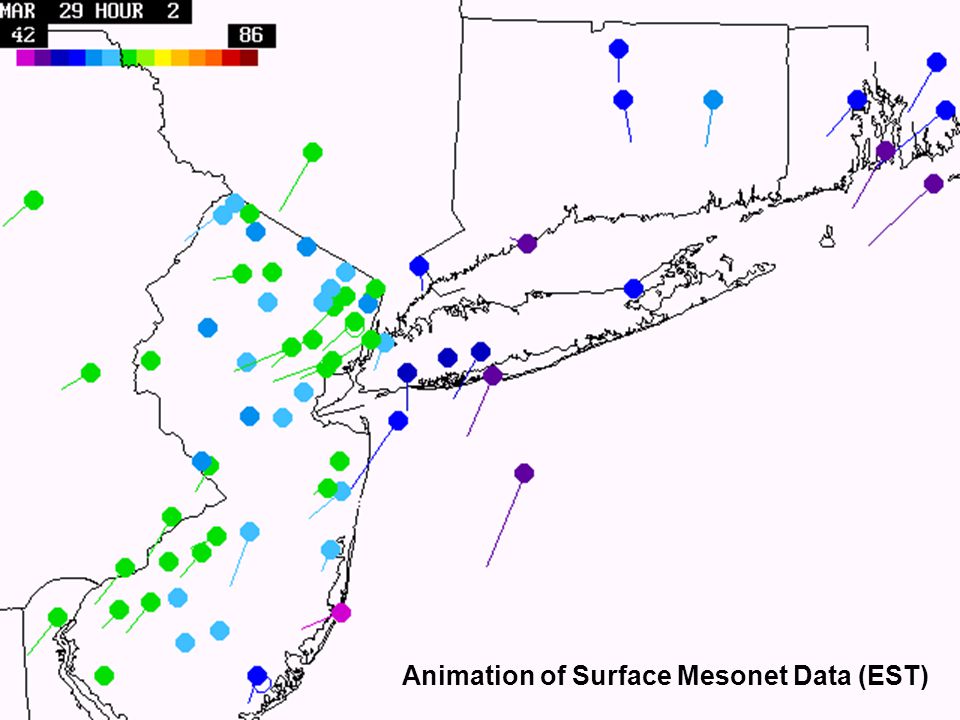
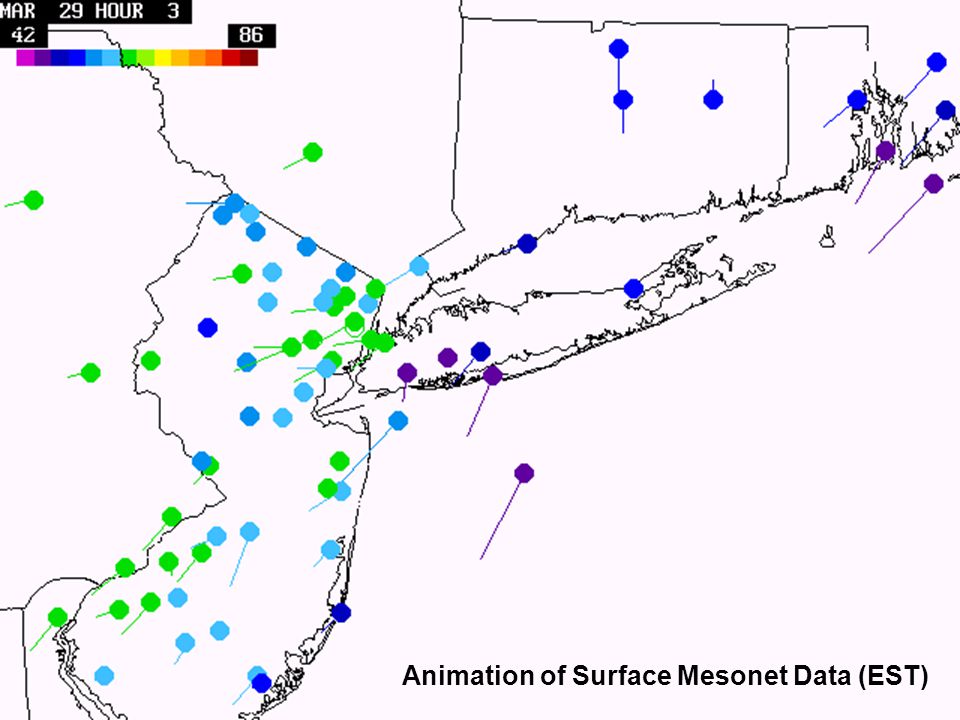
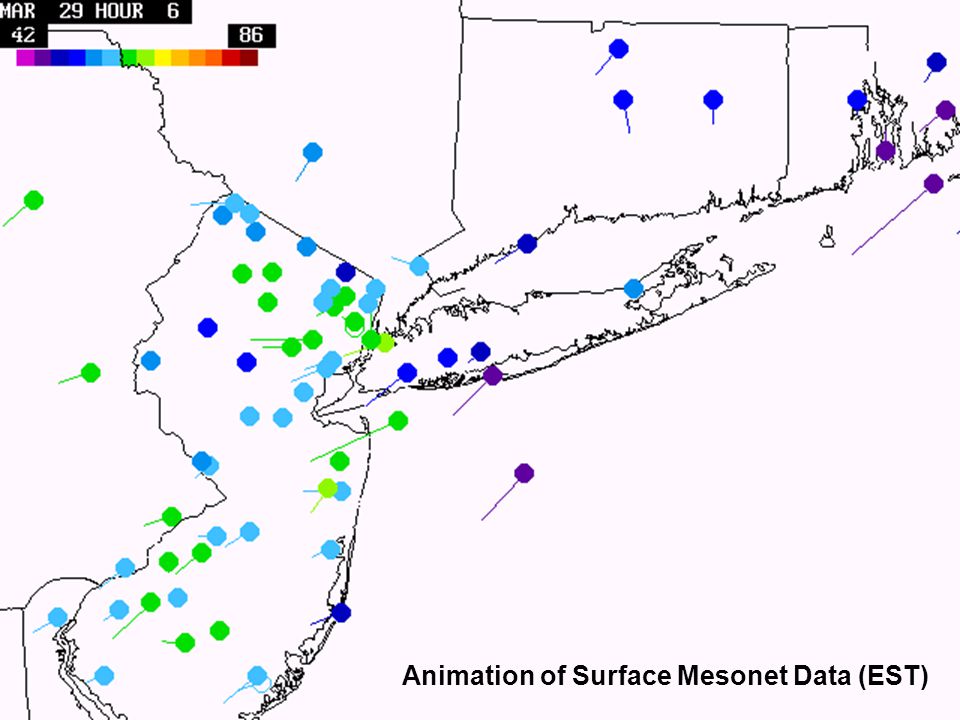
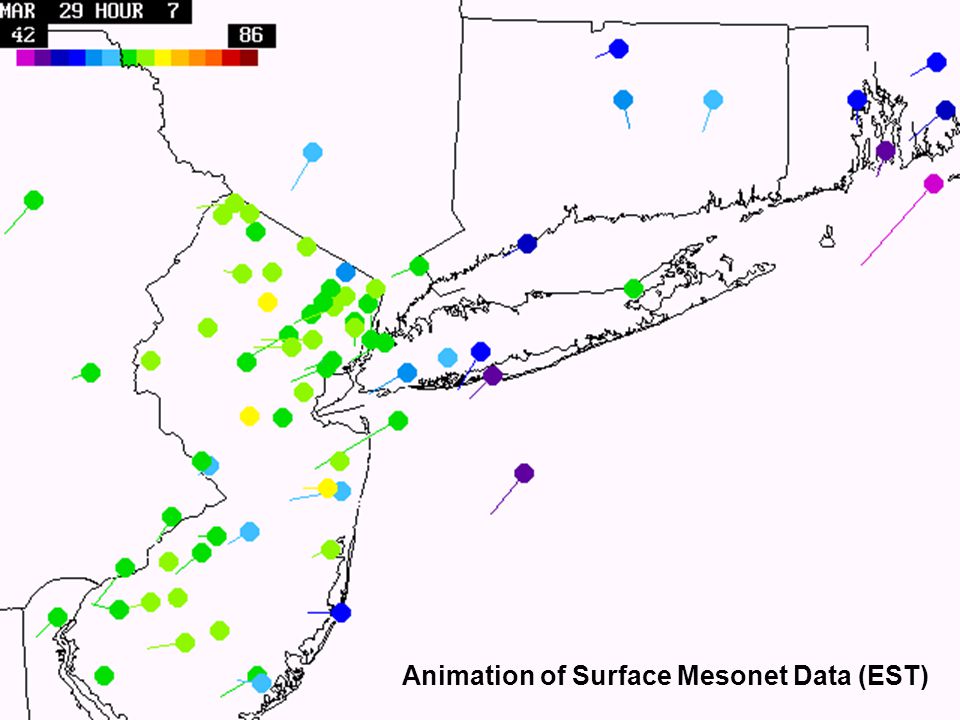
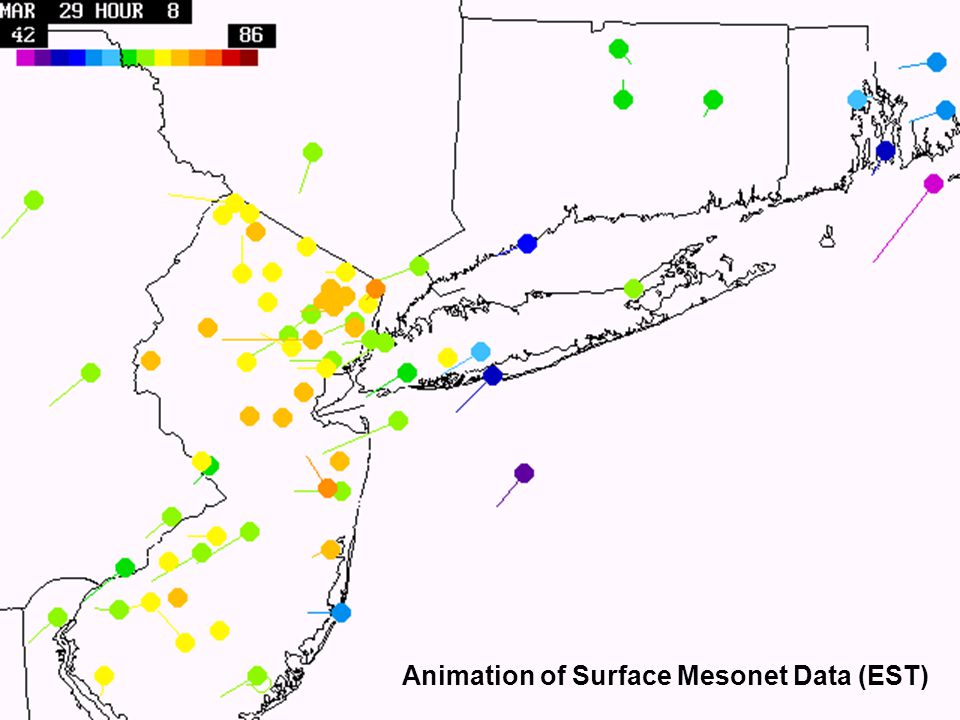
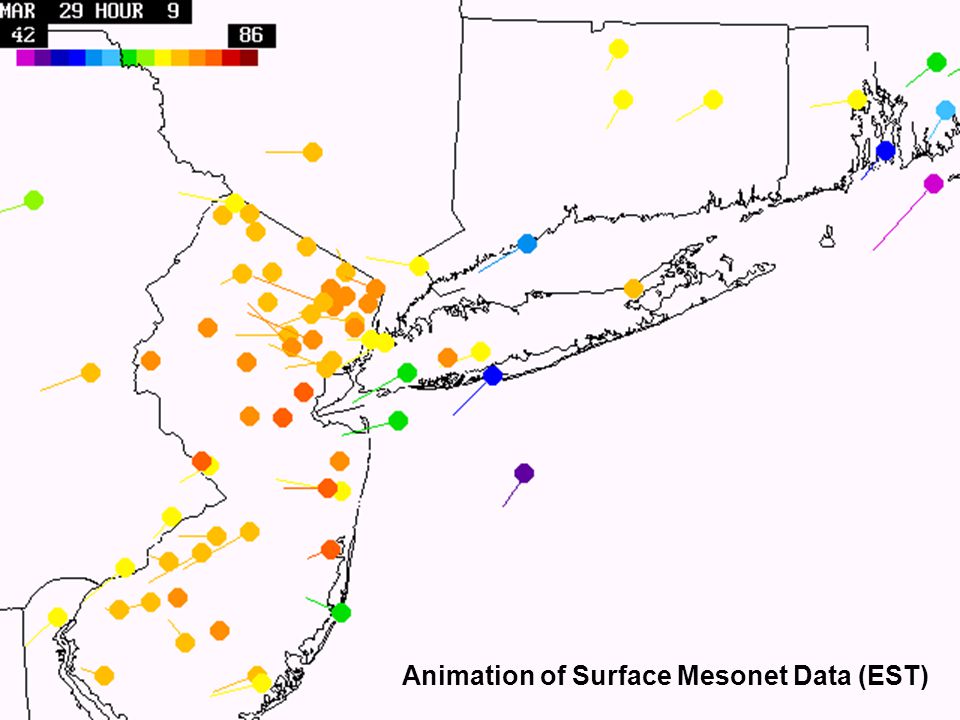
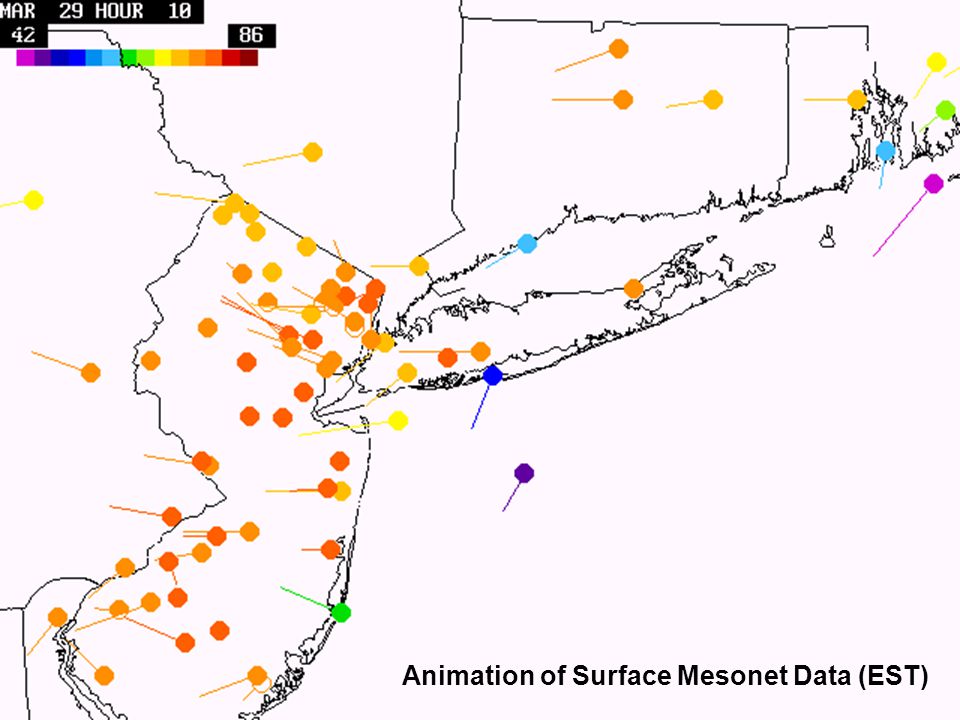
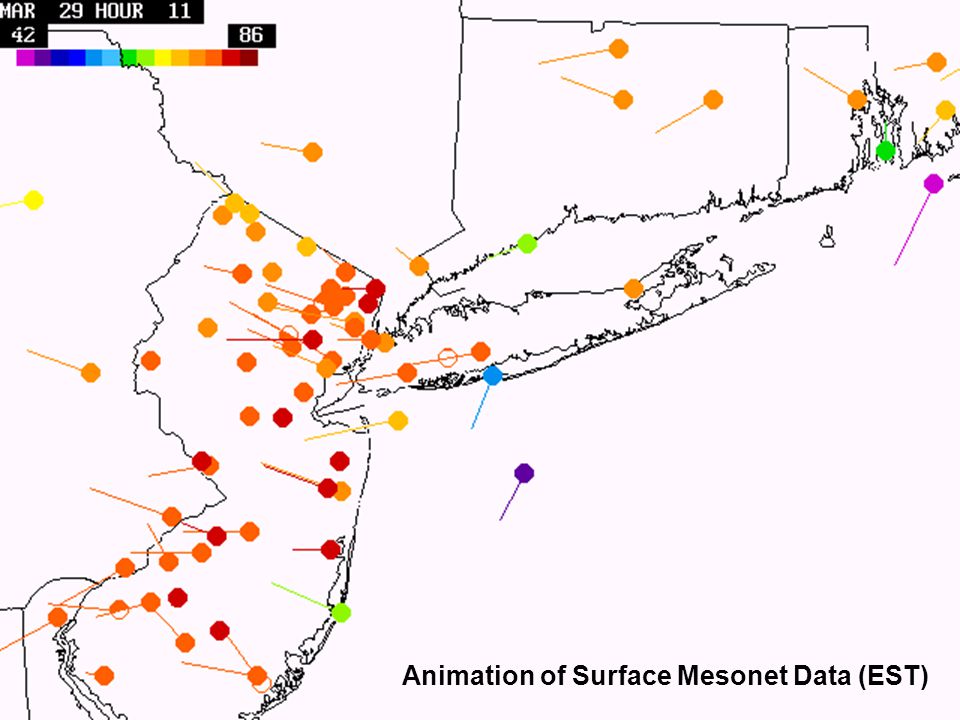
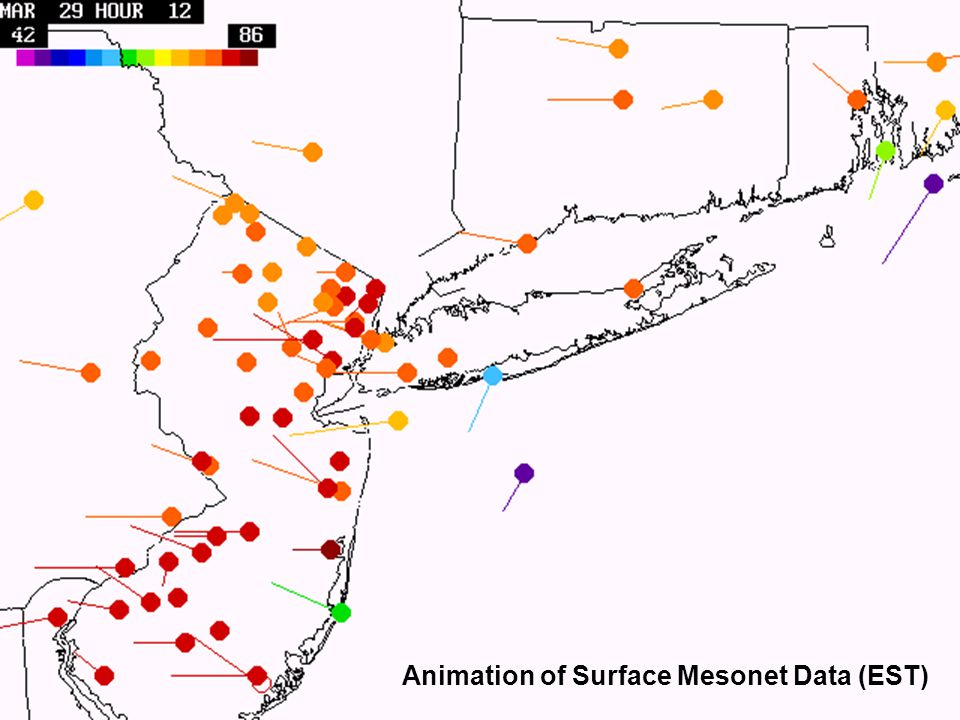
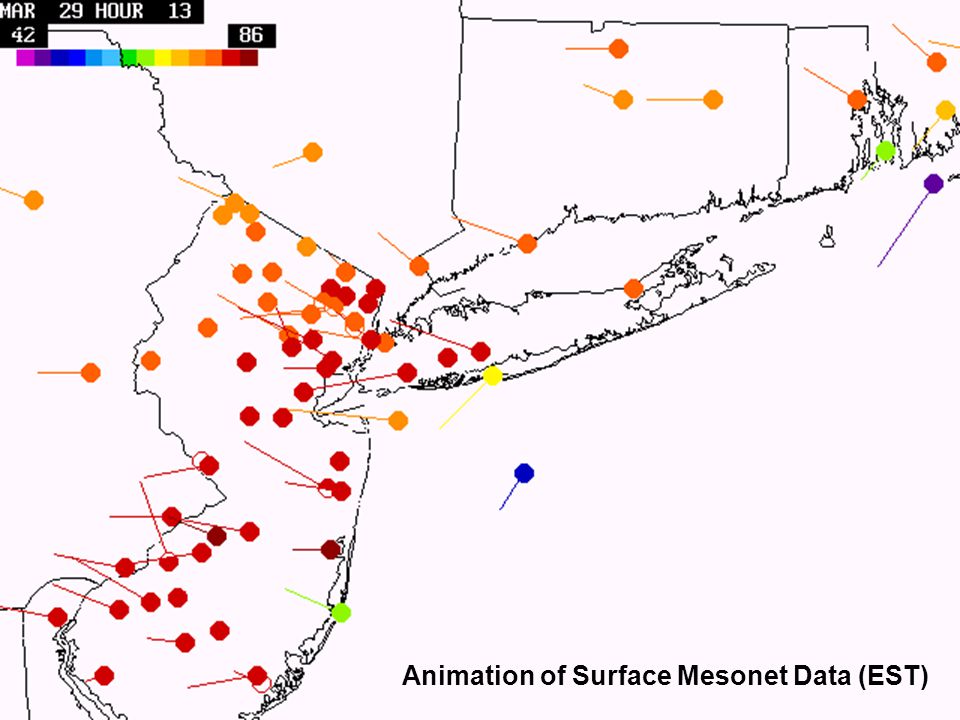
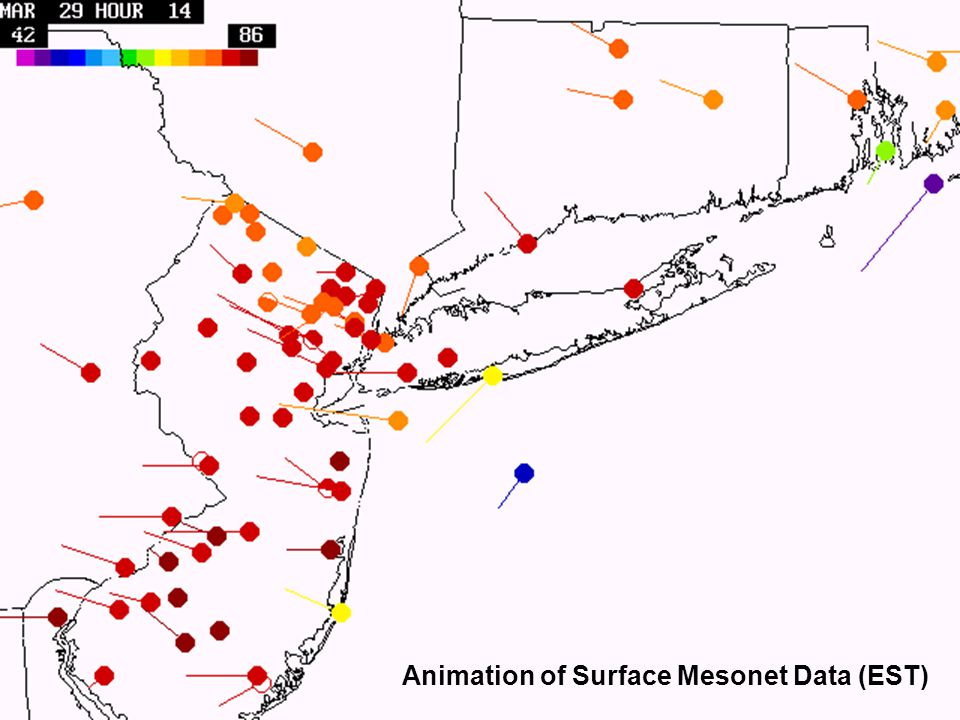
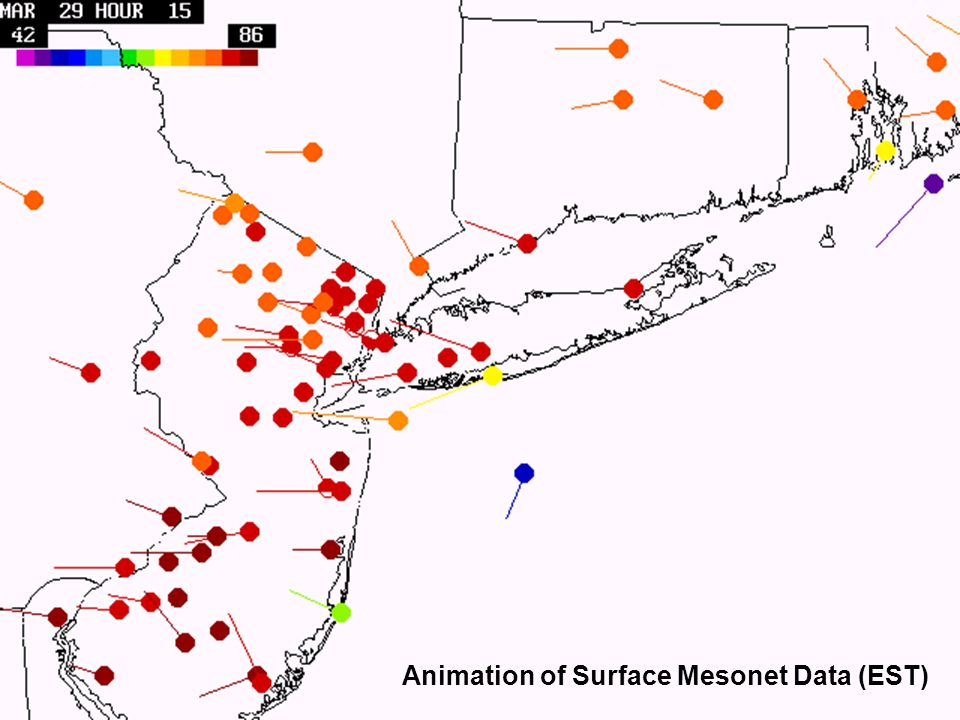
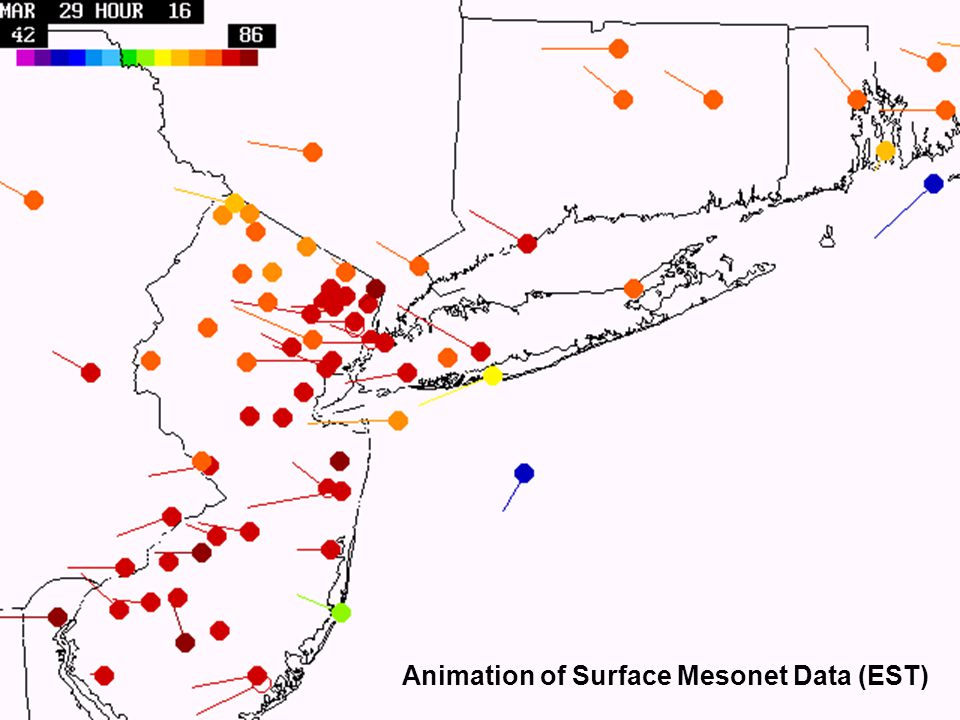
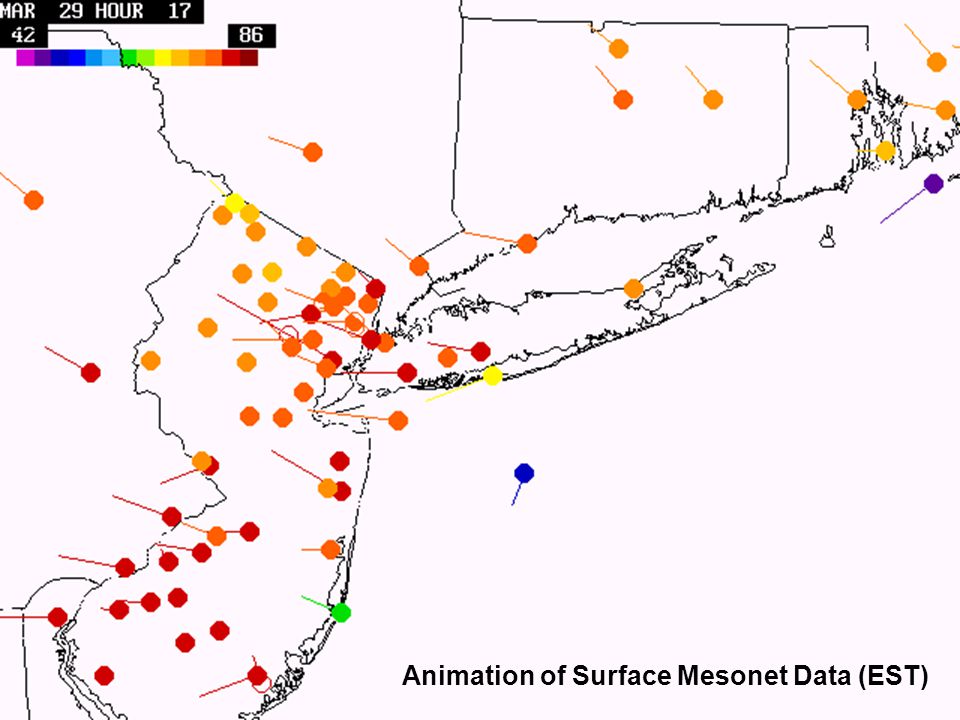
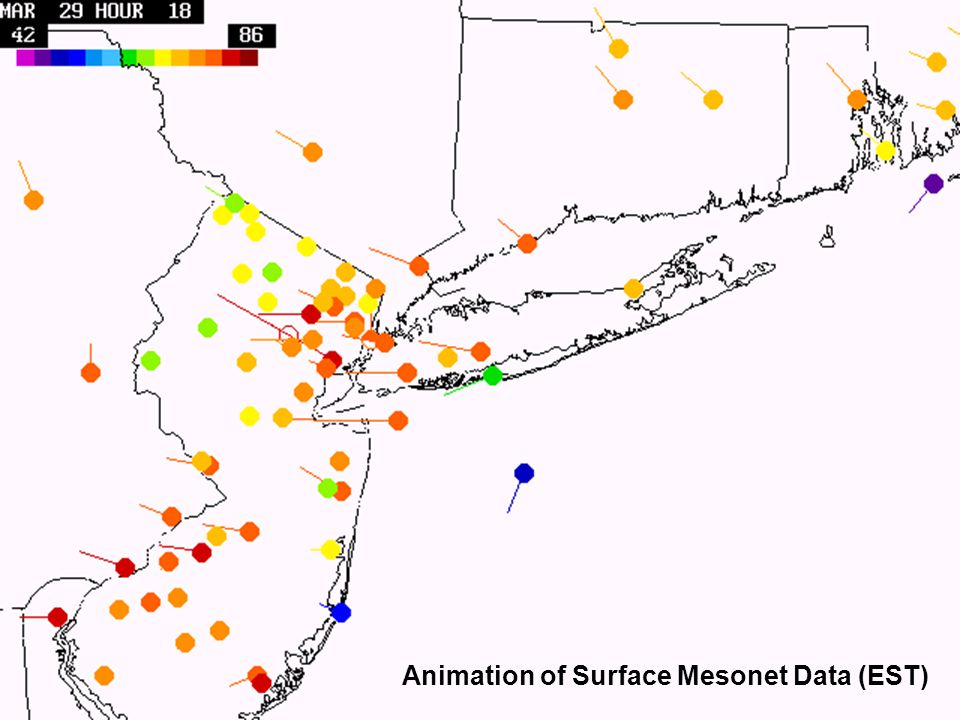
Animation of Surface Weather Data for the Strong Sea Breeze of 28 March 2004. Start Time 1500 EST (2000 UTC) 27 March End Time 1800 EST (2000 UTC) 29 March Note: 1. Strong westerlies displaced the sea breeze on 27 March and largely suppressed it on 29 March. 2. SSW winds on 28 March enhanced the strong sea breeze over Long Island and led to a sharp sea breeze front over New Jersey.
 27 March End Time 1800 EST (2000 UTC) 29 March Note: 1. Strong westerlies displaced the sea breeze on 27 March and largely suppressed it on 29 March. 2. SSW winds on 28 March enhanced the strong sea breeze over Long Island and led to a sharp sea breeze front over New Jersey..")
11
Animation of Surface Mesonet Data (EST)
")
63
MM5 Simulations of Sea Breeze (3rd mesh 2 km) To reproduce the sea breeze two modifications had to be made. 1. Correct the smoothed objective SST and Reservoir T analyses. 2. Double vertical resolution in the Atmospheric Boundary Layer The next slides show the 1. Objective and corrected SST analyses. 2. IR Skin Temperatures (verifying corrected SST analysis) 3. MM5 simulation at 1900 UTC with corrected SST analysis and (a) lower, (b) higher boundary layer resolution (note fog)
 3. MM5 simulation at 1900 UTC with corrected SST analysis and (a) lower, (b) higher boundary layer resolution (note fog).")
64
4 6 8 Adjusted SST isotherms SST analysis (°C) based on NCEP 2.5°x 2.5°gridded analysis
 based on NCEP 2.5°x 2.5°gridded analysis")
65
27 MAR 0800 UTC IR Satellite Skin Temperatures 0700 28 MAR 1998

66
a

67
b

68
28 MAR 0700 UTC Concluding Remarks Dense mesonets and high resolution modeling will continue to improve reporting and forecasting accuracy of sea breezes and other local weather phenomena such as back door cold fronts. We urge better coordination of the many private weather stations maintained by afficiandos, even if standardization remains a problem.

Similar presentations


 2 Institut d’Estudis.>")


