Download presentation
Presentation is loading. Please wait.

1
Case Study: Impact of Above Ground Spent Fuel Storage on Nearby Meteorological Systems Jim Holian SAIC NUMUG Meeting Charlotte, NC June 2008

2
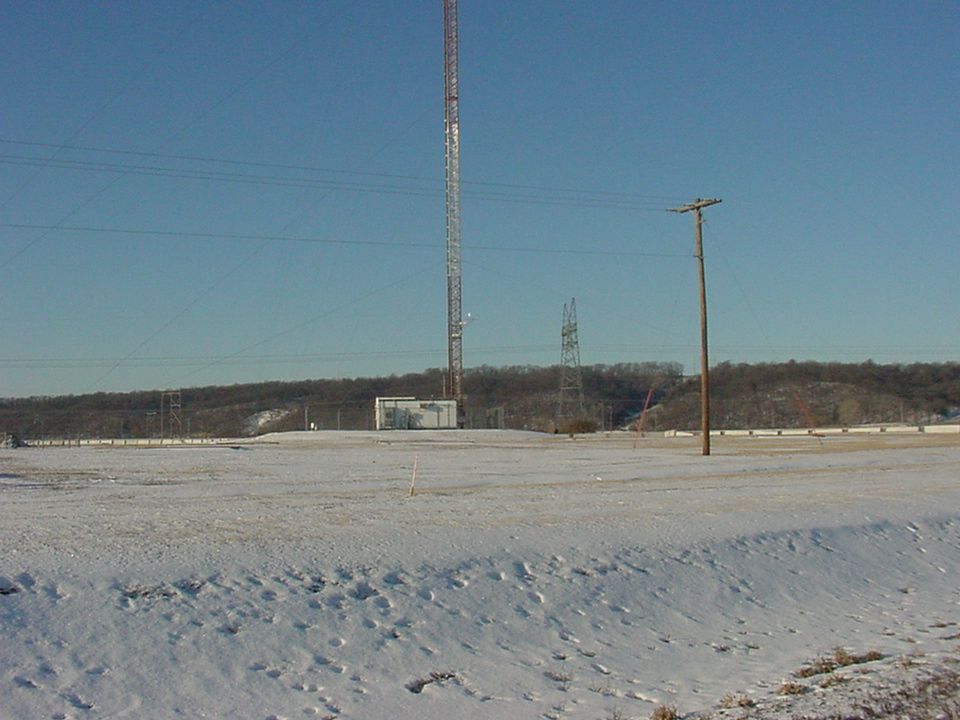
Evaluate the proposed Independent Spent Fuel Storage Facility Installation (ISFSI) on the meteorological monitoring system at the Cooper Nuclear Station, Brownville, Nebraska Study
 on the meteorological monitoring system at the Cooper Nuclear Station, Brownville, Nebraska Study")
3
Background Spent fuel pool near capacity Four potential ISFSI sites identified Numerous configurations examined Three sites eliminated after soils study Site selected is closest to Met Tower SAIC task with determining any potential impact

10
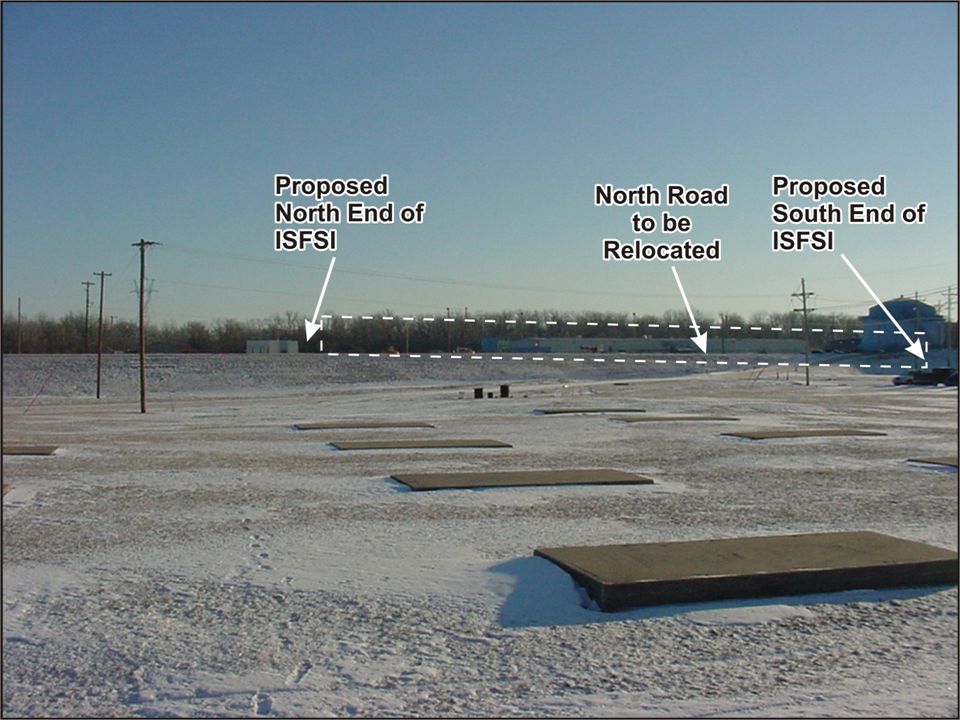
ISFSI Facility 450-feet northeast of the Met Tower Concrete base elevated 10-feet 46 Horizontal Storage Modules (HSMs) Each HSM 10’W X 20’L X 18’H Overall size is 40’W X 260’L 511sq-ft Storage Building south end
 Each HSM 10’W X 20’L X 18’H Overall size is 40’W X 260’L 511sq-ft Storage Building south end")
11
Impacts on Meteorological Data

12
Meteorological Data Used in Analyses Five years of onsite data (2001-2005) 97% data availability Annual Wind Roses Joint Frequency Distributions (JFDs) for stability classification
 97% data availability Annual Wind Roses Joint Frequency Distributions (JFDs) for stability classification")
14
ISFSI Structure Impacts HSMs extend up to 28 feet above met tower base Distance to tower is approximately 450 feet Distance to height ratio of 16:1 Structure impacts felt with wind direction from 045-080 degrees (NE-ENE) Frequency is only 5.3% (5-year average)
 Frequency is only 5.3% (5-year average)")
15
ISFSI Thermal Impacts NUHOMS TN-61BT HSMs to be installed By design, HSMs dissipate heat by natural conduction Air enters two openings at base, circulates, and vents out the top

16
Two Specific Scenarios Studied (1) 46 HSMs with maximum heat load of 18.3 kilowatts (kW) (2) 8 HSMs loaded first two years only Vary heat load from 18.3 kW to 9 kW Vary wind speeds from 1.0 m/s to 4 m/s Vary stability
 46 HSMs with maximum heat load of 18.3 kilowatts (kW) (2) 8 HSMs loaded first two years only Vary heat load from 18.3 kW to 9 kW Vary wind speeds from 1.0 m/s to 4 m/s Vary stability")
17
5-Year Stability at CNS A – 6% B – 5% C – 6% D – 33% E – 29% F – 11% G – 10%

18
Thermal Plume G stability truncated cone volume and cross sectional area at met tower is 2,061,044 ft 3 and 8,500 ft 2 respectively. (no ground reflection) D stability truncated cone volume and cross sectional area at met tower is 11,392,137 ft 3 and 46,700 ft 2 respectively (with ground reflection)
 D stability truncated cone volume and cross sectional area at met tower is 11,392,137 ft 3 and 46,700 ft 2 respectively (with ground reflection).")
19
Assumptions HSM air temperature is linear to heat load (based on 51°F rise at 24 kW load in NUHOMS ISFSI UFSAR) No conduction loss to ground around ISFSI No plume meander or mixing at edges (entrainment)
 No conduction loss to ground around ISFSI No plume meander or mixing at edges (entrainment)")
20
Results

21
Estimated Met Tower ΔT (°F) 46 HSM Casks Loaded – G Stability HSM Heat kW Wind Speed (m/s) 1234 18.31.700.900.570.45 151.400.740.470.37 121.100.550.370.28 90.830.410.280.21
 46 HSM Casks Loaded – G Stability HSM Heat kW Wind Speed (m/s)")
22
Estimated Met Tower ΔT (°F) 46 HSM Casks Loaded – D Stability HSM Heat kW Wind Speed (m/s) 1234 18.30.310.160.100.08 150.250.130.080.07 120.200.100.070.05 90.150.070.050.04
 46 HSM Casks Loaded – D Stability HSM Heat kW Wind Speed (m/s)")
23
Estimated Met Tower ΔT (°F) 8 HSM Casks Loaded – G Stability HSM Heat kW Wind Speed (m/s) 1234 18.31.300.700.430.34 151.100.560.360.28 120.800.420.280.21 90.630.310.210.16
 8 HSM Casks Loaded – G Stability HSM Heat kW Wind Speed (m/s)")
24
Estimated Met Tower ΔT (°F) 8 HSM Casks Loaded – D Stability HSM Heat kW Wind Speed (m/s) 1234 18.30.120.060.040.03 150.100.050.03 120.080.040.030.02 90.060.030.020.01
 8 HSM Casks Loaded – D Stability HSM Heat kW Wind Speed (m/s)")
25
Frequency of Occurrence of NE through ENE Sector Wind G Stability - 0.5% with average wind speed of 2.0 m/s D Stability – 2.3% with average wind speed of 2.9 m/s All Stabilities – 5.3% with average wind speed of 2.7 m/s

26
Impacts Minimal over 95% of the time Separate study at CNS demonstrated that raising the 10-meter temperature 0.4 °F changed the peak predicted downwind radiological doses by 90% (worst case)
")
27
Mitigation Options Move ISFSI site? – no other acceptable location Move met tower? – not practicable Erect new met tower in an acceptable location that preserves the long term meteorological data record Risk acceptable, do nothing

28
CNS Decision Erect a new 100-meter tower Select an area that best reflects the original existing tower location Take into account current and future expansion of the plant Preserve the long term data record

32
New 100-meter Tower New 100-meter tower will be nearly identical to existing tower and equipment Dual elevator system with sonic sensors Construction to begin 8/1/08 6 month comparison of data with existing 100-meter tower to begin 9/15/08 New tower to be declared operational by 4/1/09

33
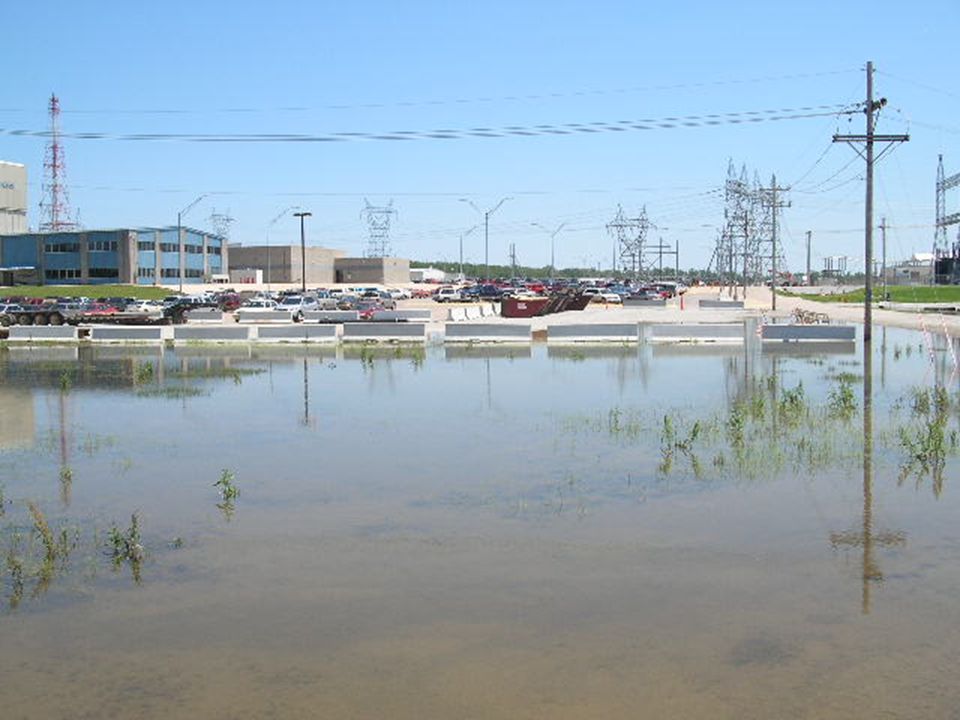
Then came the floods of 2008!

37
Questions?

Similar presentations


 Mark T. Carroll Heather A. McDonald Andrew J. Lotz.>")


 Dry Cask Storage NUCP 2311 1.>")


 Kenneth G. Wastrack Doyle E. Pittman Jennifer M. Call Tennessee Valley Authority.>")


