Download presentation
Presentation is loading. Please wait.

1
1 st & 9 th Area Medical Laboratories Idaho National Laboratory Interagency Exercise September 2008

2
Agenda History AML Team Building Exercise Goals BROOM System Workflow Results Review

3
Interagency Players JPEO-CBD EPA DHS DoD NGB CSTs & HAZMAT teams Also involved in workgroup: - FBI - CDC - NIST

4
Area Medical Laboratory INL-1 (‘07) – Five personnel, 9 th AML, 4 th squad INL-2 (‘08) – 14 personnel – 9 th AML 4 th squad – lead – 9 th AML 3 rd squad – 1 st AML 4 th squad – 1 st AML 3 rd squad
 – Five personnel, 9 th AML, 4 th squad INL-2 (‘08) – 14 personnel – 9 th AML 4 th squad – lead – 9 th AML 3 rd squad – 1 st AML 4 th squad – 1 st AML 3 rd squad")
5
Problem “How to prove that a room isn’t contaminated?” GAO Report – post attack analysis, GAO-05-493T cited lack of validated sampling plans Evaluation of sampling techniques and their efficacy in an operational environment

6
Test Plan Based on INL-1 small scale study – sampling strategies, efficiency of sampling methods, testing methods & validation of dispersal and sampling models – 5 test events Operational evaluation Reduce sample numbers without losing robustness Factors affecting detection minimums

7
Test Plan (cont.) Event 1 – ORI – Characterization & Clearance Event 2 – Characterization & Clearance Event 3 – Characterization & Clearance Event 4 – Characterization & Clearance Event 5 – Characterization & Clearance
 Event 1 – ORI – Characterization & Clearance Event 2 – Characterization & Clearance Event 3 – Characterization & Clearance Event 4 – Characterization & Clearance Event 5 – Characterization & Clearance")
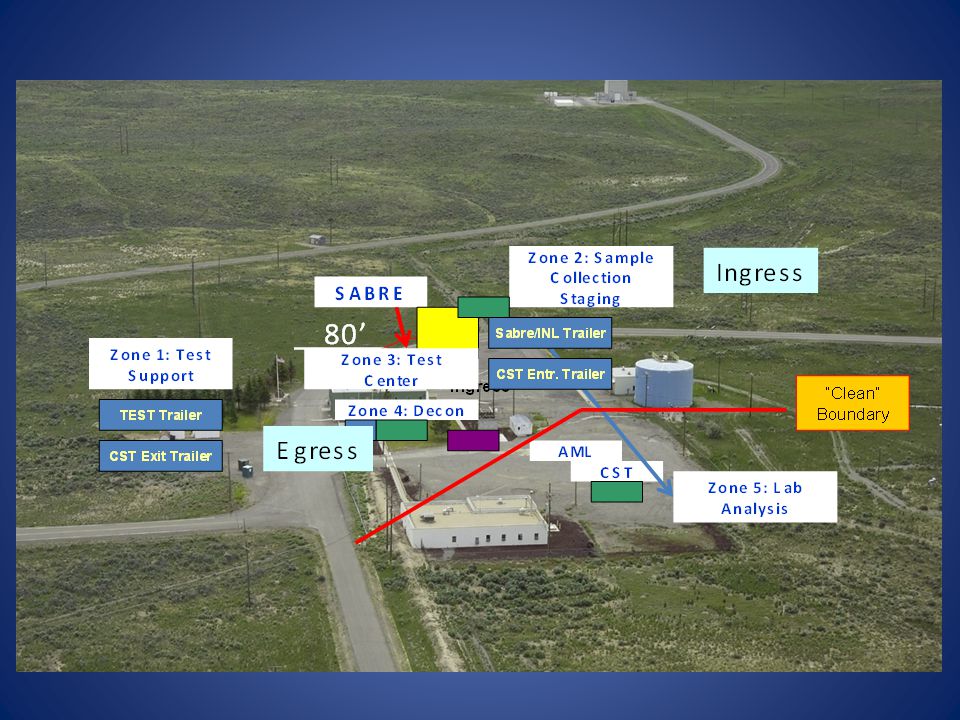
8
Test Facility

10
Laboratory Set-up 4 section TEMPR Grey zone 3-1 ISO Shelter Entry Storage Power Autoclaves

11
Sample Collection Wipes Swabs Vacuum socks DFUs RMCs

12
Sample Receipt Logged into laboratory with the BROOM system

13
Building Restoration Operations Optimization Model - BROOM A decision support tool to collect, manage, and analyze sample data –Secure SQL Server database –GIS mapping & 3D visualization –Geostatistical analysis tools –Uncertainty analysis –Interfaces with VSP for statistical sampling design Data collection –Hand-held wireless PDAs with barcode readers and laser rangefinders –GPS for outdoors –Camera for photo documentation –Paperless data transfer –Secure transmission of data –Chain of custody report WITS – Where Is That Sample?

14
Extraction & Testing Samples extracted with PBST Filter plating Spiral plating Q-count RV-PCR (random 10%)
")
15
Results - Characterization

16
Results - Clearance Event SwabSock VacuumWipeAll Methods JPJPJPJP ORI 0/2 0/110/570/110/550/240/114 Test 2 0/2 0/110/590/80/580/210/119 Test 3 NA0/40/140/640/190/530/330/121 Test 4 0/2 0/230/600/90/570/340/119 Test 5 NA0/40/320/620/130/530/450/119 Event Confidence that at least 98% of the Floor is “Clean” Based on Probabilistic Samples Alone Based on Hybrid Strategy ORI91.5%95% Test 292.5%95% Test 393%96.5% Test 492.5%96% Test 592.5%97%

17
Results – RV PCR

18
Results Wipe sampling is statistically more effective than vacuum or swab No statistical difference in effectiveness of recovery between sampling strategies in characterization RV-PCR vs. culture may be affected by repeat testing Onsite testing provided rapid feedback to incident commander

19
Last-Minute RV-PCR Run

20
AAR AML successfully deployed/redeployed a tailored team of personnel and equipment Conducted ISO-9000 equivalent survey of operations Demonstrated laboratory contamination risk in operational situation Accurately tracked & reported 99.97% of ~3,000 samples

21
Review Reasons for INL-1 & 2 events Interagency operation 1 st & 9 th AML participation Processes Results

22
Acknowledgements MAJ Brian Walker & SFC Christian Lowry – 9 th AML Dr. Michael Walter – JPEO-CBD Dr. Robert Knowlton & Mr. Brad Melton – Sandia National Laboratory Ms. Molly Isbell – Signature Science

23
Questions???

Similar presentations
![Initial Planning Conference Initial Planning Conference [DATE]](/2/757798/big_thumb.jpg "Initial Planning Conference Initial Planning Conference [DATE]>")


![Initial Planning Conference [Date]](/15/4541470/big_thumb.jpg "Initial Planning Conference [Date]>")


