Download presentation
Presentation is loading. Please wait.

1
EXPERIMENTAL DESIGN Science answers questions with experiments

2
1 st ask a about your topic One that is testable with the materials at hand What is a good question for an experiment? DEFINE THE PROBLEM

3
Now we need a hypothesis to guide our investigation. What is a hypothesis? Your best thinking about how the change you make might affect another factor. Tentative or trial solution to the question. An if ………… then ………… statement.

4
Design an Experiment Must design an experiment that will test your hypothesis. Must design an experiment that will test your hypothesis. This experiment will allow you to change some conditions or variables to test your hypothesis. This experiment will allow you to change some conditions or variables to test your hypothesis.

5
The independent variable is the variable that is purposely changed. It is the manipulated variable. The dependent variable changes in response to the independent variable. It is the responding variable. Variables Variables are things that change.

6
Constants or Controlled Variables in an Experiment What are constants in an experiment? Factors that are kept the same and not allowed to change. It is important to control all but one variable at a time to be able to interpret data

7
Materials and Procedures A description of what you will use for your experiment, and how you will do it. Be sure to include: Listing of the Variables Repeated Trials Drawing of Apparatus

8
How will you vary the Independent Variable How many different values of the independent variable should we test? 3 ? 5? 10? The more the better?

9
Repeated Trials What are repeated trials? The number of times that a value of the independent variable is tested. Why are repeated trials necessary? They reduce the possibility of chance errors affecting the results.

10
Drawing of Experiment Include Labels to clearly identify the important parts of the experimental setup

11
Qualitative Observations and Results What are qualitative observations? They are what you perceive that occurred during the course of your experiment. They are identification of trends in the data.

12
Quantitative Observations and Results What are quantitative observations? Numbers in the form of raw data displayed in data tables and graphs

13
Sample Data Table Title: The Effect of the independent variable on the dependent variable Column for independent variable Column for dependent variable Column for derived quantity Label – with units if necessary Label – with units if necessary – multiple trials included Label – with units if necessary. Example = average of trials 1 2 3 1 2 3

14
Graphs Title: The Effect of the independent variable on the dependent variable Independent Variable – include units and an appropriate scale Dependent Variable – include units and an appropriate scale

15
Analysis and Interpretation of Results This is where you describe in words what is illustrated by your data as shown in your table and graph You also describe the meaning of the results

16
Possible Experimental Errors What factors in your materials or procedure might have had an impact on your results?

17
Conclusion Why or why not your results supported or did not support the hypothesis. Hypotheses are never “wrong”. They are either supported or not supported. Include reasons for the hypothesis to be supported or unsupported.

18
Recommendations for Further Experimentation What are some practical applications of your results? What other questions that could be tested arise from your results?

19
Sample experiment with data Students were asked to build a helicopter and test something. Students were asked to build a helicopter and test something.

20
Writing A Statement of the Problem for the Experiment It should state: “The Effect of the Independent Variable on the Dependent Variable”. A good statement of the problem for “The Helicopter would be The Effect of wing length on time of decent What should it state?

21
More about our variables: The independent variable is the variable that is purposely changed. It is the manipulated variable. The dependent variable changes in response to the independent variable. It is the responding variable. What is the “Helicopter” independent variable? length of one wing as measured in centimeters What is the dependent variable? time of descent as measured in seconds

22
Title for the Helicopter Experiment The Effect of Wing Length on the Length of Time the Helicopter Takes to Reach the Ground

23
Another Look at Our Hypothesis INDEPENDENT VARIABLE If the length of the wings are increased, DEPENDENT VARIABLE then time of descent will increase.

24
Constants in an Experiment Factors that are kept the same and not allowed to change What should be kept constant in the“Helicopter”? CONSTANTS Same structure of helicopters Same dropping technique Same dropping height

25
Values of the Independent Variable How many different values of the independent variable should we test? Enough to clearly illustrate a trend in the data - 5cm, 6cm, 7cm, 8cm…..

26
Repeated Trials How many repeated trials are needed in the “Helicopter”? At least 3, then calculate an average value for each level of the independent variable

27
Drawing of Experiment Hold helicopter in the middle Drop from same spot each time

28
Qualitative Observations and Results As we dropped the helicopter, we observed that sometimes they seemed to be affected by air currents. It appeared that helicopters with longer wingspans took a greater time to reach the ground

29
Quantitative Observations Data Table, Graph and Statistics

30
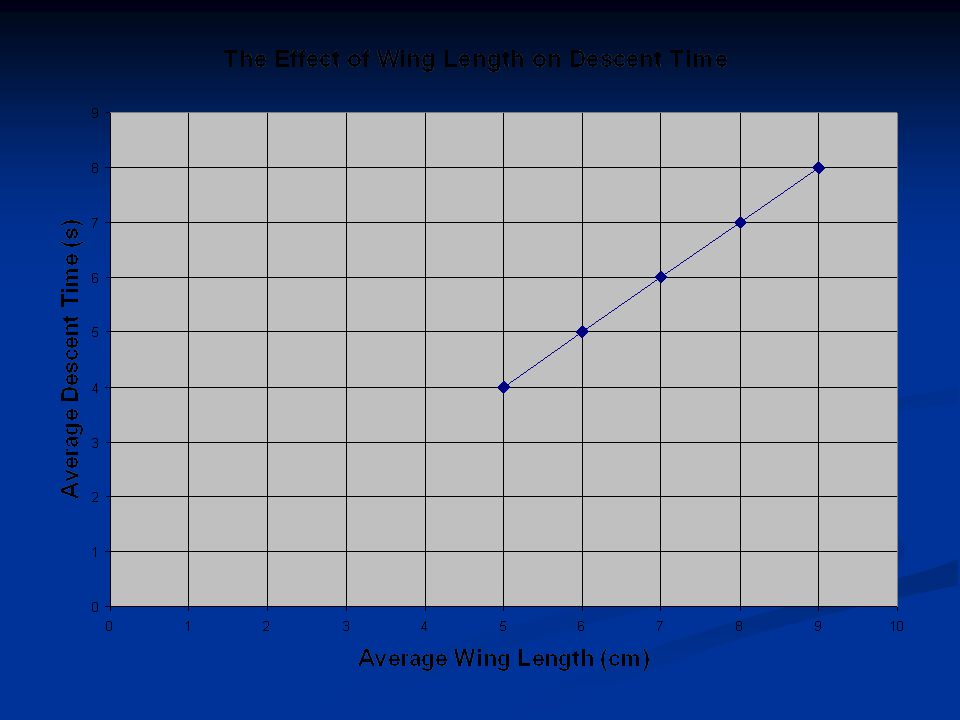
Sample Data Table Title: The Effect of wing length on the time of descent Wing Length (cm) Average Descent Time (s) Descent Time (s) Trials 1 2 3 5678956789 3 5 4 4 4 5 6 5 6 7 5 6 7 8 6 7 9 7 8 8
 Average Descent Time (s) Descent Time (s) Trials")
32
Analysis and Interpretation of Results While individual trial results showed some variation; overall, as average wing length increased from 5 through 9 centimeters, average time of descent also increased from 4 through 8 seconds. This shows a direct correlation.

33
Possible Experimental Errors Although the average results supported the hypothesis, the individual trial results showed some variation. Some possible reasons for this could be due to air currents in the room or reaction time differences between the timer and the helicopter dropper.

34
Conclusion The overall results supported the hypothesis. A possible reason for this could be due to increased surface area of the wing in contact with the air - allowing for greater air support.

35
Recommendations for Further Experimentation/ Practical Applications Increased time of descent due to greater wing length suggests that increased wing length could lead to greater fuel efficiency of an actual helicopter. Other experiments investigating factors that would contribute to greater descent time might include: making modifications in the shape of the wings, changing the number of wing blades, and making folds in the wing blades

36
What kind of question would you ask? Materials provided: sugar, stir sticks, access to warm and cold water and ice, thermometers, beakers, object that floats partially submerged in water, graph paper, jumbo paper clip, straws, rulers, protractor Materials provided: sugar, stir sticks, access to warm and cold water and ice, thermometers, beakers, object that floats partially submerged in water, graph paper, jumbo paper clip, straws, rulers, protractor Come up with a question related to solutions Come up with a question related to solutions

37
Possible Questions effects of temperature on solubility effects of temperature on solubility effects of concentration on depth object sinks in solution effects of concentration on depth object sinks in solution effects of stirring on solubility effects of stirring on solubility effects of concentration on height of solution rising in straw effects of concentration on height of solution rising in straw effect of amount of sugar dissolved on temperature of solution effect of amount of sugar dissolved on temperature of solution effect of temperature on how long a set amount of sugar required to dissolve effect of temperature on how long a set amount of sugar required to dissolve

38
Possible Hypotheses If we raise the temperature then the solubility will ??? If we raise the temperature then the solubility will ??? If we increase the sugar concentration then the height of solution rising in the straw will ??? If we increase the sugar concentration then the height of solution rising in the straw will ??? If we dissolve more sugar in the solution then the temperature will ??? If we dissolve more sugar in the solution then the temperature will ???

Similar presentations
 in any IB science course is based upon two kinds of assessments.>")


>")


 Begin by asking questions about your topic: Why? How.>")


 Mr. Fischer’s Science Class Period __>")