Download presentation
Presentation is loading. Please wait.

1
Florida Assessments for Instruction in Reading (FAIR) : An Overview and Application within a Response to Intervention (RTI) Model Liz Crawford, MS, CCC-SLP Director of Interventions November 12, 2009 IDA – Orlando, FL
 : An Overview and Application within a Response to Intervention (RTI) Model Liz Crawford, MS, CCC-SLP Director of Interventions November 12, 2009 IDA – Orlando, FL")
2
Agenda Overview of FAIR K-2 3-12 Progress Monitoring & Reporting Network (PMRN) Reports Common Profiles/Patterns in Data Connecting to Instruction Response to Instruction/Intervention (RTI) Model RTI and Special Education Identification RTI in Florida RTI and FAIR
 Reports Common Profiles/Patterns in Data Connecting to Instruction Response to Instruction/Intervention (RTI) Model RTI and Special Education Identification RTI in Florida RTI and FAIR")
3
Why New Reading Assessments? Primary-grade assessment improved to include: 1. PreK; 2. Vocabulary; 3. Comprehension Assesses standards in K-12; monitors progress Results predict end of year performance on standardized test (K-2) & Florida’s Comprehensive Assessment Test (FCAT) Diagnostic inventories are linked to Florida standards and provide information for guiding instruction Reading comprehension & oral reading fluency passages are equated for difficulty to allow for accurate progress monitoring and comparison of student performance from one passage to another Comprehension assessed in instructional level passages
 & Florida’s Comprehensive Assessment Test (FCAT) Diagnostic inventories are linked to Florida standards and provide information for guiding instruction Reading comprehension & oral reading fluency passages are equated for difficulty to allow for accurate progress monitoring and comparison of student performance from one passage to another Comprehension assessed in instructional level passages.")
4
K-2: phonemic awareness, letter knowledge, decoding, encoding, fluency, vocabulary, listening or reading comprehension 3-12: adaptive, complex & low level reading comprehension, fluency, word analysis, skill assessment Florida Assessments for Instruction in Reading: (Teacher Administered)
")
5
Comprehensive Assessment System 1. Phonemic Awareness 2. Phonics 3. Fluency 4. Vocabulary 5. Text Comprehension 6. Orthographic Skills (Spelling) K-23-12 * * embedded in text comprehension
 K * * embedded in text comprehension.")
6
K-2 Assessments

7
The K-2 “Big Picture” Map Broad Screen/Progress Monitoring Tool (BS/PMT) “All” students Letter Naming & Sounds Phonemic Awareness Word Reading Broad Diagnostic Inventory (BDI) “All” students “Some” students for vocabulary Listening Comprehension Reading Comprehension Vocabulary Spelling (2 nd grade only) Targeted Diagnostic Inventory (TDI) “Some” students K = 9 tasks 1 st = 8 tasks 2 nd = 6 tasks Ongoing Progress Monitoring (OPM) “Some” students K – 2 = TDI tasks 1 – 2 = ORF 7
 All students Letter Naming & Sounds Phonemic Awareness Word Reading Broad Diagnostic Inventory (BDI) All students Some students for vocabulary Listening Comprehension Reading Comprehension Vocabulary Spelling (2 nd grade only) Targeted Diagnostic Inventory (TDI) Some students K = 9 tasks 1 st = 8 tasks 2 nd = 6 tasks Ongoing Progress Monitoring (OPM) Some students K – 2 = TDI tasks 1 – 2 = ORF 7")
8
The K-2 Broad Screen/Progress Monitoring Map

9
K-2 Broad Diagnostic Inventory (BDI) Map Kindergarten AP 1 = Listening Comprehension (LC) and Vocabulary (VOC) AP 2 = Listening Comprehension AP 3 = Listening Comprehension or Reading Comprehension (RC) and Vocabulary First Grade AP 1 = Reading Comprehension or Listening Comprehension and Vocabulary AP 2 = Reading Comprehension AP 3 = Reading Comprehension and Vocabulary Second Grade AP 1 = Reading Comprehension, Vocabulary, and Spelling (SPL) AP 2 = Reading Comprehension and Spelling AP 3 = Reading Comprehension, Vocabulary, and Spelling
 Map Kindergarten AP 1 = Listening Comprehension (LC) and Vocabulary (VOC) AP 2 = Listening Comprehension AP 3 = Listening Comprehension or Reading Comprehension (RC) and Vocabulary First Grade AP 1 = Reading Comprehension or Listening Comprehension and Vocabulary AP 2 = Reading Comprehension AP 3 = Reading Comprehension and Vocabulary Second Grade AP 1 = Reading Comprehension, Vocabulary, and Spelling (SPL) AP 2 = Reading Comprehension and Spelling AP 3 = Reading Comprehension, Vocabulary, and Spelling")
10
K-2 Targeted Diagnostic Inventory (TDI) Map Kindergarten Print Awareness Letter name and sound knowledge Phoneme Blending Phoneme Deletion Word Parts/Initial Letter Sound Connection Initial Letter Sound Connection Final Word Building –Initial Consonants Word Building –Final Consonants Word Building –Medial Vowels First Grade Letter Sound Knowledge Phoneme Blending Phoneme Deletion Initial Phoneme Deletion Final Word Building –Consonants Word Building –Vowels Word Building –CVC /CVCe Word Building –Blends Second Grade Phoneme Deletion Initial Phoneme Deletion Final Word Building –Consonants Word Building –CVC /CVCe Word Building –Blends & Vowels Multisyllabic Word Reading
 Map Kindergarten Print Awareness Letter name and sound knowledge Phoneme Blending Phoneme Deletion Word Parts/Initial Letter Sound Connection Initial Letter Sound Connection Final Word Building –Initial Consonants Word Building –Final Consonants Word Building –Medial Vowels First Grade Letter Sound Knowledge Phoneme Blending Phoneme Deletion Initial Phoneme Deletion Final Word Building –Consonants Word Building –Vowels Word Building –CVC /CVCe Word Building –Blends Second Grade Phoneme Deletion Initial Phoneme Deletion Final Word Building –Consonants Word Building –CVC /CVCe Word Building –Blends & Vowels Multisyllabic Word Reading")
11
Targeted Diagnostic Task Example Word Building Tasks are given at each grade level. Grade 1 Vowels. Student moves letters to make new words like dig, dug, pug, pig, and pit. Practice and Task Items u p t a e i dog

12
The K – 2 “Score” Map BS/PMTPRS = Probability of Reading Success BDI LC = Listening Comprehension Total questions correct (implicit/explicit) RC = Reading Comprehension Total questions correct (implicit/explicit), Fluency, Percent Accuracy Target Passage VOC = Vocabulary Percentile Rank SPL = Spelling Percentile Rank TDI ME = Meets Expectations BE = Below Expectations OPM ORF = Adjusted Fluency OPM TDI Tasks = ME or BE and Raw Score 12
 RC = Reading Comprehension Total questions correct (implicit/explicit), Fluency, Percent Accuracy Target Passage VOC = Vocabulary Percentile Rank SPL = Spelling Percentile Rank TDI ME = Meets Expectations BE = Below Expectations OPM ORF = Adjusted Fluency OPM TDI Tasks = ME or BE and Raw Score 12")
13
Probability Score – Probability of Reading Success (PRS) Score calculated based on the BS/PMT Probability is…the relative possibility that an event will occur or is likely to occur. A.70 means that we expect this student to have a 70% chance of scoring at or above the 40th percentile at the end of the year on the SESAT or SAT-10. 13

14
Success Zones - Probability Scores GREEN 85% or better chance of scoring at or above the 40th percentile at the end of the year on the SESAT or SAT-10 16-84% chance of scoring at or above the 40th percentile at the end of the year on the SESAT or SAT-10 15% or less chance of scoring at or above the 40th percentile at the end of the year on the SESAT or SAT-10 14 YELLOW RED

15
3-12 Assessments

16
Why use a computer adaptive test? What are the benefits? A computer adaptive test (CAT) provides a more reliable assessment of student ability in a shorter amount of time than a traditional test, because it picks questions at a level of difficulty that are most informative for each student. Computer adaptive tests provide more reliable assessments particularly for students at the extremes of ability (extremely low ability or extremely high ability).
 provides a more reliable assessment of student ability in a shorter amount of time than a traditional test, because it picks questions at a level of difficulty that are most informative for each student. Computer adaptive tests provide more reliable assessments particularly for students at the extremes of ability (extremely low ability or extremely high ability)..")
17
17 The 3-12 “Big Picture” Map Type of AssessmentName of Assessment Broad Screen/Progress Monitoring Tool (BS/PMT) – Appropriate for ‘All’ students Reading Comprehension (RC) Targeted Diagnostic Inventory (TDI) – “Some” students Maze Word Analysis (WA) Ongoing Progress Monitoring (OPM) – “Some” students Maze ORF RC Informal Diagnostic Toolkit (Toolkit) – “Some” students Phonics Inventory Academic Word Inventory Lexile Passages Scaffolded Discussion Templates
 – Appropriate for ‘All’ students Reading Comprehension (RC) Targeted Diagnostic Inventory (TDI) – Some students Maze Word Analysis (WA) Ongoing Progress Monitoring (OPM) – Some students Maze ORF RC Informal Diagnostic Toolkit (Toolkit) – Some students Phonics Inventory Academic Word Inventory Lexile Passages Scaffolded Discussion Templates")
18
18 The 3-12 “Big Picture” Map Type of AssessmentName of Assessment Broad Screen/Progress Monitoring Tool (BS/PMT) 3 times a year On the computer Entered into PMRN Targeted Diagnostic Inventory (TDI) 3 times a year On the computer Entered into PMRN Ongoing Progress Monitoring (OPM) Maze and RC – on computer, up to 7 times a year, entered into PMRN ORF – paper and pencil, up to 7 times a year, entered into PMRN Informal Diagnostic Toolkit (Toolkit) Paper and Pencil only Not entered into PMRN No restrictions on when to administer
 3 times a year On the computer Entered into PMRN Targeted Diagnostic Inventory (TDI) 3 times a year On the computer Entered into PMRN Ongoing Progress Monitoring (OPM) Maze and RC – on computer, up to 7 times a year, entered into PMRN ORF – paper and pencil, up to 7 times a year, entered into PMRN Informal Diagnostic Toolkit (Toolkit) Paper and Pencil only Not entered into PMRN No restrictions on when to administer")
19
Broad Screen/Progress Monitoring Tool Reading Comprehension Task ( 3 Times a Year ) Targeted Diagnostic Inventory Maze & Word Analysis Tasks Diagnostic Toolkit ( As Needed ) Ongoing Progress Monitoring ( As Needed ) If necessary Grades 3-12 Assessments Model
 Targeted Diagnostic Inventory Maze & Word Analysis Tasks Diagnostic Toolkit ( As Needed ) Ongoing Progress Monitoring ( As Needed ) If necessary Grades 3-12 Assessments Model")
20
Purpose of Each 3-12 Assessment RC Screen Helps us identify students who may not be able to meet the grade level literacy standards at the end of the year as assessed by the FCAT without additional targeted literacy instruction. Mazes Helps us determine whether a student has more fundamental problems in the area of text reading efficiency and low level reading comprehension. Word Analysis Helps us learn more about a student's fundamental literacy skills--particularly those required to decode unfamiliar words and read accurately.

21
3-12 Targeted Diagnostic Inventory (TDI) Map
 Map")
22
The Broad Screen/Progress Monitoring Tool: The RC Task 10-30 minute computer-adaptive task of reading comprehension A student receives a minimum of one passage and a maximum of three passages Predicts student’s FCAT success probability (FSP) Administered to all students scoring Level 1 or 2 on FCAT Administered to 3 rd grade students identified with a reading deficiency by their districts Other students may take the assessment at the discretion of their districts
 Administered to all students scoring Level 1 or 2 on FCAT Administered to 3 rd grade students identified with a reading deficiency by their districts Other students may take the assessment at the discretion of their districts")
26
TDI: The Maze Task Two 3-minute (grade-level) passages Administered 3 times a year Student responds to embedded cloze items within text Assesses text reading efficiency (i.e., reading accuracy and speed, and gist - level comprehension)
 passages Administered 3 times a year Student responds to embedded cloze items within text Assesses text reading efficiency (i.e., reading accuracy and speed, and gist - level comprehension)")
30
TDI: The Word Analysis Task A 5-15 minute computer-adaptive spelling task that assesses a student’s understanding of letter/sound correspondence A student receives a minimum of 5 words and a maximum of 30 words Results indicate whether probability of success in reading is hampered by difficulties with word-level skills.

33
33 The 3-12 “Score” Map Reading Comprehension - BS/PMT FCAT Success Probability (FSP) Color- coded Percentile Standard Score Lexile Ability Score and Ability Range FCAT Cluster Area Scores Maze - TDI Percentile Standard Score Adjusted Maze Score Word Analysis - TDI Percentile Standard Score Ability Score (WAAS) OPM RC – Ability Score, Ability Range, Cluster Scores Maze – Adjusted Maze Score ORF (3 rd – 5 th ) Adjusted Fluency Score
 Color- coded Percentile Standard Score Lexile Ability Score and Ability Range FCAT Cluster Area Scores Maze - TDI Percentile Standard Score Adjusted Maze Score Word Analysis - TDI Percentile Standard Score Ability Score (WAAS) OPM RC – Ability Score, Ability Range, Cluster Scores Maze – Adjusted Maze Score ORF (3 rd – 5 th ) Adjusted Fluency Score")
34
Ongoing Progress Monitoring (OPM)
")
35
K-2 All of the TDI tasks are available as OPM probes ORF in grades 1 and 2 3-12 ORF at grades 3-5 MAZE at grades 3-12 RC at grades 3-12 Informal toolkit with: Scaffolded Discussion Templates Lexile ® Passages Phonics Inventory Academic Word Inventory

36
The purpose of frequent progress monitoring Progress monitoring during the year is used to determine whether or not students are responding adequately to their current instructional environment. If their growth within their current environment is determined to be inadequate, they should experience an instructional change designed to increase their rate of progress. There are different types and purposes for progress monitoring, which call for a range in the frequency of administration (e.g., weekly, monthly).
..")
37
Issues involved in deciding on the frequency of progress monitoring Setting a reasonable interval for progress monitoring actually depends on three pieces of information about the reading assessment being used: 1. How much growth on a given outcome (i.e., oral reading fluency) can be reasonably expected during a given interval of time? 2. How reliably does the assessment measure the outcome of interest? 3. How closely are the different probes of the ability equated for difficulty?
 can be reasonably expected during a given interval of time. 2. How reliably does the assessment measure the outcome of interest. 3. How closely are the different probes of the ability equated for difficulty .")
38
General issues about the frequency and utility of different kinds of progress monitoring assessments Measures like oral reading fluency are referred to as “general outcome” curriculum based measures because they assess student proficiency on a general outcome of interest. They have the advantage of being able to determine growth rates for individual students that can be compared against a desirable standard of growth over time. Thus, they can indicate whether or not an intervention is sufficiently powerful to “close the gap” on the outcome measure over a reasonable period of time. Although they provide information about the necessity for a change in a student’s instructional environment, they do not necessarily provide information about how the program should be changed in order to increase student performance.

39
General issues about the frequency and utility of different kinds of progress monitoring assessments Information that can be used to suggest ways that instruction should be changed is more likely to be provided by assessments that are very closely tied to the specific curriculum that is being used to guide instruction. This type of assessment, frequently referred to as “classroom- based formative assessment”, should be given very frequently to assess whether the student is learning what is being taught. Although this type of assessment has immediate value for making day-to-day adjustments to instruction, it has less value as a measure of general progress in learning to read, since it represents such a small part of the overall reading process.

40
Examples of “general outcome” curriculum based measures Oral Reading Fluency (ORF) OPM Maze Task OPM Reading Comprehension OPM TDI Tasks – OPM* *These tasks form a developmental continuum where 80% mastery is expected. Thus, these are similar to what many teachers might use for classroom-based formative assessment.

41
Examples of “classroom-based formative assessment” Unit Tests Weekly Quizzes Writing Samples Informal Inventories

42
In summary… General outcome measures should not be given more frequently than is necessary to establish a reliable estimate of growth. Giving them more frequently than that takes time away from instruction unnecessarily. In contrast, teachers should be constantly (hourly, daily, weekly) acquiring formative assessment data about their student’s progress in mastering their specific lesson objectives.
 acquiring formative assessment data about their student’s progress in mastering their specific lesson objectives..")
43
References for OPM Jenkins, J. R., Graff, J. J., & Miglioretti, D. L. (2009). Estimating reading growth using intermittent CBM progress monitoring. Exceptional Children, 75, 151-163. Use of ongoing progress monitoring to improve reading instruction. (2009). A guidance document prepared by the Florida Center for Reading Research (FCRR). Torgesen, J. K., & Miller, D. H. (2009). Assessments to guide adolescent literacy instruction. Portsmouth, NH: RMC Research Corporation, Center on Instruction.
. Estimating reading growth using intermittent CBM progress monitoring. Exceptional Children, 75, Use of ongoing progress monitoring to improve reading instruction. (2009). A guidance document prepared by the Florida Center for Reading Research (FCRR). Torgesen, J. K., & Miller, D. H. (2009). Assessments to guide adolescent literacy instruction. Portsmouth, NH: RMC Research Corporation, Center on Instruction..")
44
PMRN Reports K-2 and 3-12

45
What is an AHM? The Active Header Menu (AHM) is found at the top of most reports. It allows the User to navigate between reports and filter the data that is displayed. In the report below, it is AP3 and the teacher is filtering her second grade class so that the report only displays those students who have been in her class all year. It also provides links to legends that help explain the report and a link for “printer friendly” version of the report.

46
School Status Report (K-2)
")
47
Target Passages for Grades 1 and 2 – BDI - Reading Comprehension ©2009 Florida Center for Reading Research

48
School Status Report (3-12)
")
49
School Progress Report (K-2 example) Bar Graph View of Data
 Bar Graph View of Data")
50
School Progress Report (K-2 example) Tabular View of Data
 Tabular View of Data")
51
School Grade Summary Report (K-2)
")
52
School Grade Summary Report (K- 2), - continued
, - continued")
53
School Grade Summary Report (K-2)
")
54
School Grade Summary Report (3-12)
")
55
School Grade Summary Report (3-12)- continued
- continued")
56
School Grade Summary Report (3-12)
")
57
School Demographic Report (K-2 example)
")
58
School PRS Distribution Graph by Ethnicity (K-2 example)
")
59
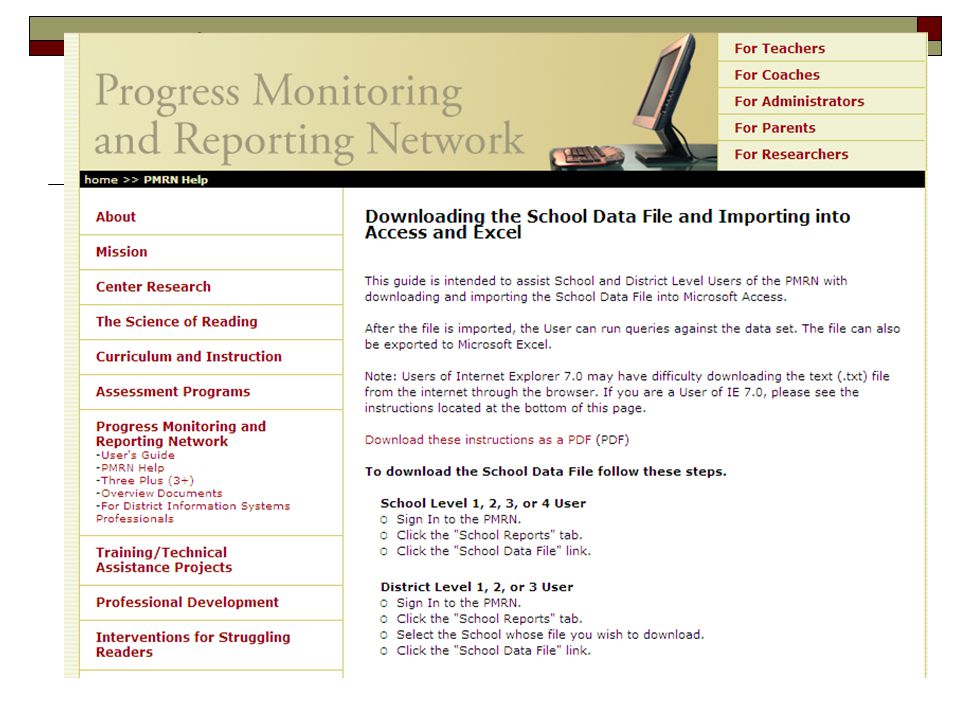
District and School Data File The data file allows all of the data to be downloaded so that Users can complete their own analyses. If the PMRN does not have a report comparing the groups of interest, then the data file allows a school or district to download the data for analysis using other systems such as Excel or SPSS. The file can be downloaded at the district or school level. The file is a text file. Each school has its own file and it can be downloaded by the SL1, SL2, SL3, and SL4 Users at the school (up to 7 people at the school have access). The process for accessing the file is described at http://www.fcrr.org/pmrn/download2access_excel.htm. http://www.fcrr.org/pmrn/download2access_excel.htm
. The process for accessing the file is described at")
61
Student Ongoing Progress Monitoring (OPM) ORF Report Grades 1-5 ©2009 Florida Center for Reading Research
 ORF Report Grades 1-5 ©2009 Florida Center for Reading Research")
62
62 Instructional Changes-Pop up

63
Class Status Reports and Student Score Detail Boxes K – 2 and 3 – 12

64
Class Status Report (K-2)- ©2009 Florida Center for Reading Research
- ©2009 Florida Center for Reading Research")
65
Student Score Detail Box (K-2)- ©2009 Florida Center for Reading Research
- ©2009 Florida Center for Reading Research")
66
Class Status Report- (3-12)
")
67
Student Score Detail Box- (3-12)
")
68
Some Common Profiles or Patterns in Data

69
K-2 Class Status Report Worksheet – data analysis questions

70
How is comprehension impacted?

71
Assessment/Curriculum Decision Tree for Reading Improvement for the Florida Assessments for Instruction in Reading

72
72 Common Profiles/Patterns of Performance

73
73 Common Profiles/Patterns of Performance Box 1 Box 2 + 4 Box 2 + 5 Box 3 + 4 Box 3 + 5

74
74 Steps to the Activity Sort your students according to the profiles presented and write their names down on the worksheet under the appropriate profile. After your students are sorted into profiles, answer the following questions: What profiles most frequently occurred in your student data? For which profiles do you have resources currently in place? In which areas do you need more professional development/support/resources to meet student needs? Based upon the frequency of various profiles of student needs, will you address these through adjustment of Tier I, Tier II, or Tier III?

75
75 Assessment/Curriculum Decision Tree for Reading Improvement Grades 3-12 for the Florida Assessments for Instruction in Reading Worksheet - Handout 8 ©2009 Florida Department of Education

76
Connecting Assessment to Instruction Links to Instructional Resources

77
77 Linking to Resources through PMRN Teachers will have the option of clicking on column headers for: K-2 RC, LC, Vocabulary, Spelling, and TDI Tasks 3-12 RC, Maze, WA These links will take them to a search page which will in turn bring them to a list of resources designed to assist instruction in the chosen area. Resources include K-2: Empowering Teacher Routines and Student Center Activities 3-5: Empowering Teacher Routines and Student Center Activities K-12: LEaRN videos and other LEaRN resources You can also get to some of these same resources through a search tool located on FCRR home page (www.fcrr.org)

78
Search Tool for FCRR resources For Student Center Activities (SCAs) for K-5 and for Empowering Teachers (ET) Routines K-3 There are two search tools: one links to FAIR and one links to DIBELS Searchable by grade level and then 5 components and then skills SSS and then enter standard number DIBELS subtest or FAIR The skills on the class status report worksheet match up with the skills on the search tools under each component of reading instruction! 78

79
Parent Letters You may access the Parent Letters in the PMRN in two different ways: From the Class Status Report click on the link at the bottom of the page that says Print all Parent Letters – this will print letters for the whole class Users can get to the Parent Letters under the Student Reports tab – this will allow the teacher to print only letters for specific students. 79

84
Response to Instruction/Intervention

85
What is RtI? (NRCLD) National Research Center on Learning Disabilities “ RTI is an assessment and intervention process for systematically monitoring student progress and making decisions about the need for instructional modifications or increasingly intensified services using progress monitoring data.” pg. i.2
 National Research Center on Learning Disabilities RTI is an assessment and intervention process for systematically monitoring student progress and making decisions about the need for instructional modifications or increasingly intensified services using progress monitoring data. pg. i.2.")
86
What is RtI? (NASDSE) National Association of State Directors of Special Education RtI is the practice of (1) providing high-quality instruction/intervention matched to student needs (2) using learning rate over time and level of performance to (3) make important educational decisions.
 National Association of State Directors of Special Education RtI is the practice of (1) providing high-quality instruction/intervention matched to student needs (2) using learning rate over time and level of performance to (3) make important educational decisions..")
87
Essential Components Implementation (NASDSE) Multi-tier model of instruction Problem solving method An integrated data collection/assessment system
 Multi-tier model of instruction Problem solving method An integrated data collection/assessment system")
88
Components 1 & 2: Tiered Model of School Supports & the Problem-Solving Process ACADEMIC and BEHAVIOR SYSTEMS Tier 3: Intensive, Individualized, Interventions. Individual or small group intervention. Tier 2: Targeted, Supplemental Interventions & Supports. More targeted interventions and supplemental support in addition to the core curriculum and school-wide positive behavior program. Tier 1: Core, Universal Instruction & Supports. General instruction and support provided to all students in all settings.

89
Essential Component 3: Integrated Assessment Systems (NASDSE) Directly assess specific skills in standards Assess “marker variables” [demonstrated to lead to the ultimate instructional target, (e.g., reading comprehension)] Sensitive to small amounts of growth Brief Repeatable Easy to use Direct relationship to instructional decision- making
![Essential Component 3: Integrated Assessment Systems (NASDSE) Directly assess specific skills in standards Assess marker variables [demonstrated to lead to the ultimate instructional target, (e.g., reading comprehension)] Sensitive to small amounts of growth Brief Repeatable Easy to use Direct relationship to instructional decision- making](http://images.slideplayer.com/12/3543484/slides/slide_89.jpg "Essential Component 3: Integrated Assessment Systems (NASDSE) Directly assess specific skills in standards Assess marker variables [demonstrated to lead to the ultimate instructional target, (e.g., reading comprehension)] Sensitive to small amounts of growth Brief Repeatable Easy to use Direct relationship to instructional decision- making")
90
RtI and Special Education Identification

91
Sec. 614 (b) (6) Specific Learning Disabilities (A) IN GENERAL “… a local educational agency shall not be required to take into consideration whether a child has a severe discrepancy…”
 (6) Specific Learning Disabilities (A) IN GENERAL … a local educational agency shall not be required to take into consideration whether a child has a severe discrepancy… .")
92
Sec. 614 (6) Specific Learning Disabilities (B) ADDITIONAL AUTHORITY “…a local educational agency may use a process that determines if the child responds to scientific, research-based intervention as a part of the evaluation procedure…” Process refers to “Problem Solving Process” Responds refers to “Response to Intervention”
 Specific Learning Disabilities (B) ADDITIONAL AUTHORITY …a local educational agency may use a process that determines if the child responds to scientific, research-based intervention as a part of the evaluation procedure… Process refers to Problem Solving Process Responds refers to Response to Intervention .")
93
Problems with the traditional system “Wait-to-fail model” (Vaughn and Fuchs 2003; NASDSE) Late identification for students in need Imprecise screening through teacher observation False negatives (unidentified students) who don’t get the services they need Identification measures that are not linked to instruction Separation of general and special education Over representation of some minority groups Undocumented benefits
 Late identification for students in need Imprecise screening through teacher observation False negatives (unidentified students) who don’t get the services they need Identification measures that are not linked to instruction Separation of general and special education Over representation of some minority groups Undocumented benefits")
94
Special Education Eligibility Comparison of historical system to RtI system See NASDSE documents See Vaughn and Fuchs article, 2003 It is not about getting them in, it is about getting them the help they need. (“If I could just get my child into special education everything would be fine.” – a parent)
.")
95
Specific Learning Disabilities (SLD) Rule in Florida
 Rule in Florida")
96
Rule Implementation Synopsis Status Adopted by SBE on January 21, 2009 Effective as of March 23, 2009 Implementation SP&P identifies applicable process school-by-school A. RtI Process within Comprehensive Evaluation OR B. RtI Process and relevant pattern of strengths and weaknesses within Comprehensive Evaluation Effective July 1, 2010, schools can no longer require pattern of strengths and weaknesses as allowed in option B 96

97
Florida SLD Criteria for Eligibility (until July 1, 2010) Underachievement in: Oral expression Listening comprehension Written expression Basic reading skills Reading fluency skills Reading comprehension Mathematics Calculation Mathematics problem-solving RtI & Pattern of Strengths/Weaknesses: RtI & pattern of strengths and weaknesses relevant to identifying SLD RtI & Pattern of Strengths/Weaknesses: RtI & pattern of strengths and weaknesses relevant to identifying SLD Conditions 1 and 2 not primarily the result of: Visual, hearing or motor disability Intellectual disability Emotional/Behavioral disability Cultural factors Irregular attendance Environmental or economic disadvantage Classroom behavior Limited English proficiency Condition 1Condition 2Condition 3 ++ RtI: Insufficient response to scientific, research-based intervention RtI: Insufficient response to scientific, research-based intervention or
 Underachievement in: Oral expression Listening comprehension Written expression Basic reading skills Reading fluency skills Reading comprehension Mathematics Calculation Mathematics problem-solving RtI & Pattern of Strengths/Weaknesses: RtI & pattern of strengths and weaknesses relevant to identifying SLD RtI & Pattern of Strengths/Weaknesses: RtI & pattern of strengths and weaknesses relevant to identifying SLD Conditions 1 and 2 not primarily the result of: Visual, hearing or motor disability Intellectual disability Emotional/Behavioral disability Cultural factors Irregular attendance Environmental or economic disadvantage Classroom behavior Limited English proficiency Condition 1Condition 2Condition 3 ++ RtI: Insufficient response to scientific, research-based intervention RtI: Insufficient response to scientific, research-based intervention or")
98
Florida SLD Criteria for Eligibility (after July 10, 2010) Underachievement in: Oral expression Listening comprehension Written expression Basic reading skills Reading fluency skills Reading comprehension Mathematics Calculation Mathematics problem-solving RTI: Insufficient response to scientific, research-based intervention RTI: Insufficient response to scientific, research-based intervention Conditions 1 and 2 not primarily the result of: Visual, hearing or motor disability Intellectual disability Emotional/Behavioral disability Cultural factors Irregular attendance Environmental or economic disadvantage Classroom behavior Limited English proficiency Condition 1Condition 2Condition 3 ++
 Underachievement in: Oral expression Listening comprehension Written expression Basic reading skills Reading fluency skills Reading comprehension Mathematics Calculation Mathematics problem-solving RTI: Insufficient response to scientific, research-based intervention RTI: Insufficient response to scientific, research-based intervention Conditions 1 and 2 not primarily the result of: Visual, hearing or motor disability Intellectual disability Emotional/Behavioral disability Cultural factors Irregular attendance Environmental or economic disadvantage Classroom behavior Limited English proficiency Condition 1Condition 2Condition 3 ++")
99
Collection of Current Technical Assistance 99 NEW SLD Web link on the BEESS Web site featuring related rules, technical assistance, documents, and Web sites: http://www.fldoe.org/ese/sldr.asp

100
What does RtI look like in Florida? www.florida-rti.org

108
FAIR and RTI

109
109 RtI and K-2 Florida Assessments for Instruction in Reading (FAIR) Broad Screen/Progress Monitoring Tool (BS/PMT) “All” students Tier 1 Broad Diagnostic Inventory (BDI) “All” students “Some” students for vocabulary Tier 1 and 2 Sometimes Tier 3 Targeted Diagnostic Inventory (TDI) “Some” students Tier 2 and 3 Ongoing Progress Monitoring (OPM) “Some” students Tier 2 and 3 109
 Broad Screen/Progress Monitoring Tool (BS/PMT) All students Tier 1 Broad Diagnostic Inventory (BDI) All students Some students for vocabulary Tier 1 and 2 Sometimes Tier 3 Targeted Diagnostic Inventory (TDI) Some students Tier 2 and 3 Ongoing Progress Monitoring (OPM) Some students Tier 2 and 3 109")
110
Guiding Questions for Determining Target Skill(s) How well is core instruction meeting the needs of our students in the areas of: Phonemic awareness? Phonics/Word Analysis? Word Reading? Reading connected text accurately? Vocabulary? Comprehension?

111
School Status Report (K-2)
")
112
112 RtI and 3-12 Florida Assessments for Instruction in Reading (FAIR) Broad Screen/Progress Monitoring Tool (BS/PMT) – Appropriate for ‘All’ students Tier 1 Targeted Diagnostic Inventory (TDI) – “Some” students Tier 2 and 3 Ongoing Progress Monitoring (OPM) - “Some” students Tier 1 – RC OPM Tier 2 and 3 Maze and ORF OPM Informal Diagnostic/Progress Assessment Toolkit “Some” students Tier 2 and 3
 Broad Screen/Progress Monitoring Tool (BS/PMT) – Appropriate for ‘All’ students Tier 1 Targeted Diagnostic Inventory (TDI) – Some students Tier 2 and 3 Ongoing Progress Monitoring (OPM) - Some students Tier 1 – RC OPM Tier 2 and 3 Maze and ORF OPM Informal Diagnostic/Progress Assessment Toolkit Some students Tier 2 and 3")
113
School Status Report (3-12)
")
114
School Grade Summary Report (3-12)
")
115
School Grade Summary Report (3-12)- continued
- continued")
116
116 Common Profiles/Patterns of Performance

117
Questions??

Similar presentations


 Progress Monitoring Interventions Tiers Training/Materials Problem Solving Model Allocation of Resources.>")


 in Primary Grades>")

>")


 Secondary Model for Intervention This ppt is an adaptation of a specific PISD Training on RTI, The Educational Testing and.>")


: The assessment tools you used. What you learned.>")

