Download presentation
Presentation is loading. Please wait.

1
Screen-Film and Digital Mammography Bob Pizzutiello, MS, FAAPM, FACMP Upstate Medical Physics for our patients…The Image Still Matters!

2
Handouts at http://www.upstatemp.com/

4
Physician Technologist Medical Physicist The Team Approach

5
Which image would you prefer?

6
Outline Contrast Blur Noise Artifacts Dose Image Characteristics SFM - FFDM To optimize Image Quality and Radiation Dose CNR - SNR Technical Tips SFM = Screen-film Mammography FFDM = Full Field Digital Mammography

7
Screen-film Mammography Film is used for image Acquisition Display Storage Digital Mammography Separate devices used for Acquisition Display Storage

8
Image Characteristics Contrast Blur Noise Artifacts Dose

9
Contrast

10
A - Black Background B - Dense Glandular Tissue C - Fatty tissue

11
Higher ContrastLower Contrast

12
Radiographic Contrast Difference in OD between areas of interest on the mammogram Determined by Subject Contrast and Film Contrast

13
Log E Optical Density X-ray exposure incident on the screen is converted into shades of gray (film) Areas that receive the Maximum radiation exposure turn film black Areas that receive the Minimum radiation exposure makes film clear (appears white) Black background Dense Fatty
 Areas that receive the Maximum radiation exposure turn film black Areas that receive the Minimum radiation exposure makes film clear (appears white) Black background Dense Fatty")
14
Optical Density Log E

15
Subject Contrast Ratio of number of x-ray photons in the aerial image corresponding to different regions of the breast Log E Optical Density

16
Film Contrast Log E Optical Density Translates different amounts of screen light to different film Optical Density Slope of D-Log E curve

17
Film Contrast and Compression Images of thicker breasts have lower contrast Hence, compression improves contrast Compression also moves objects closer to the image receptor (less blur) Compression reduces dose, since less radiation is required to image a thinner breast Compression also improves imaging by improving separation of overlapping structures
 Compression reduces dose, since less radiation is required to image a thinner breast Compression also improves imaging by improving separation of overlapping structures")
18
70mm 40mm 10 mm lesion AC B D Film

19
Film Contrast and Latitude The Tradeoff Latitude: the range of film exposures for a readable image –Not too light –Not too dark

20
Log E Optical Density Range of acceptable exposure Range of acceptable optical density

21
Film Contrast and Latitude The Tradeoff High Film Contrast inherently means Low Latitude SF imaging is limited by these characteristics of the film

22
Average Density Gamma Plot Log E D Log E

23
Contrast in FFDM Display contrast can be adjusted as high as desirable. Small Window Width (WW) = large display contrast Image display can be adjusted multiple times to view different areas of the breast (e.g., fatty and dense regions) by adjusting the Window Level (WL) Since there is essentially no limit on display contrast, subject contrast is less important, so beam energy can be higher Shorter exposure times Lower AGD
 = large display contrast Image display can be adjusted multiple times to view different areas of the breast (e.g., fatty and dense regions) by adjusting the Window Level (WL) Since there is essentially no limit on display contrast, subject contrast is less important, so beam energy can be higher Shorter exposure times Lower AGD.")
24
SFM Contrast Summary Subject Contrast creates differences in x-ray absorption Film Contrast amplifies those differences Need adequate Radiographic Contrast to visualize abnormalities High Contrast means low latitude Darker (regions of) mammograms have better contrast - and conversely Compression improves contrast Challenge: balance film characteristics to produce a diagnostic quality image
 mammograms have better contrast - and conversely Compression improves contrast Challenge: balance film characteristics to produce a diagnostic quality image")
25
Image Blur

26
Contact imaging Motion –Exposure time –Compression Focal Spot –Size –Object Location A B Same for SFM and FFDM

27
A B A B Objects that are closer to the image receptor have less blur and are not magnified

28
Magnification Motion Exposure time Compression Increase kVp Focal Spot Size Object Location Compressed breast X-ray tube Film

29
a b c ed X-ray target Compression paddle Magnification Stand Film Blur region

30
Noise

31
Any undesired variation in image background Most commonly caused by insufficient number of x-ray photons used to create the image Noise limits visibility of low-contrast objects We could produce images with much lower radiation dose, but they would have more noise Same for SFM and FFDM, but since contrast is not an issue for FFDM, want more signal to detector

32
Low and High Noise Images

34
Artifacts Plus density (black) artifacts –Additional exposure of film granules –Light leaks –Static –Pressure from rollers Minus density (white) artifacts –Objects that absorb x-rays or light –Dust (very common) –Eye glasses –Nose –Fingerprints –Screen scratches or stains
 artifacts –Additional exposure of film granules –Light leaks –Static –Pressure from rollers Minus density (white) artifacts –Objects that absorb x-rays or light –Dust (very common) –Eye glasses –Nose –Fingerprints –Screen scratches or stains")
35
Measure optical density in several locations with a spot densitometer to determine quantitatively if a mammogram is underexposed. If the readings in the densest glandular area of the film are consistently less than 1.0, the mammogram is underexposed. Increase the density control (not kVp) to make the image darker. Technical Tip #1
 to make the image darker. Technical Tip #1.")
36
Fatty Tissue Region Dense Tissue Region Mammogram exposure level Optical Density Film Contrast Optical Density Film Contrast Under-exposed1.103.50.82.8 Appropriately exposed 2.004.51.053.5 Example Note that actual values may vary with the film used

37
How do we maintain consistent image quality ?

38
Technical Tip #2 Goal: consistent background density When Phantom Image BD and DD vary (and mAs remains constant), Obtain phantom images at the next higher or lower density control setting needed to achieve the desired BD. Post the control booth (or alter the default AEC settings) to use this density control until further notice. Sign and date the note.
 to use this density control until further notice. Sign and date the note..")
39
How can we help the radiologists to see abnormalities in a mammogram ?

40
Technical Tip #3 To assure optimal perception of well exposed SF mammograms, use viewboxes with sufficient brightness (luminance) to permit the observer to operate in day vision, even when viewing darker mammograms. ACR recommends that mammography viewboxes produce at least 3,000 cd/m2. Many facilities now use viewboxes that produce > 5,000 cd/m2 to optimally visualize darker mammograms.

41
Technical Tip #4 For both SF and Digital mammography, To minimize glare, maintain subdued lighting in the reading room and mask each mammogram using fully exposed mammography film, sliding masking panels or “hand held tunnel viewers”. Technologists should use similar viewboxes (and eventually monitors) to assess overall image quality.
 to assess overall image quality..")
43
What should I do when the exposure time seems long ?

44
Technical Tip #5 If exposure times exceed about 2 seconds, increase the kVp but do not change the density control (aka the “2- second rule” ), Listen to the exposure beep. When in doubt... Divide the post-exposure mAs by the mA to obtain the exposure time. To do this, you must know the mA (for large and small focal spots) of each unit in your department or practice.
 of each unit in your department or practice..")
45
Contact Mammography is 26 kVp, 225 mAs too long? Unit 1Unit 2Unit 3 100 mA80 mA150 mA 225 mAs 2.25 sec 225 mAs 2.8 sec 225 mAs 1.5 sec

46
Copyright ©Radiological Society of North America, 1999 Hogge, J. P. et al. Radiographics 1999;19:503-522

47
What can I do when the image seems sub-optimal ?

48
Technical Tip #6 When troubleshooting problem mammograms, review all the information printed on the film by the ID camera, including kVp, mAs, AEC sensor placement and density control. If motion is suspected, apply the 2 second rule (see Technical Tip #5).
..")
49
MCCORMICK, LINDA 09/18/2006 012-34-567812/12/1934 62 F INSTITUTION NAME2 +52 ANYTOWN, ANYSTATE, U.S.A. AKV 28kV 226mAs D:NO MO 3 35# PAIN LT VOQ6. 0cm 123 GE DMR and 800T

50
Technical Tip # 7 If the average glandular dose exceeds about 200 mrad for the phantom image, verify that the screen-film combination is recommended by the film manufacturer (or otherwise equivalent)… … and verify that the film processing has been optimized according to the film manufacturer’s recommendations.
… … and verify that the film processing has been optimized according to the film manufacturer’s recommendations.")
51
Screen-Film Mammo ACR Phantom Scores Optical Density & Contrast FFDM ACR Phantom Scores Pass/fail requirements differ by vendor Signal-to-Noise Ratio (SNR) Contrast-to-Noise Ratio (CNR) Image Quality
 Contrast-to-Noise Ratio (CNR) Image Quality")
52
ACR Phantom Imaging GE & Fuji Lorad & Siemens Fibers45 Specks34 Masses34 Image Quality Courtesy Eric Berns, PhD

53
Selenia 7.4 Test Procedure It is important for performing this test that the kVp and Filter selection is done at a thickness of 4.5 cm. Using the alternate test procedure guarantees the correct AEC behavior for the test because: Selenia Auto-kV and Auto-Filter modes, kV and filter selections are strictly controlled by compression thickness. The mAs value is determined by a short pre- exposure in all AEC modes. Following the steps in the alternate test procedure is clinically equivalent to acquiring the phantom image at 4.5 cm compression thickness using Auto- Filter or Auto-kV.

54
Image Quality Fuji FCRm GE 2000D, DS, Essential Hologic Selenia Siemens Novation Manual TechniquesX Clinical TechniqueXSort of… CNRXXXX Courtesy Eric Berns, PhD

55
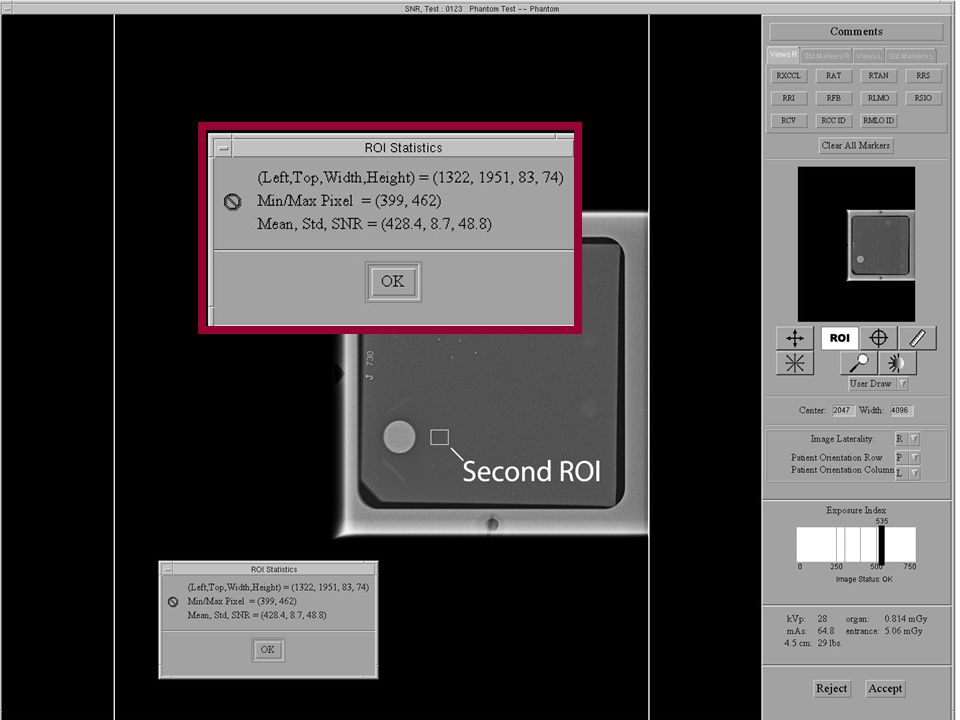
Signal-to-Noise Ratio (SNR) Variation in background for uniform exposure Signal = average pixel value Noise = standard deviation SNR = SNR must be > 40 “What exactly is CNR and SNR”? Average Signal Value – DC offset Standard Deviation

57
Noise and SD ? SD = 2.3 SD = 3.4 SD = 5.1

58
Contrast-to-Noise Ratio (CNR) Similar to Density Difference (Film) Contrast = Difference in pixel values (bkg-disc) Noise = standard deviation CNR = CNR Mean(bkg) – Mean (disc) Standard Deviation (bkg)
 Similar to Density Difference (Film) Contrast = Difference in pixel values (bkg-disc) Noise = standard deviation CNR = CNR Mean(bkg) – Mean (disc) Standard Deviation (bkg)")
60
ACR Phantom Imaging Manual technique (Mo/Mo, 26 kVp, 125 mAs) Score the processed image Acquisition workstation Each monitor of the RWS Laser imager GE 2000D Courtesy Eric Berns, PhD
 Score the processed image Acquisition workstation Each monitor of the RWS Laser imager GE 2000D Courtesy Eric Berns, PhD")
61
Contrast-to-Noise Test (CNR) To examine consistency of CNR ratio measured over time Use the raw image + 20% of baseline Background ROI Mass ROI CNR = (Mean background - Mean mass )/SD background GE 2000D Courtesy Eric Berns, PhD
 To examine consistency of CNR ratio measured over time Use the raw image + 20% of baseline Background ROI Mass ROI CNR = (Mean background - Mean mass )/SD background GE 2000D Courtesy Eric Berns, PhD")
62
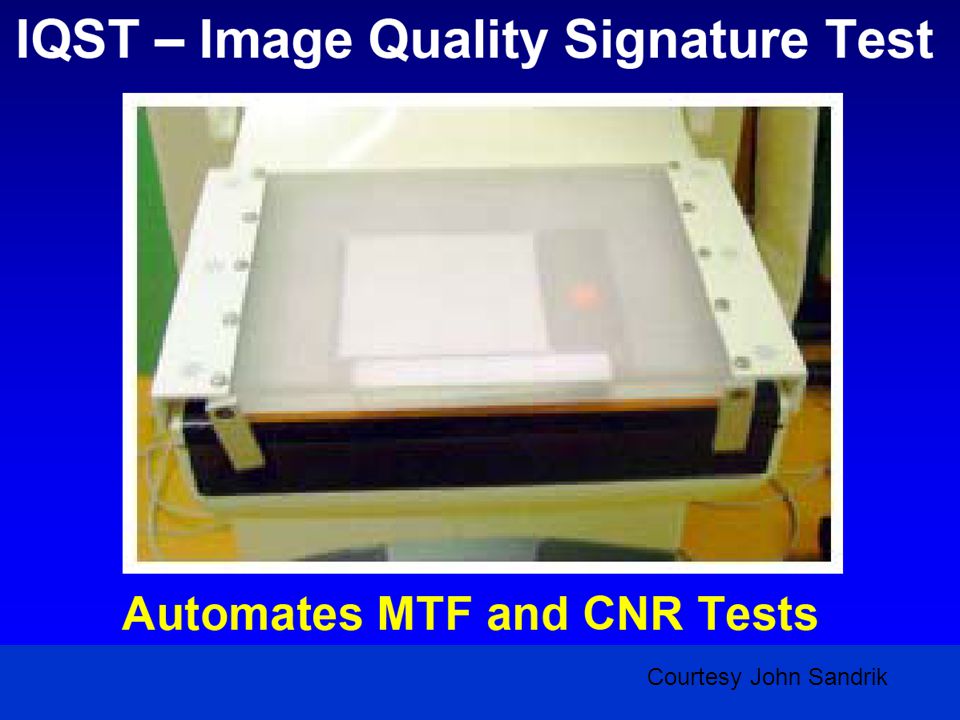
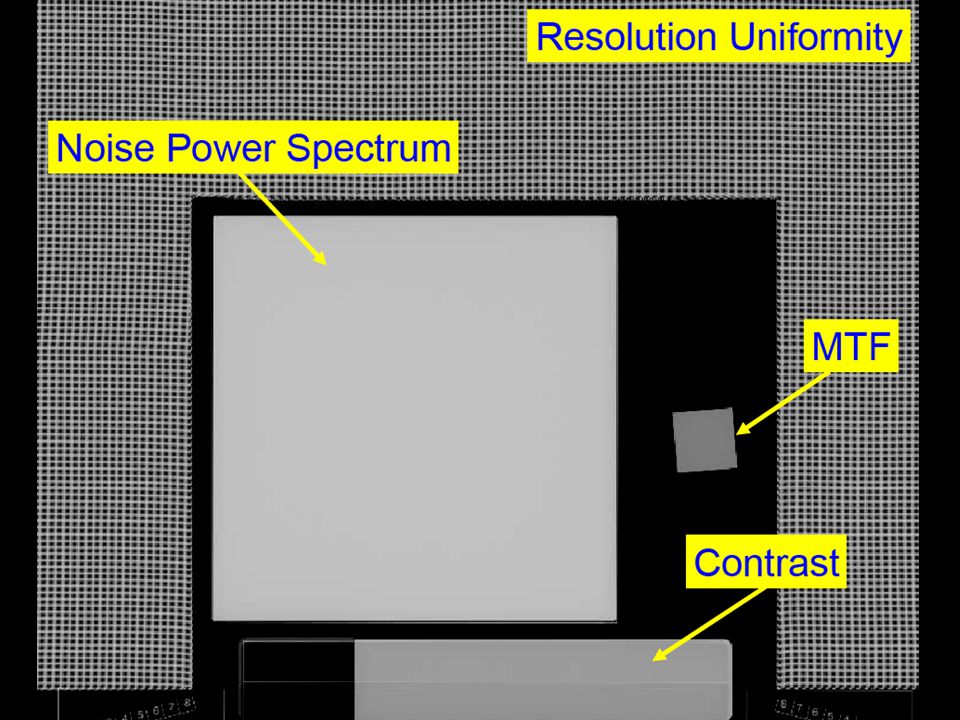
CNR & MTF (DS, Essential) Courtesy John Sandrik
 Courtesy John Sandrik")
66
Contrast-to-Noise Test (CNR) To examine consistency of CNR measured over time Use 4 cm acrylic & 0.2 mm Al Manual technique (Mo/Mo, 26 kVp, 125 mAs) Calculate CNR using software + 20% of baseline Fuji FCRm Courtesy Eric Berns, PhD
 To examine consistency of CNR measured over time Use 4 cm acrylic & 0.2 mm Al Manual technique (Mo/Mo, 26 kVp, 125 mAs) Calculate CNR using software + 20% of baseline Fuji FCRm Courtesy Eric Berns, PhD")
67
Rememebr this from Kodak? Service Bulletin was updated Recommendations for –S–Starter – now 3 oz per gallon, across the board –N–New replenishment rates –B–Be sure your service people follow these Kodak MinR Guide –P–Processor QC before-after service –C–Checklist available –h–http://www.kodak.com/global/plugins/acrobat /en/health/pdf/prod/Mammo/M3-103.pdf

68
Summary Contrast Blur Noise Artifacts Dose Image Characteristics To optimize Image Quality and Radiation Dose CNR - SNR Technical Tips

69
Thank you to the RMA! For many years of service to the mammography community.

70
Now for some well-deserved rest…

71
http://www.upstatemp.com click Education & Training Look for a link “RMA May 1, 2010”

72
http://www.upstatemp.com/

Similar presentations


 kVp determine the quality of the beam.>")


