Download presentation
Presentation is loading. Please wait.

1
CDOT Safety Grants Webinar Carol Gould, Occupant Protection Program Manager Lenore C. Bates, Colorado Safe Routes to School Program Manager Lorann Stallones, MPH, PhD, FACE, Professor, Colorado State University

2
Office of Transportation Safety (OTS) Traffic Safety Programs PEOPLE AND PROGRAMS SAVING LIVES
 Traffic Safety Programs PEOPLE AND PROGRAMS SAVING LIVES")
3
MISSION STATEMENT To reduce the incidence and severity of motor vehicle crashes and the human and economic loss associated with motor vehicle crashes.

4
In support of this mission, the OTS offers grants for programs, projects, services, and strategies that are intended to reduce the number of deaths and serious injuries resulting from traffic crashes on Colorado roads.

5
Eligibility Colorado state agencies Federally recognized tribal governments Cities, counties and their sub-agencies For Profit entities Non-profit entities with existing IRS 501 (c) (3) status
 (3) status")
6
Application Process Approximately $3.0 million projected to be available, with award amounts typically ranging from $10,000 - $250,000. Contracts run on federal fiscal year cycle: October 1 – through September 30

7
Application Process Match (Cash or In-Kind) must equal a minimum of 25% of the total project cost CDOT funds grants on a "cost reimbursement“ basis only Application cycle begins May 2011 - http://www.coloradodot.info/business/grants/ safetygrants
 must equal a minimum of 25% of the total project cost CDOT funds grants on a cost reimbursement basis only Application cycle begins May safetygrants")
8
NHTSA Performance Measures The proposed project must impact at least one of the following performance measures: C-1. Reduce the number of traffic fatalities Number of traffic fatalities in 2008: 548 C-2. Reduce the number of serious injuries in traffic crashes Number of serious injuries in traffic crashes in 2005: 4,1810

9
NHTSA Performance Measures C-3. Reduce the fatalities per Vehicle Miles Traveled (VMT) Total fatalities per Vehicle Miles Traveled (VMT) in 2008 : 1.15 Urban fatalities per Vehicle Miles Traveled (VMT) in 2008 :.78 Rural fatalities per Vehicle Miles Traveled (VMT) in 2008: 1.89
 Total fatalities per Vehicle Miles Traveled (VMT) in 2008 : 1.15 Urban fatalities per Vehicle Miles Traveled (VMT) in 2008 :.78 Rural fatalities per Vehicle Miles Traveled (VMT) in 2008:")
10
NHTSA Performance Measures C-4. Reduce the number of unrestrained passenger vehicle occupant fatalities, all seat positions Number of unrestrained passenger vehicle occupant fatalities in 2008 : 173 C-5. Reduce the number of fatalities in crashes involving a driver or motorcycle operator with a BAC of.08 and above Number of fatalities in crashes involving a driver or motorcycle operator with a BAC of.08 and above in 2008 : 173

11
NHTSA Performance Measures C-6. Reduce the number of speeding-related fatalities Number of speeding-related fatalities in 2008 : 210 C-7. Reduce the number of motorcyclist fatalities Number of motorcyclist fatalities in 2008 : 98 C-8. Reduce the number of unhelmeted motorcyclist fatalities Number of unhelmeted motorcyclist fatalities in 2008: 68

12
NHTSA Performance Measures C-9. Reduce the number of drivers age 20 or younger involved in fatal crashes Number of drivers age 20 or younger involved in fatal crashes in 2008: 87 C-10. Reduce the number of pedestrian fatalities Number of pedestrian fatalities in 2008 : 44 B-1. Increase the observed seat belt use for passenger vehicles Observed seat belt rate for passenger vehicles in 2010: 82.9%

13
Available Data and Resources 2009 Fatal Data - FARS – County by County fatality data Seat Belt Surveys 2010 Colorado Problem ID NHTSA Countermeasures that Work http://www.coloradodot.info/programs/safety-data-sources- information

14
Uniform Minimum Standards for Prevention Programs Developed by the Colorado Prevention Leadership Council in accordance with state statute Adopted across five state departments in 2004 Intended to guide best-practice approaches for prevention programs and services Incorporated in state-issued RFPs and RFAs for prevention programs for children and youth

15
Uniform Minimum Standards Clear Statement of the Issue/Need(s) to be Addressed Focus on Contributing Factors Intended outcomes Evidence-based Programs/Services Services and Target Population Specified Evaluation Agency Capacity Collaboration
 to be Addressed Focus on Contributing Factors Intended outcomes Evidence-based Programs/Services Services and Target Population Specified Evaluation Agency Capacity Collaboration")
16
Uniform Minimum Standards Assessment Tool Identifies core competencies for each standard Assists local prevention providers in assessing strengths and opportunities for improvement

17
Uniform Minimum Standards Assessment Tool Identifies specific, targeted training and technical assistance needs Identifies areas of excellence www.colorado.gov/plc —click on Resource tab to download the UMS Assessment Tool

18
Contact Information Impaired Driving Prevention and Motorcycle Safety Programs: Glenn Davis 303-757-9462 glenn.davis@dot.state.co.us Occupant Protection Programs: Carol Gould 303-757-9648 carol.gould@dot.state.co.us Law Enforcement Coordinator: Captain Bruce W. Sheetz 303-757-9463 Bruce.sheetz@dot.state.co.us

19
Colorado’s Approach to Safe Routes to School Lenore C. Bates (303) 757-9088 SRTS@dot.state.co.us
")
20
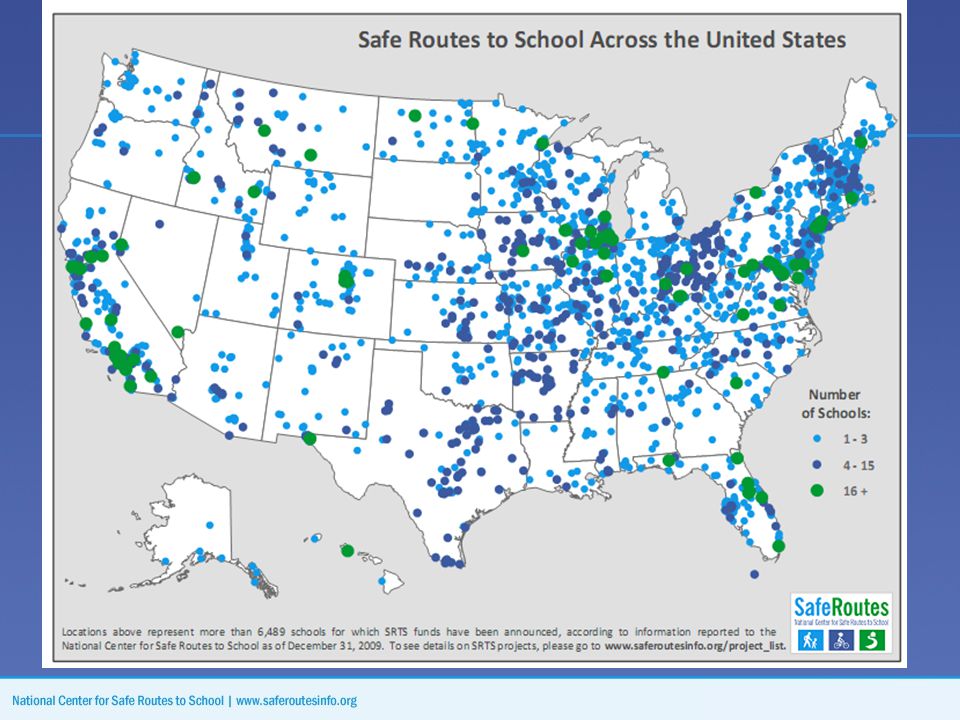
August 2005, SAFETEA-LU was passed. This law designated $612 million in Federal transportation funds, distributed through each State’s Department of Transportation to: enable and encourage children to walk and bicycle to school; improve the safety of children walking and bicycling to school; and facilitate projects and activities that will reduce traffic, fuel consumption, and air pollution near schools.

21
Elements of Safe Routes to School programs Evaluation Encouragement Education Enforcement Engineering

22
Safe Routes to School Programs are part of the solution… … to improve unsafe walking and biking conditions … to increase physical activity … to improve poor air quality by reducing vehicle emissions … to create walking and bicycling options for an array of needs …to reduce transportation costs for schools

23
Fewer kids are biking and walking More parents are driving 1969 2009 48% walked13% walked 12% driven44% driven (U.S. DOT, 2008)
.")
24
Parents driving Parents driving their children to school account for 20%-25% of morning rush hour traffic. (Parisi Associates; Melbourne Department of Infrastructure)
.")
25
The consequences of this…

26
…instead of this can be alarming.

27
School siting issues: A generation ago Small (average of 127 students)* Located in community centers 42% of kids walked or biked to school** (*EPA, 2003; **1969 Nationwide Personal Transportation Survey)
* Located in community centers 42% of kids walked or biked to school** (*EPA, 2003; **1969 Nationwide Personal Transportation Survey)")
28
School siting issues: Today Mega-schools (average 538 students) 44% of secondary schools have 1500+ students Schools located on 10 to 30+ acres fringe land Lowest-cost construction (U.S. Department of Education, 2005-2006)
.")
30
School Arrival and Departure Modes

31
More social interaction Increased independence Increased physical activity Improved pedestrian skills Community design Less reliance on automobile Decreased neighborhood/ school traffic Reduced fear of crime Many reasons to do a Safe Routes to School program Connected to many issues…

32
Colorado’s Program 107 Projects/411 Schools Crossing Guard Program SRTS Curriculum Walk to School SRTS State Network Art by Tony Ortega & design by Phil Normand

33
Community success stories

34
Central Elementary School, Commerce City, CO New facilities needed to guide children to cross at crosswalk

35
Central Elementary School, Commerce City, CO Partnerships between transportation, health, police, and school

36
Student Population: 635 students Free/Reduced Lunch students: 83 percent Located in Commerce City, CO Federal funds awarded: $100,689.22 Awarded 2006 for infrastructure (includes $3,500 component for education) Results: Approximately fifty percent of the children crossed outside of the crosswalk before improvements Continue re-teaching using communication tools such as the Principal’s Parent newsletters. Walking increased by approximately 10% Central Elementary

37
Public Works, Loveland, CO Improving transportation around schools

38
Number of Schools:3 Student Population: 1,145 Free/Reduced Lunch students: 34.8 percent avg. Located in Loveland, CO Funds awarded: $5,800 in 2008 for education and encouragement $74,040 in 2008 for infrastructure Results: Increases: 4% riding, 2% walking, 1% school-pooling and decrease in personal vehicle by 7% Reached 4,000 families through outreach Partnerships – SafeKids, LiveWell Loveland (CanDo), etc Loveland Public Works
, etc Loveland Public Works.")
39
Public Health, Teller County, CO Healthy, active kids make better learners.

40
Number of Schools:3 schools Free/Reduced Lunch students: 24 - 62 percent Student Population: 1,089 Located in Cripple Creek and Woodland Park, CO Federal funds awarded: $13,581 Awarded 2007 for education and encouragement Results: Speed limit reduced – in Woodland Park…35 to 30 mph Sidewalk improvements around schools - provided by the City of Cripple Creek and Woodland Park RE2 Bike and Hike successful – now held annually Teller County Public Health

41
100% 90% 80% 70% 60% 50% 40% 30% 20% 10% 0% 20 mph 30 mph40 mph UK Department of Transportation Death No Injury Injury Fatalities based on speed of vehicle A pedestrian’s chance of death if hit by a motor vehicle

42
Southern Ute Community Action Program (SUCAP), Ignacio, CO Improving health is a community goal
, Ignacio, CO Improving health is a community goal")
43
Number of Schools:4 schools Free/Reduced Lunch students: 60 percent avg. Student Population: 605 Located in Ignacio, CO Federal funds awarded: $13,377 Awarded 2008 for education and encouragement $15,000 Awarded 2009 for education and encouragement Results: Student Participation – in spite of inclement weather Summer Walking & Riding – so it is the norm Increase in biking & helmet use SUCAP

44
Case study: Bear Creek Elementary, Boulder, CO A car-free commute changes habits of entire families

45
Student Population: 365 students Original Percentage of walkers/bikers: 41 percent Current Percentage: 70 percent and growing! Federal funds awarded: $ 36,101 Awarded 2008; Shared among 3 schools $ 73,000 Awarded 2007; Shared among 6 schools (Education & Encouragement) $154,000 Awarded 2009 to City of Boulder to retrofit an intersection Results: 2007-2008 school year: 30 percent reduction in cars and corresponding traffic congestion during the 2007-2008 school year September 2008: students accrued 4,800 miles from 6,600 Car-Free Commute trips in one month Bear Creek Elementary’s Car-Free Commute Program
 $154,000 Awarded 2009 to City of Boulder to retrofit an intersection Results: school year: 30 percent reduction in cars and corresponding traffic congestion during the school year September 2008: students accrued 4,800 miles from 6,600 Car-Free Commute trips in one month Bear Creek Elementary’s Car-Free Commute Program.")
46
How do you start a SRTS program? Form a committee: Identify key people with SRTS interests (safety, activity, community); Look for existing groups (safety task force, wellness committee); and Hold a kick-off meeting. http://www.saferoutesinfo.org/guide/steps/i ndex.cfmhttp://www.saferoutesinfo.org/guide/steps/i ndex.cfm
; Look for existing groups (safety task force, wellness committee); and Hold a kick-off meeting. ndex.cfmhttp:// ndex.cfm.")
47
Continue forming a SRTS program… Gather Information, Identify Issues with CDOT School Zone Traffic Safety Evaluation; NCSRTS Student Talley & Parent Survey; and Walkability and Bikeability Checklists.

48
Include the “five E’s” in the program… Identify Specific Solutions to Address the Issues Identified in the Previous Step; Make a Plan; Funding (Federal, State, County, City, Private, and Charitable Organizations); and Just Do It!
; and Just Do It!")
49
Safe Routes to School Applications Non-Infrastructure (Education) $3,500 min Infrastructure (Capital) $50,000 min; $250,000 max Now Available at www.coloradodot.info www.coloradodot.info Due 12/3/2010, 4 p.m.
 $3,500 min Infrastructure (Capital) $50,000 min; $250,000 max Now Available at Due 12/3/2010, 4 p.m.")
50
Application Information Eligible Entities Pre- and Post-Evaluations Cover Sheet – Contact Information Sheet Application Checklist Other Person Proofread

51
Application Information Tell Us About Your Project Solutions Audiences What are the Problems Identified through sources School Demographics Timeline

52
Application Information Who are Your Partners Help with Application Roles & Responsibilities Evaluation/Measurement Talley & Survey Other Tools Budget

53
Thank you! SRTS@dot.state.co.us saferoutesinfo.org

54
Lorann Stallones, MPH, PhD Director, Colorado Injury Control Research Center Colorado State University

55
Systematic, visual way to present and understand the relationships between the resources you have to operate a program, the activities planned, and the changes or results you hope to achieve. Helps to focus attention on your planned work and your intended results. Provides a framework to ensure your activities are linked to your intended long term outcome. This model provides a road map of your program, highlighting how it is expected to work, what activities need to come before others, and how desired outcomes are achieved.

56
Resources/ Inputs OutputsOutcomes What we have Needs Plans Strategies Resources Data about the problem addressed What we do Convene Create Advocate Train Educate Products of program activities Types of services Levels of services Target populations to receive services Short term Awareness Knowledge Attitudes Skills Motivations Intentions Medium term Behaviors Policies Services Systems Norms Long term ∙ Reduced disease and death Activities Generic Logic Model Impact Certain resources are needed to operate your program If you have access to them, then you can use them to accomplish your planned activities If you accomplish planned activities, then you will deliver the amount of product/service you intended If you accomplish planned activities as intended, then your participants will benefit in certain ways If benefits to participants are achieved, then certain changes in communities might be expected to occur

57
Resources/ Inputs OutputsOutcomes What we have High number of traffic deaths among young drivers Community coalition to address the problem (e.g. DriveSmart Funding from CDOT What we do Engage local high school in program Develop training materials for students Deliver training program Conduct informational meetings with parents Products of activities Number of schools recruited Number of training programs developed Number of high school students receiving training Number of programs delivered to parents, number of parents attending programs Short term Awareness increased among school personnel Knowledge of safe behaviors increased among students Attitudes of students and parents toward reducing crashes and injuries changed Long term ∙ Reduce the number of deaths from crashes, injuries and deaths among young drivers Activities Logic Model-Office of Transportation Safety Impact Goal of the program: Reduce the number of young drivers crashing, suffering from serious injuries and dying.

58
Resources/ Inputs OutputsOutcomes What we have High number of pedestrian/traffic injuries in the community Police department School District Local radio station Funding from CDOT What we do Develop a radio campaign about school zones and safe motorist behavior Post radio campaign to local websites Conduct radio listener survey Conduct observational studies around school zones before and after the campaign Products of activities Number of radio spots delivered during study Number of downloads from the website Number of interviews conducted with radio listeners Number of observations of safe and unsafe behaviors in school zones during the campaign Short term Knowledge of safe behaviors increased among radio listeners Medium term Fewer violations of safety laws in school zones after the campaign Long term ∙ Reduce the number of pedestrian/traffic injuries near school zones Activities Logic Model-Safe Routes to School Impact Goal of the program: Increase safe behavior of drivers in and around school zones.

59
http://www.uwex.edu/ces/pdande/evaluation/evallogicmodel.html http://www.uwex.edu/ces/pdande/evaluation/evallogicmodel.html http://www.wkkf.org/knowledge-center/resources/2010/Logic- Model-Development-Guide.aspx http://www.wkkf.org/knowledge-center/resources/2010/Logic- Model-Development-Guide.aspx http://www.cdc.gov/eval/resources.htm http://www.cdc.gov/eval/resources.htm

60
Lorann Stallones, MPH, PhD Director, Colorado Injury Control Research Center Colorado State University

61
http://www.cdphe.state.co.us/cohid/ http://www.cdphe.state.co.us/cohid/ The Colorado Health Information Dataset (CoHID) allows access to local-level health data compiled by the Colorado Department of Public Health and Environment to help users determine the health status of a neighborhood, community, county, or region in Colorado. ◦ Death data since 1990 by county and zip code. Dataset DetailsDataset Details ◦ Population estimates from the Demography Section of the Colorado Department of Local Affairs, Division of Local Government since 1990 by county. Dataset DetailsDataset Details ◦ Behavioral Risk Factor Surveillance System data for Colorado adults 18 years or older for the most recent available years. Dataset DetailsDataset Details ◦ Injury hospitalization data for Colorado residents 1995 through the most recent available year. Dataset DetailsDataset Details

62
http://www.coloradodot.info/programs/seatbelts- carseats/surveys http://www.coloradodot.info/programs/seatbelts- carseats/surveys ◦ 2010 CDOT Teen Seat Belt Survey ◦ 2009 CDOT Teen Seat Belt Study ◦ 2009 Child Restraint Juvenile Seat Belt Survey ◦ 2009 RETAC Seat Belt Survey ◦ 2009 Statewide Seat Belt Survey

63
http://www.nhtsa.gov/people/ncsa/fars.html http://www.nhtsa.gov/people/ncsa/fars.html ◦ FARS contains data on all fatal traffic crashes within the 50 states, the District of Columbia, and Puerto Rico. The data system was conceived, designed, and developed by the National Center for Statistics and Analysis (NCSA) to assist the traffic safety community in identifying traffic safety problems, developing and implementing vehicle and driver countermeasures, and evaluating motor vehicle safety standards and highway safety initiatives. ◦ Data on fatal motor vehicle traffic crashes are gathered from the state's own source documents, and are coded on standard FARS forms. The analysts obtain the documents needed to complete the FARS forms, which generally include some or all of the following: Police Accident Reports (PARS) State vehicle registration files State driver licensing files State Highway Department data Vital Statistics Death certificates Coroner/Medical examiner reports Hospital medical records Emergency medical service reports
 to assist the traffic safety community in identifying traffic safety problems, developing and implementing vehicle and driver countermeasures, and evaluating motor vehicle safety standards and highway safety initiatives. ◦ Data on fatal motor vehicle traffic crashes are gathered from the state s own source documents, and are coded on standard FARS forms. The analysts obtain the documents needed to complete the FARS forms, which generally include some or all of the following: Police Accident Reports (PARS) State vehicle registration files State driver licensing files State Highway Department data Vital Statistics Death certificates Coroner/Medical examiner reports Hospital medical records Emergency medical service reports.")
64
http://www.nhtsa.gov/ http://www.nhtsa.gov/ ◦ Special Crash Investigations (SCI) ◦ National Driver Register (NDR) ◦ State Data Program & CODES Linking Up Crash Data - The State Data Program (SDP) supports NHTSA’s efforts to identify traffic safety problems, help develop and implement vehicle and driver countermeasures, evaluate motor vehicle standards, and to study crash avoidance issues, crashworthiness issues, and regulations. Crash Outcome Data Evaluation System (CODES) Injuries resulting from motor vehicle crashes remain a major public health problem. These injuries cause unnecessary burden of increased taxes and insurance premiums. They can be prevented, or reduced, but only if we understand their type, severity and cost in relation to the characteristics of the crash, vehicles, and persons involved. Crash data alone do not indicate the injury problem in terms of the medical and financial consequences. By linking crash, vehicle, and behavior characteristics to their specific medical and financial outcomes, we can identify prevention factors.
 Injuries resulting from motor vehicle crashes remain a major public health problem. These injuries cause unnecessary burden of increased taxes and insurance premiums. They can be prevented, or reduced, but only if we understand their type, severity and cost in relation to the characteristics of the crash, vehicles, and persons involved. Crash data alone do not indicate the injury problem in terms of the medical and financial consequences. By linking crash, vehicle, and behavior characteristics to their specific medical and financial outcomes, we can identify prevention factors..")
65
http://www.saferoutesinfo.org/ http://www.saferoutesinfo.org/ ◦ Safe Routes to School programs enable community leaders, schools and parents across the United States to improve safety and encourage more children, including children with disabilities, to safely walk and bicycle to school. In the process, programs are working to reduce traffic congestion and improve health and the environment, making communities more livable for everyone. ◦ http://www.saferoutesinfo.org/data/ http://www.saferoutesinfo.org/data/ This page is the one-stop place for all the National Center’s resources related to data collection and evaluation. The links provided here direct users to resources for collecting, entering, and using Safe Routes to School (SRTS) data.
 data..")
66
http://www.coloradodot.info/library/traffic/traffic- manuals-guidelines/safety-crash-data/fatal- crash-data-city-county http://www.coloradodot.info/library/traffic/traffic- manuals-guidelines/safety-crash-data/fatal- crash-data-city-county CDOT website has extensive information on crashes and fatalities that you can explore.

67
Questions?

Similar presentations


 Office of Safety.>")
 This solictation uses remaining.>")


 Presented by Ronald.>")


 › Possible look.>")

 Program Presented by: Carol Pulley University of Florida Safety Administrator Florida School Crossing.>")

