Download presentation
Presentation is loading. Please wait.

1
Bioclimatic Modelling BIOCLIM Arthur D. Chapman paper133@achapman.org Kakadu National Park

2
Bioclimatic Modelling The need for modelling Different model types Development of BIOCLIM How does BIOCLIM work? Some uses of BIOCLIM –In Environmental Decision Support Systems –Data validation –Climate change studies –Survey planning Conclusions Bioclimatic Modelling BIOCLIM

3
Environmental Modelling Modelling of landscape patterns Fitness for use Different kinds of models each with their own strengths and weaknesses Several classes of models in common use: –Heuristic models such as BIOCLIM –Additive statistical models eg Generalised Linear Models (GLM); Generalised Additive Models (GAM) –Decision tree models such as CART, ACE and S-Plus algorithms –Genetic algorithms such as GARP
; Generalised Additive Models (GAM) –Decision tree models such as CART, ACE and S-Plus algorithms –Genetic algorithms such as GARP")
4
The need for modelling

6
BIOCLIM Heuristic based model Works with presence-only data Simple to use 35-dimensional Hypercube in climate- space Tends to over-predict Small number of records Will work in batch mode Can’t make quantitative predictions or provide confidence levels Used for predicting potential distributions

7
GLM and GAM Generalised Linear Models and Generalised Additive Models Ecological niche models Require extensive statistical knowledge Require level of ecological knowledge Require presence/absence data Require lots of reliable records Good at regional scales Require good environmental data Most rigorous of the methods

8
GARP Works with presence and presence/absence data Requires high numbers of records Rule/sample based Data layers easy to prepare Produces tight models Assumptions not always obvious

9
Development of BIOCLIM A bioclimatic prediction system - uses surrogates derived from monthly mean climate estimates. First became available for general use in 1984. The first program was the outcome of a collaborative project between Henry Nix at CSIRO and John Busby at the Australian Biological Resources Study. Later split into three separate programs, ESOCLIM, BIOCLIM and BIOMAP. All programs use monthly mean climate surface coefficient files generated by the ANUSPLIN package (Hutchinson 1989, 1991). The numbers of bioclimatic parameters have changed over time from 12 through 16, 21, 24, 28 and 35. The current version can produce up to 35 bioclimatic parameters based on the climate variables temperature, rainfall, solar radiation and pan evaporation. In 1999 (ANUCLIM 5.0) David Houlder wrote a graphical user interface
. The numbers of bioclimatic parameters have changed over time from 12 through 16, 21, 24, 28 and 35. The current version can produce up to 35 bioclimatic parameters based on the climate variables temperature, rainfall, solar radiation and pan evaporation. In 1999 (ANUCLIM 5.0) David Houlder wrote a graphical user interface.")
10
Part of a suite of models –ESOCLIM (ESTimation Of CLIMate) generates output containing climate variable estimates at specified points. –BIOCLIM generates bioclimatic parameters derived from climate surfaces to determine a climatic envelope for plants and animals. –BIOMAP uses output from BIOCLIM to predict possible habitat locations based on known habitat locations. BIOCLIM

11
Climate surfaces

12
BIOCLIM – Bioclimatic Parameters

13
Temperature profiles for Acacia orites annmincmmxwmrgeclqwmqwetqdryq Mean17.26.226.119.912.321.320.013.8 S.D.1.82.01.62.02.11.63.62.0 Min12.10.223.918.15.818.35.810.6 5%-ile12.10.223.918.15.818.35.810.6 25%-ile16.46.124.618.511.820.219.92.5 75%-ile18.36.17.220.212.82.821.314.8 95%-ile19.69.229.023.015.223.723.417.6 max19.69.229.425.415.223.823.617.6

14
Modelled distribution using BIOCLIM Eucalyptus curtisii © A.D.Chapman, 1994 Distribution derived from point specimen records from the Queensland Herbarium. BIOCLIM models based on ANUCLIM Version 1.8, Centre for Resource and Environmental Science, Australian National University.

15
Expert validation of BIOCLIM model Distribution derived from point specimen records from the Queensland Herbarium. BIOCLIM models based on ANUCLIM Version 1.8, Centre for Resource and Environmental Science, Australian National University. Validation comments by staff of the Queensland Herbarium, Queensland Environment Protection Authority. Eucalyptus curtisii © A.D.Chapman, 1994

16
species distribution maps Pultenaea setulosa The map is based on specimen and site survey data from the Queensland Herbarium, and Environment Australia, plus data digitised from Smart, I.M. & Tu, U.R (1993). Final Report for Survey for Pultenaea setulosa. A modelled distribution was obtained using these distribution data and the BIOCLIM species modelling software based on ANUCLIM Version 1.8 from the Centre for Resource and Environmental Science, Australian National University. The modelled distribution was reviewed by experts from the Queensland Herbarium including John Neldner and Gordon Guymer.
. Final Report for Survey for Pultenaea setulosa. A modelled distribution was obtained using these distribution data and the BIOCLIM species modelling software based on ANUCLIM Version 1.8 from the Centre for Resource and Environmental Science, Australian National University. The modelled distribution was reviewed by experts from the Queensland Herbarium including John Neldner and Gordon Guymer..")
17
Species with widespread distributions Red - Recent records Blue/Yellow - Old/imprecise records Green - BIOCLIM prediction Regent Honeyeater

18
Decision Support Tools

23
BIOCLIM – use in data validation Acacia epicantha © ANBG Acacia orites - 19 records - 9 Temperature parameters

24
Outlier detection Reverse jack-knifing technique Threshold value t = 0.95( n) +0.2
 +0.2")
25
Corrected localities for Acacia orites Acacia acinacea © ANBG

26
BIOCLIM – use in data validation Acacia parramattensis © ANBG Acacia orites – temperature paramaters – after correction

27
BIOCLIM – climate change studies Temperature Subregion 1: +1.0° Subregion 2: +1.2° Subregion 3: +1.4° Rainfall +10% Summer 0% low Winter Rainfall -5% sub-regions A&B +5% sub-region C

28
Climate change and the Kowari

29
BIOCLIM – Smart survey Roadside vegetation – Western Australia

30
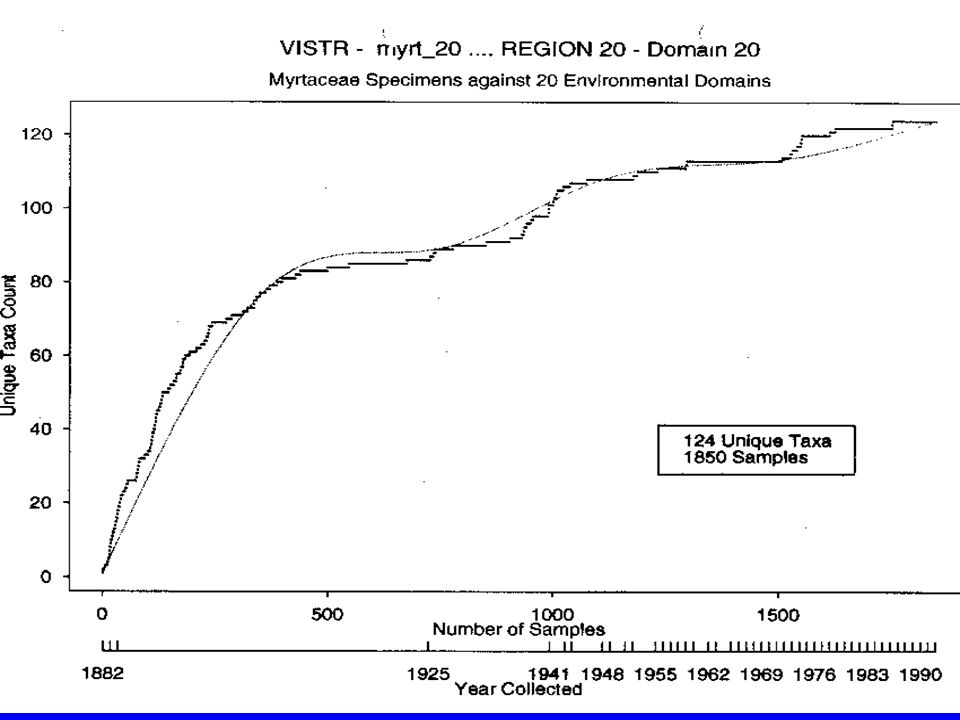
Data Gaps Distribution of species against Environmental attributes

31
Eucalyptus collections vs Environmental Attributes

33
Annual Mean Precipitation Class 2 4

34
Classes 2 and 4 under- surveyed

35
ANUCLIM user’s guide http://cres.anu.edu.au/outputs/anuclim/doc/Contents.html David Houlder, Michael Hutchinson, Henry Nix, June McMahon

36
Conclusion If you are going to use an environmental model: –Choose a model type that suits your inputs –Choose a model type that will produce the type of result you want –If possible – choose a model you understand –Beware of model designers – you will seldom find one that is not biased.

37
Conclusion All models, from whatever method, are hypotheses. They do not in themselves provide the answer and more often than not, are just one possible answer within a range of possible answers. No model can make sense out of poor data and any modelled result will only ever be as good as the data from which it was built. “there is no strong evidence to suggest that [predictive relationships] identified by one method are superior to those identified by another method, but at the very least, they should be testable” Sullivan and Chesson 1993.

38
Arthur D. Chapman paper133@achapman.org Kakadu National Park

Similar presentations


 Stage 2: Pest Risk Assessment Pest Risk Analysis (PRA) Training.>")


 for GIS Based Fisheries Decision.>")


