Download presentation
Presentation is loading. Please wait.

1
Dave Egan Emilie Grossmann Jeanine Rhemtulla
Land-use changes in the temperate forest biome: Implications for carbon-cycling Dave Egan Emilie Grossmann Jeanine Rhemtulla

2
Temperate Forests: Small in area but important biologically & politically
Smallest forest biome Lowest carbon content of all forest biomes Longest history of intensive land-use The missing sink? Politically powerful

3
Small in area Small amount of stored carbon
We could ditch this slide and just talk about it a little later – I think slide 15 is where I was going to put the descriptive stats on the temperate (Dixon et al 1994)
")
4
Longest history of intensive land-use
Much longer history of intensive land-use than either the tropics or boreal biomes Remaining old-growth: < 1% Europe 2-3% Australia (temperate eucalypt forests) ~ 25% New Zealand 3 – 5 % United States (Norton 1996 & WWF 1997)
 ~ 25% New Zealand. 3 – 5 % United States. (Norton 1996 & WWF 1997)")
5
Land-use II China: Temperate forests are known primarily from the fossil record – most forest was cleared for intensive agriculture 4000 years ago. Eastern United States: Clearing for timber and agriculture started in 1750’s and swept westward thereafter. Land Clearing in Harvard Forest, Fisher Museum Dioramas

6
Figure credit: Woods Hole Research Center
The missing sink? Figure credit: Woods Hole Research Center

7
Figure credit: Woods Hole Research Center
Missing sink II Forests are generally increasing in area throughout the temperate biome: Forest aggradation in eastern U.S. Forest restoration in China Plantations in New Zealand “the coterminous United States, Europe, China, and small Eurasian countries contained one-third of the [northern hemisphere’s] forest and woodland area, but accounted for at least 80% of the observed C-sink. This disproportionate sink in temperate regions relative to boreal regions likely reflects the temperate zone’s legacy of large-scale land-use management and change over the last century, and fire-suppression policies in recent decades.” (Goodale et al. 2002) Figure credit: Woods Hole Research Center
 Figure credit: Woods Hole Research Center.")
8
Politically powerful The G8 nations (with the exception of Canada and Russia) contain primarily temperate forest. Much of the world’s political and financial power resides in these nations. Is there a policy bias that favours nations of the temperate biome?

9
Types of temperate forest biome
Two major types: Broadleaf deciduous forest Evergreen forest Could combine this with the next slide if we want, or add some photographs or something

10
Broadleaf deciduous forest
Most temperate forests are deciduous These forests occur in: Eastern United States & adjacent Canada Western & Central Europe Eastern Asia, including Korea, Japan, parts of China and Russia Usually what comes to mind when someone says “temperate” – short warm Maybe use a map as a background for these slides?? Hopkins Memorial Forest, Williamstown, MA

11
Coniferous and broadleaf evergreen temperate forest
Mixed evergreen forests are a much smaller component of the temperate forest biome They are found primarily in western North America, Chile, New Zealand, and Australia Photo is of beech forests in New Zealand – needs layout help!

12
Working definitions of “temperate”
Biological issues: Ecotone between boreal and temperate forests Geographic issues: Europe often includes Nordic countries China is not usually split US & Canada are often lumped Consistency issues: “mid-latitude” (Dixon et al. 1994) re-interpreted as “temperate” (Mahli et al. 1999) I’ll flesh this out with the references – basically say that there’s no consistent stratification of the temperate biome - different papers use different regions which make comparison difficult
 re-interpreted as temperate (Mahli et al. 1999) I’ll flesh this out with the references – basically say that there’s no consistent stratification of the temperate biome - different papers use different regions which make comparison difficult.")
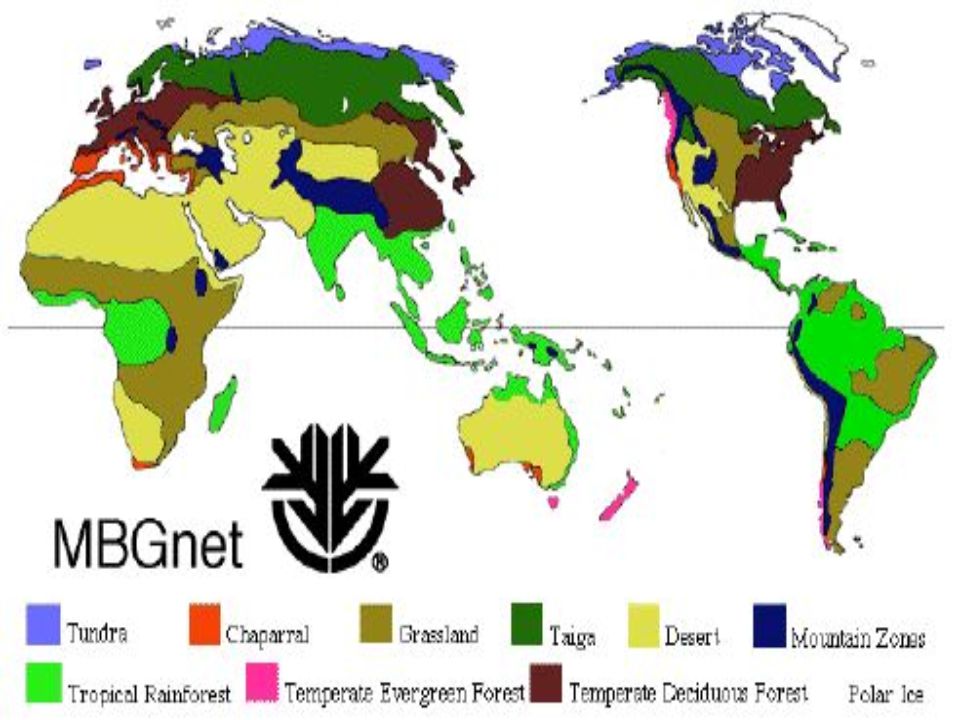
14
Shows the ecotone issue – Navy is “Evergreen-Deciduous Mixed Forest” – does anyone know how to make a little box around that item on the legend and insert a zoomed in piece of the legend so people can read it??

15
Definitions of “forest” and “woodland”
A forest is defined as “A plant community composed of trees the crowns of which touch, forming a continuous canopy.” A woodland is defined as “A plant community that includes widely spaced, mature trees the crowns of which do not touch and generally have a canopy closure of 40 percent or less.” (The Concise Oxford Dictionary of Ecology, 1996) I’ll add some details. Might also include the nebulous status of plantation forests
 I’ll add some details. Might also include the nebulous status of plantation forests.")
16
Temperate Forest Area Data from Dixon et al.(1994), Goodale et al. (2002), & Fang et al. (2001)
, Goodale et al. (2002), & Fang et al. (2001)")
17
Carbon storage in the temperate biome: State of the knowledge
Complementary approaches: Global/continental/regional Atmospheric studies Land-use studies Forest inventory/allometry Meta-analysis Local Eddy flux Stand measurements

18
Continental-scale C storage

19
Forest area vs C storage

20
C-flux

21
Local controls on carbon fixation
There has been a lot of mechanistic work done at this scale Patterns seen at larger scales are a composite of local phenomena We ultimately manage, and use land at a local scale

22
Controls on carbon fixation at a small scale
Many things limit carbon fixation: Forest age (Klopatek 2002) Water limitations (Irvine et al. 2002) Carbon dioxide limitations Nitrogen limitations (Nadelhoffer et al. 1999) Ozone pollution (Ollinger et al. 2002) Forest type
 Water limitations (Irvine et al. 2002) Carbon dioxide limitations. Nitrogen limitations (Nadelhoffer et al. 1999) Ozone pollution (Ollinger et al. 2002) Forest type.")
23
CO2 fertilization hypothesis
FACE Experiment, Duke Forest NPP increased by 25% (measurements included roots!) This study was done on a young, aggrading, temperate deciduous forest. This should be considered a maximum response. (DeLucia et al 1999)
 This study was done on a young, aggrading, temperate deciduous forest. This should be considered a maximum response. (DeLucia et al 1999)")
24
Missing pieces: Below-ground
We understand the general processes that limit soil C storage in undisturbed soil reasonably well. We also understand the trends of how land use change influences soil C storage, but need more field measurements. Moving to a larger scale requires modeling. We also need to synthesize this information with the data we have above-ground.

25
Amundson 2001: Regression derived from Post et al.’s 1982 data
Modeled SOC Lots of modeling has been done to explain how SOC relates to climate. Amundson 2001: Regression derived from Post et al.’s 1982 data

26
Here’s some summary data on soil C storage
Here’s some summary data on soil C storage. The data are pretty good though (usually more than 100 soil pits, for these life-zones) based on Holdridge Life Zone divisions. Most of this is based on undisturbed ecosystems, however. Amundson 2001
 based on Holdridge Life Zone divisions. Most of this is based on undisturbed ecosystems, however. Amundson")
27
Missing pieces: Below-ground
We understand the general processes that limit soil C storage in undisturbed soil reasonably well. We also understand the trends of how land use change influences soil C storage, but need more field measurements. Moving to a larger scale requires modeling. We also need to synthesize this information with the data we have above-ground.

28
Land Use Transitions & Soil C
From Guo &Gifford 2002 agriculture has released 70 Gt of C to the atmosphere We do know a little bit though... this information is just starting to come together. There’s a lot of uncertainty, and a lot of caveats though. (i.e. Crop to plantation transition depends on species planted) Also, as you can see, our observations are not extensive, especially when you consider that we’re extrapolating to the global level in this paper.
 Also, as you can see, our observations are not extensive, especially when you consider that we’re extrapolating to the global level in this paper.")
29
Uncertainty in Transitions
Paul et al. 2002 As you can see, here’s another graphic that describes what happens to soil C when agriculture is returned to forest cover. There’s a lot of spread in these numbers... some positive, and some negative. The question is though, does this tell us enough to make predictions at a larger scale? (i.e. will we store a lot more carbon if we convert a bunch of acres into plantation?

30
From Guo &Gifford 2002 Pasture to Plantation This type of transition is common in New Zealand, where Pinus radiata plantations are common.

31
Missing pieces: Below-ground
We understand the general processes that limit soil C storage in undisturbed soil reasonably well. We also understand the trends of how land use change influences soil C storage, but need more field measurements. Moving to a larger scale requires modeling. We also need to synthesize this information with the data we have above-ground.

32
Scaling back up: Using models
Models have been used to link our small scale mechanistic understanding of carbon cycling to larger scale patterns. Model development needs more work: “Whether models are parameterized by biome or plant life form (or neither), use single or multiple soil layers, or include N and water limitation will all affect predicted outcomes.” (Jackson et al. 2000)
, use single or multiple soil layers, or include N and water limitation will all affect predicted outcomes. (Jackson et al. 2000)")
33
Soil C models Used primarily to scale up, or to feed in to carbon budget models One such model is the Century Model, a process-based model of soil nutrient dynamics. (Parton et al. 1994). It was created based on agricultural soils
. It was created based on agricultural soils.")
34
Missing pieces: Below-ground
We understand the general processes that limit soil C storage in undisturbed soil reasonably well. We also understand the trends of how land use change influences soil C storage, but need more field measurements. Moving to a larger scale requires modeling. We also need to synthesize this information with the data we have above-ground.

35
Carbon flux over time (from data in Houghton & Hackler 2002)
I can make the text bigger and change the colours if you want…

36
Land use trends In the U.S., much of the carbon sink is due to changing land uses and subtle management effects, such as reduced fire frequency that leads to woody encroachment (Schimel et al. 2001) In Europe, the carbon sink is the result of both land-use changes and increased tree growth due to CO2 fertilization & N-deposition (Schimel et al. 2001)
 In Europe, the carbon sink is the result of both land-use changes and increased tree growth due to CO2 fertilization & N-deposition (Schimel et al. 2001)")
37
Land-use trends II China
1949: new social system established, resulting in rapidly increasing population, economic development and, therefore, forest exploitation 1970’s to present: Chinese government has implemented several extensive forest restoration projects (Fang et al. 2001)
")
38
Land-use trends III New Zealand:
Increased planting of exotic forests (primarily Pinus radiata) is the biggest land-use change in New Zealand – ha in 1996 Organic C in the surface mineral-soil layers is 17-40% lower under plantation forests than pasture, although this may be offset by C-accumulation in the forest floor (Tate et al. 2000)
 is the biggest land-use change in New Zealand – ha in Organic C in the surface mineral-soil layers is 17-40% lower under plantation forests than pasture, although this may be offset by C-accumulation in the forest floor. (Tate et al. 2000)")
39
Future carbon trends Limitations to the US carbon sink?
How long will it last? How much C will it suck out of the atmosphere? What policies could limit or enhance the US carbon sink? Will agricultural abandonment & forest regrowth create another sink somewhere else? Or not?

40
Future social trends “Landsat photos showing that China is losing cultivated land to development two and one-half times faster than previously assumed have moved the Politburo into ordering tough new measures.” US Embassy, Beijing, June 1997

Similar presentations


: any form of life – population: a group of interacting individuals of same species – community: populations.>")
 Autumn Sun 1.>")
orbit (eccentricity), from ellipse to circle at 100,000 year cycles, b)wobble (precession),>")


