Download presentation
Presentation is loading. Please wait.

2
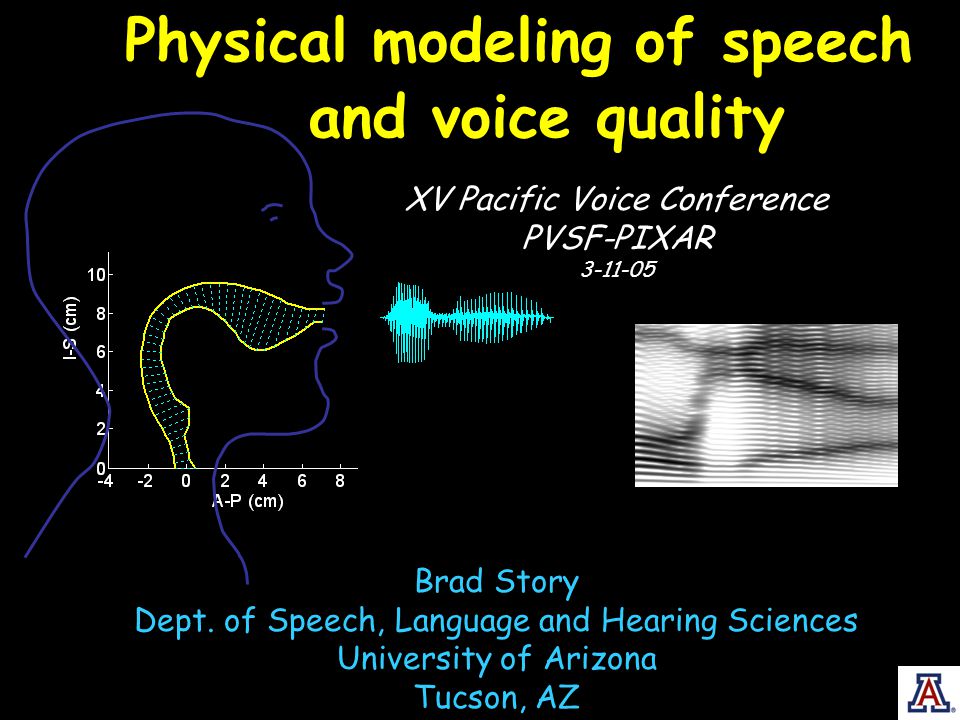
Physical modeling of speech XV Pacific Voice Conference PVSF-PIXAR 3-11-05 Brad Story Dept. of Speech, Language and Hearing Sciences University of Arizona Tucson, AZ and voice quality

3
Physical model of human sound production: A mathematical representation of the physical processes that produce the sounds of speech and song.

4
Sound Production = Combination of Sound Sources and Filters Filter: Air spaces created by the trachea, pharynx, oral cavity, nasal passages Trachea Primary Source: Vibration of the vocal folds creates a time-varying airflow (glottal flow). Nasal tract

5
Source Model: vocal fold vibration, glottal area, glottal flow, etc. F0, intensity, breathy/pressed, registers, biphonation, etc. Filter Model: acoustic wave propagation through the air spaces of the trachea, vocal and nasal tracts Formant frequencies (F1, F2, F3, …) Time variation of glottal parameters Time variation of vocal tract shape speech/song/other
 Time variation of glottal parameters Time variation of vocal tract shape speech/song/other.")
6
vocal folds output pressure Sagittal viewTubular approximation Source: glottal area/flow Low F0 Med F0 High F0

7
Output sound pressure Spectrogram F1 F2 F3 F0 F0 contour

8
Change the vocal tract shape to produce speech source filter output

9
Output sound pressure Spectrogram F1 F2 F3 F0 contour F0

10
F1 F2

11
Modeling Voice Quality “Voice quality is conceived here in a broad sense, as the characteristic auditory coloring of an individual speaker’s voice, and not in the more narrow sense of the quality deriving solely from laryngeal activity” From “The Phonetic Description of Voice Quality” by J. Laver (1980) What is voice quality?
 What is voice quality .")
12
Respiratory system structure & settings Laryngeal structure & settings Vocal Tract Structure & settings Temporal control Auditory coloring of an individual speaker’s voice results from:

13
Voice Quality Changes based on vocal tract modifications 1.Longitudinal: Modification of vocal tract length 2. Latitudinal: Tendencies to maintain a particular constrictive (or expansive) effect on the vocal tract shape.
 effect on the vocal tract shape..")
14
1.Modification of vocal tract length (+ temporal modification) L= 17.5 cm
 L= 17.5 cm")
15
1.Modification of vocal tract length (+ temporal and F0 modification) L= 23 cm L= 17.5 cm L= 11 cm 60% 40% 80% 20%
 L= 23 cm L= 17.5 cm L= 11 cm 60% 40% 80% 20%")
16
2. Tendencies to maintain a particular constrictive (or expansive) effect on the vocal tract shape. (+ F0 contour modification) “pharyngealized” “palatized”
 pharyngealized palatized .")
17
Beyond human voice quality… F0 = 30-50 Hz Vocal tract length = 31 cm F0 = 600-1000 Hz Vocal tract length = 4.4 cm

18
Singing…?? Singer’s formant

19
The End This work was supported by NIH R01-DC04789

Similar presentations


 Source-Filter Theory of Speech Production Capturing Speech Dynamics The Vowels The Diphthongs.>")
 J. Sundberg, The.>")


 Frequency is determined by thickness (mass)>")


