Download presentation
Presentation is loading. Please wait.

1
StatisticalDesign&ModelsValidation

2
Introduction

3
Bouma Gary D. & G.B.J.Atkinson. (1995) A Handbook of Social Science Research. p.3
 A Handbook of Social Science Research. p.3")
5
Interest Idea Theory ? Y Y ? X Y A B ? ? A B C D E F G H I Conceptualization Specify the meaning of the concepts and variables to be studied. Operationalization How will we actually measure the variables under study? Choice of Research Method Experimental Research Survey Research Field Research Content Analysis Existing Data Research Comparative Research Evaluation Research Mixed Design Population & Sampling Whom do we want to be able to draw conclusions about? Who will be observed for the purpose? Observation Collecting data for analysis and interpretation Data Processing Transforming the data collected into a form appropriate to manipulation and analysis Analysis Analyzing data and drawing conclusions Application Reporting results and assessing their implications. 1 1 2 2 3 3 5 5 4 4 6 6 7 7 8 8 9 9

6
Interest Idea Theory ? Y Y ? X Y A B ? ? A B C D E F G H I Conceptualization Specify the meaning of the concepts and variables to be studied. Operationalization How will we actually measure the variables under study? Choice of Research Method Experimental Research Survey Research Field Research Content Analysis Existing Data Research Comparative Research Evaluation Research Mixed Design Population & Sampling Whom do we want to be able to draw conclusions about? Who will be observed for the purpose? Observation Collecting data for analysis and interpretation Data Processing Transforming the data collected into a form appropriate to manipulation and analysis Analysis Analyzing data and drawing conclusions Application Reporting results and assessing their implications. 1 1 2 2 5 5 7 7 9 9 3 3 6 6 4 4 8 8

7
Interest Idea Theory ? Y Y ? X Y A B ? ? A B C D E F G H I Conceptualization Specify the meaning of the concepts and variables to be studied. Operationalization How will we actually measure the variables under study? Choice of Research Method Experimental Research Survey Research Field Research Content Analysis Existing Data Research Comparative Research Evaluation Research Mixed Design Population & Sampling Whom do we want to be able to draw conclusions about? Who will be observed for the purpose? Observation Collecting data for analysis and interpretation Data Processing Transforming the data collected into a form appropriate to manipulation and analysis Analysis Analyzing data and drawing conclusions Application Reporting results and assessing their implications.

8
Cross-sectional Study 2547 21-30 31-40 41-50 One-point of time Cross-sectional Study 2547 21-30 31-40 41-50 One-point of time Trend Study 2547255721-3031-4041-50 Same framework & instruments Trend Study 2547255721-3031-4041-50 Same framework & instruments Cohort Study 2547255721-3031-4041-50 51-60 Same framework & instruments Cohort Study 2547255721-3031-4041-50 51-60 Same framework & instruments Panel Study 2547255721-3031-4041-50 51-60 Same individuals Panel Study 2547255721-3031-4041-50 51-60 Same individuals

9
Probability Density Precision Reference value Accuracy Value Parameter Statistics

10
Probability Density Low Precision Reference value Low Accuracy Value Parameter Statistics

11
Probability Density Precision Reference value Low Accuracy Value Parameter Statistics

12
Quality of Measurement

13
A test with low validity because of low reliability A highly valid testA reliable test with low validity.

19
Statistical Model & Analysis & Analysis

21
Mean Standard deviation Variance, Covariance Frequency & Percentage & ratio Percentile, quartile Median & mode Range, etc.

22
Kurtosis Skewness Normal Distribution Multivariate Normality Multicolinearity Linearity Outliers

23
Mean (Y) Mean (X1) Mean (X2) Mean (X3) Descriptive Statistics: How Importance? Measure of Central Tendency: Mean, Mode, Median Measure of Dispersion: Variance, Standard Deviation, Mean Deviation, Range 2 X1 2 X2 2 X3 2Y2Y

24
Y Y X1 X2 X3 Descriptive Statistics: Mean Vector variance-covariance matrix 2 X1 2 X2 2 X3 2Y2Y 2Y2Y

25
2 X1 2 X2 2 X3 2Y2Y Cov (X1,Y) Cov (X1,X2) Cov (X1,X3) Cov (X2,X3) Cov (X2,Y) Cov (X3,Y) Cov (X1,Y) Cov (X1,X2) Cov (X1,X3) Cov (X2,X3) Cov (X2,Y) Cov (X3,Y)
 Cov (X1,X2) Cov (X1,X3) Cov (X2,X3) Cov (X2,Y) Cov (X3,Y) Cov (X1,Y) Cov (X1,X2) Cov (X1,X3) Cov (X2,X3) Cov (X2,Y) Cov (X3,Y)")
27
1 0 Y Y 10 01 00 100 010 001 000 d1 d2 d1 d2 d3 ตัวแปรสังเกตได้ Observed variable (Nominal Scale) Observed variable (Interval Scale) 11 11 Latent variable Causal relationship Relationsh ip d1 11 11
 Observed variable (Interval Scale) 11 11 Latent variable Causal relationship Relationsh ip d1 11 11")
28
Analysis Using Dependent Techniques

29
1 0 X1X1X1X1 Y Y One-way ANOVA (Independent sample t- test) Y post Y pre One-way ANOVA with repeated measured (Dependent sample t-test) Within-subjects Design ? ? Different Change, Gain, Development Between- subjects Design Direct effects

30
Bivariate Correlation Analysis (r xy ) Y Y X X rxyrxy Y Y X X Z Z Cov(x, y) rxyrxy ryzryz rxzrxz Cov(x, z) Cov(y, z) Cov(x, y)
 Y Y X X rxyrxy Y Y X X Z Z Cov(x, y) rxyrxy ryzryz rxzrxz Cov(x, z) Cov(y, z) Cov(x, y)")
31
X1 X2 X3 Y Y ? Partial & Part Correlation Analysis (Spurious or Indirect Causality) Direct effects
 Direct effects")
32
X1X1X1X1 Y Y 10 01 00 One-way ANOVA (F-test) Y T2 Y T1 One-way ANOVA with repeated measured Within-subjects Design Y T2 ? ? ? ? Between- subjects Design Direct effects

33
1 0 X1X1X1X1 Y Y Two-way ANOVA (additive model) -- >No interaction effects X2X2X2X2 10 01 00 Main effect- X1 Main effect- X2 Between- subjects Design Direct effects
 -- >No interaction effects X2X2X2X Main effect- X1 Main effect- X2 Between- subjects Design Direct effects")
34
1 0 X1X1 Y Y Two-way ANOVA (non-additive model) -- > Interaction effects X2X2 10 01 00 Main effect Interaction effect Between- subjects Design Direct effects
 -- > Interaction effects X2X Main effect Interaction effect Between- subjects Design Direct effects")
35
Y Y 1 0 1 0 10 01 00 Multi-way ANOVA (the interactive structure) X1X1 X2X2 X3X3 Between- subjects Design Direct effects Interaction effect Main effect
 X1X1 X2X2 X3X3 Between- subjects Design Direct effects Interaction effect Main effect")
36
Y Y One-way Analysis of Covariance (ANCOVA) additive model X1X1 10 01 00 (Covari ate) Z Z ? Between- subjects Design

37
Y Y 1 0 10 01 00 Two-way ANCOVA (Interactive structure) Z X1X1 X2X2 (Covari ate) Between- subjects Design Direct effects Main effect Interaction effect Main effect Interaction effect Main effect
 Z X1X1 X2X2 (Covari ate) Between- subjects Design Direct effects Main effect Interaction effect Main effect Interaction effect Main effect")
38
X1 X2 X3 Simple Regression Analysis (SRA) Multiple Regression Analysis (MRA) (Convergent Causal structure) No Correlation (r = 0) Direct effects y.x1 y.x2 y.x3 X X y.x Y Y X X rxyrxy
 Multiple Regression Analysis (MRA) (Convergent Causal structure) No Correlation (r = 0) Direct effects y.x1 y.x2 y.x3 X X y.x Y Y X X rxyrxy")
39
X1 X2 X3 Multivariate Multiple Regression Analysis (MMR) (Convergent Causal structure two or several times) Y1Y1 Y1Y1 Y2 Direct effects No Correlation (r = 0)
 (Convergent Causal structure two or several times) Y1Y1 Y1Y1 Y2 Direct effects No Correlation (r = 0)")
40
X1 X2 X3 Two-groups Discriminant Analysis (Discriminant structure) Binary Logistic Regression Analysis (Y)(Y)(Y)(Y) W W W Direct effects No Correlation (r = 0)
 Binary Logistic Regression Analysis (Y)(Y)(Y)(Y) W W W Direct effects No Correlation (r = 0)")
41
X1 X2 X3 Multiple Discriminant Analysis (Discriminant Structure with more than two population groups) 10 01 00 (Y)(Y)(Y)(Y) W W W Direct effects No Correlation (r = 0)
 (Y)(Y)(Y)(Y) W W W Direct effects No Correlation (r = 0)")
42
Y1 1 0 1 0 10 01 00 Multivariate Analysis of Variance -- MANOVA (Interactive Structure two or several times) Y2 X1X1 X2X2 X3X3 Main effect Interaction effect Main effect
 Y2 X1X1 X2X2 X3X3 Main effect Interaction effect Main effect")
43
Y1 1 0 10 01 00 Z Y2 Multivariate Analysis of Covariance -- MANCOVA (Interactive Structure two or several times) X1X1 X2X2 (Covari ate) Main effect Interaction effect Main effect
 X1X1 X2X2 (Covari ate) Main effect Interaction effect Main effect")
44
Analysis Using Interdependent Techniques

45
Canonical variates (Independe nt) Canonical variates (Dependent ) R C1, 1 Set of Independen t variables Set of Dependent variables Canonical Function-1 R C2, 2 Canonical Loading 2 Simple Correlation Canonical Correlation Analysis (CCA) Canonical weight Canonical Weight Canonical Function-2
 Canonical variates (Dependent ) R C1, 1 Set of Independen t variables Set of Dependent variables Canonical Function-1 R C2, 2 Canonical Loading 2 Simple Correlation Canonical Correlation Analysis (CCA) Canonical weight Canonical Weight Canonical Function-2")
46
Concept & Construct Variables Indicator Conceptual Definition Theoretical Definition Real Definition Conceptual Definition Theoretical Definition Real Definition Operational Definition (How to measured?) Operational Definition (How to measured?) Generalized idea Communication Real world Hypothesis testing Time, Space, Context
 Operational Definition (How to measured ) Generalized idea Communication Real world Hypothesis testing Time, Space, Context")
47
22 22 33 33 11 11 X1 X2 X3 X4 X5 X6 X7 X8 X9

48
22 22 33 33 11 11 X1 X2 X3 X4 X5 X6 X7 X8 X9

49
22 22 33 33 11 11 X1 X2 X3 X4 X5 X6 X7 X8 X9 2,1 3,1 3,2

50
22 22 33 33 11 11 X1 X2 X3 X4 X5 X6 X7 X8 X9 2,1 3,1 3,2 2,1 1,1 3,1 4,2 5,2 6,2 7,3 8,3 9,3

51
22 22 33 33 11 11 X1 X2 X3 X4 X5 X6 X7 X8 X9 2,1 3,1 3,2 2,1 1,1 3,1 4,2 5,2 6,2 7,3 8,3 9,3

52
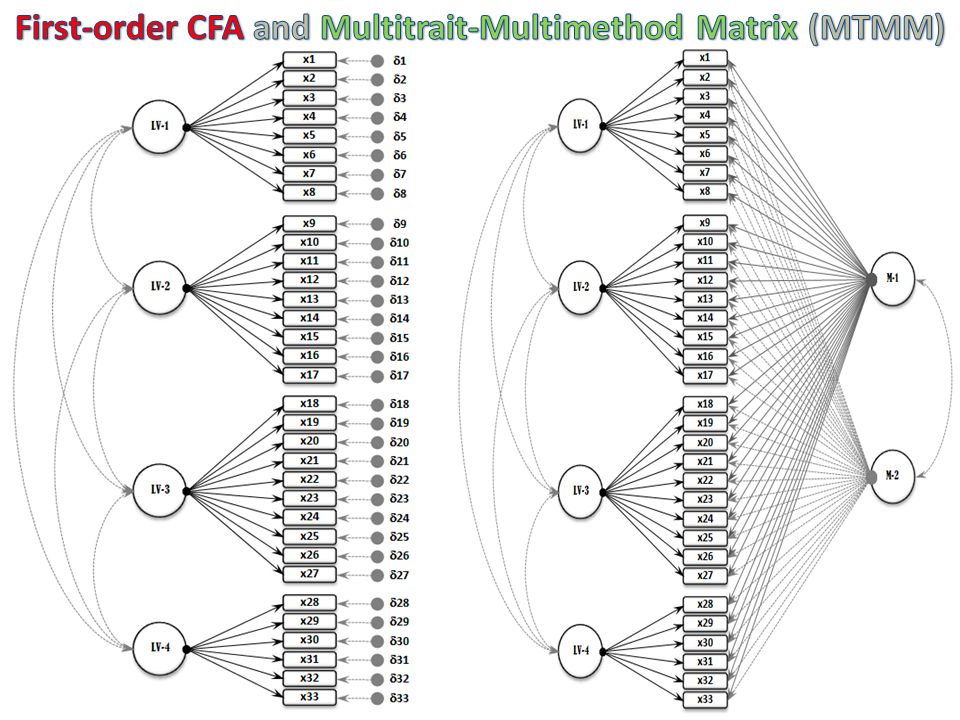
11 22 33 44 55 66 77 88 99 10 1111 12 13 14 15 16 17 18 19 20 21 22 23 24 25 26 27 28 29 30 31 32 33 x1 x2 x3 x4 x5 x6 x7 x8 x9 x10 x11 x12 x13 x14 x15 x16 x17 x18 x19 x20 x21 x22 x23 x24 x25 x26 x27 x28 x29 x30 x31 x32 x33 F-1 F-2 F-3 F-4 First-order Confirmatory Factor Analytic Model 2,1 3,2 4,3 3,1 4,2 4,1

53
11 22 33 44 55 66 77 88 99 10 1111 12 13 14 15 16 17 18 19 20 21 22 23 24 25 26 27 28 29 30 31 32 33 x1 x2 x3 x4 x5 x6 x7 x8 x9 x10 x11 x12 x13 x14 x15 x16 x17 x18 x19 x20 x21 x22 x23 x24 x25 x26 x27 x28 x29 x30 x31 x32 x33 F-1 F-2 F-3 F-4 F-A F-B Second-order Confirmatory Factor Analytic Model

55
M-1 x1 x2 x3 x4 x5 x6 x7 x8 x9 x10 x11 x12 x13 x14 x15 x16 x17 x18 x19 x20 x21 x22 x23 x24 x25 x26 x27 x28 x29 x30 x31 x32 x33 LV-1 LV-2 LV-3 LV-4 M-2

57
Analysis Using Dependent & Interdependent Techniques Sakesan Tongkhambanchong, Ph.D (Applied Behavioral Science Research)
")
58
Y Y X1 X2 X3 Causal Modeling I: Path Analysis with Observed Variables (Assumption: Measurement error = 0) Y Y X1 X2 X5 X4 Total Effect = Direct + Indirect Effects X3
 Y Y X1 X2 X5 X4 Total Effect = Direct + Indirect Effects X3")
59
22 1,1 2,1 3,1 2222 2222 Y 6, 2 Y 4, 2 Y 5, 2 1111 1111 X 3, 1 X 1, 1 X 2, 1 2222 2222 X 6, 2 X 4, 2 X 5, 2 1111 1111 Y 3, 1 Y 1, 1 Y 2, 1 Causal Modeling II: Path Analysis with Latent Variables Linear Structural Equation Modeling (SEM) (Assumption: Measurement error > 0) 4,2 1,1 5,2 6,3 2,1 3,1 4,2 5,2 6,2 11 Total Effect = Direct + Indirect Effects Path Analysis + Confirmatory Factor Analysis
 (Assumption: Measurement error > 0) 4,2 1,1 5,2 6,3 2,1 3,1 4,2 5,2 6,2 11 Total Effect = Direct + Indirect Effects Path Analysis + Confirmatory Factor Analysis")
Similar presentations


 Faculty of Education, Burapha University.>")


