Download presentation
Presentation is loading. Please wait.

1
Introductory Statistics for Laboratorians dealing with High Throughput Data sets Centers for Disease Control

2
Graphing the Relationship between Two Variables Problem 19 Graph the following on the axis provided Write the equation for the line X – ScaleY – Scale 25 49 49 511 715 817

3
Problem 19

5
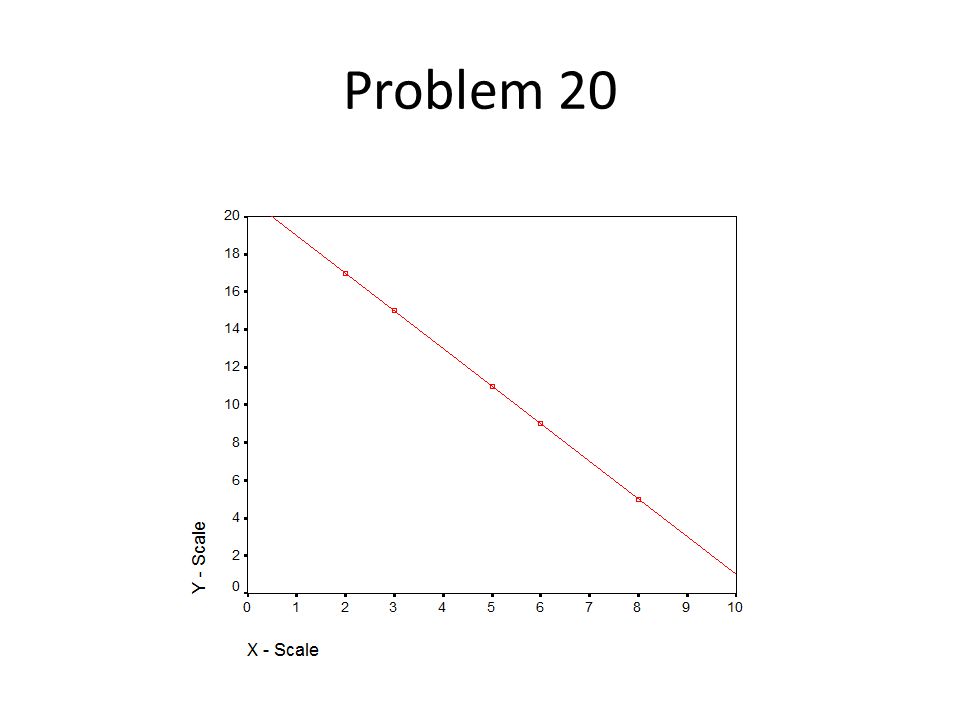
Problem 20 Graph the following on the axis provided Write the equation for the line X – ScaleY – Scale 217 315 511 69 69 85

6
Problem 20

8
Problem 21 Graph the following on the axis provided Describe the relationship between X and Y If we had theoretical reasons to believe the relationship is a straight line, what could account for the variability (error). X – ScaleY – Scale 12 23 22 35 45 57 65 86 97 108

9
Problem 21

11
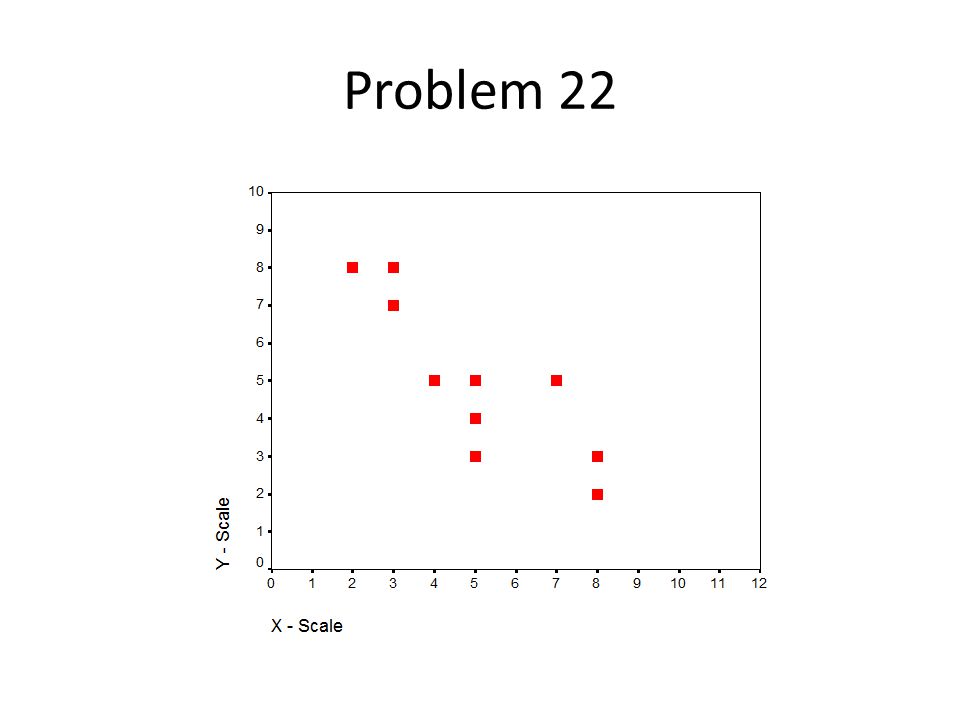
Problem 22 Graph the following on the axis provided Describe the relationship between X and Y X – ScaleY – Scale 28 37 38 45 54 55 53 75 83 82

12
Problem 22

14
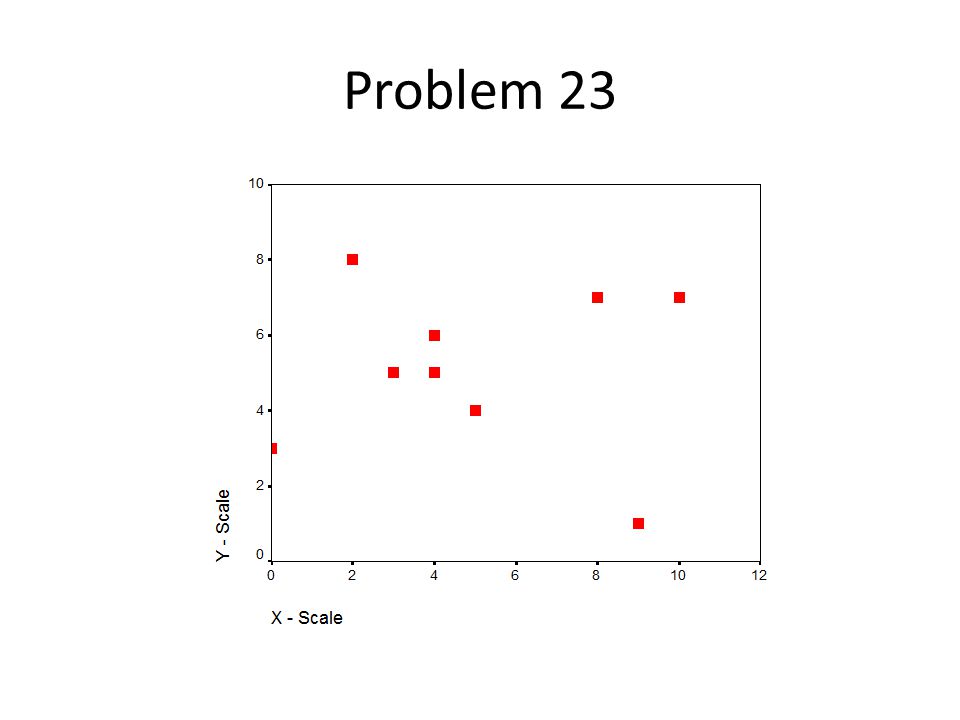
Problem 23 Graph the following on the axis provided Describe the relationship between X and Y X – ScaleY – Scale 03 28 35 46 45 54 54 87 91 107

15
Problem 23

17
Pearson Correlation Coefficient We need a way to quantify how correlated two variables are. Pearson invented the correlation coefficient Ranges from -1 to +1 Perfect Positive Correlation = +1 Perfect Negative Correlation = -1

18
Pearson’s r

21
Testing the Significance of Pearson’s r The null hypothesis is usually that the correlation between X and Y is zero (no relationship, nothing is happening). You have to know the degrees of freedom then the computer can look up the probability that the correlation is zero (could result from chance alone). If that probability is less than your chosen alpha, you reject the null hypothesis.
. If that probability is less than your chosen alpha, you reject the null hypothesis..")
22
Correlation Matrix Correlation matrix for five variables Variable12345 11.00.29.68.05.17 2.291.00.44.22.03 3.68.441.00.39.12 4.05.22.391.00.41 5.17.03.12.411.00

23
Factor Analysis Correlations between Variable V1 through V5 Showing Two Underlying Factors V1V2V3V4V5 V11.00 V2.801.00 V3.90.881.00 V4.20.15.201.00 V5.10.05.10.901.00 V1, V2, and V3 are highly correlated with each other and nearly uncorrelated with V4 and V5 V4 and v5 are highly correlated with each other and nearly uncorrelated with V1 – V3. Factor Analysis is a technique that identifies this sort of pattern in correlation a correlation matrix.

Similar presentations


, © 2005 Prentice Hall Chapter 3 Correlation and Prediction.>")