Download presentation
Presentation is loading. Please wait.

1
The Numbers Game A look inside the new U.S. News/Raytheon STEM Index Matthew Mason, Research Analyst U.S. News & World Report Presented at STEM Summit XI Bel Air, MD November 21, 2014

2
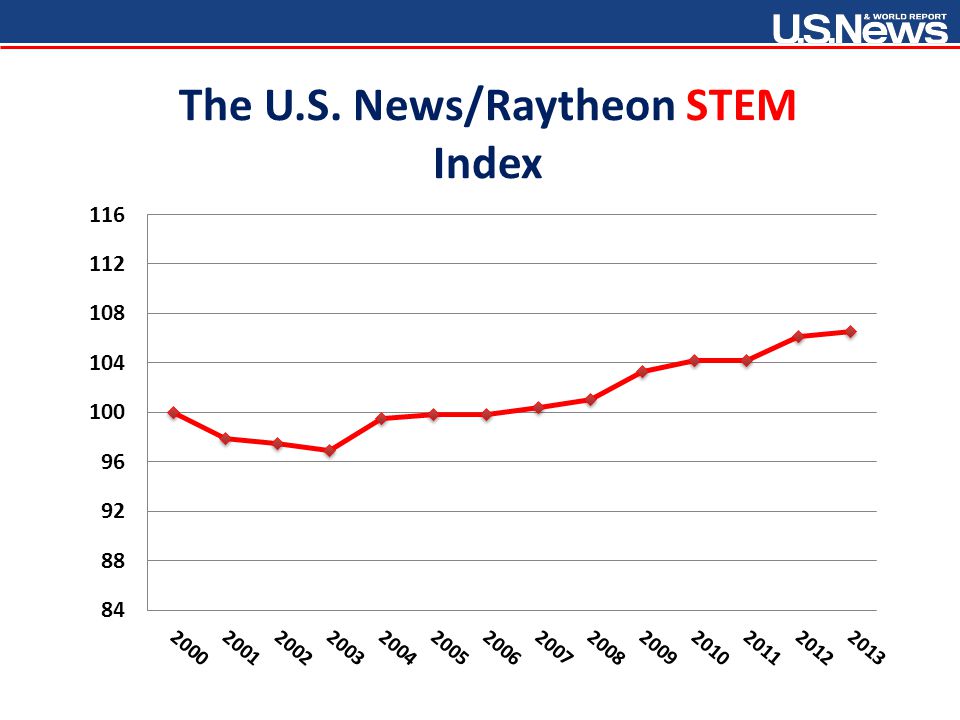
What is the U.S. News/Raytheon STEM Index? The STEM index is a tool that tracks the movements of all its STEM activity related components over time. The STEM index base year is 2000=100.0 The STEM index then measures the annual changes in the activity of STEM index’s components in relation to the year 2000.

3
The U.S. News/Raytheon STEM Index Data Breakdown 18 2 3 1 40 17 4 8 Number of Sub-Indices Components U.S. News/Raytheon STEM Index ACT – Math/ScienceAPDegrees GrantedEmploymentHigh School InterestNAEP - MathPISA – Math/ScienceSAT - Math

4
The U.S. News/Raytheon STEM Index Weight Distribution

6
STEM Employment Source: Bureau of Labor Statistics, Occupational Employment Statistics STEM definition: Based on Office of Management and Budget list Measures: The # of STEM jobs / # of all jobs In 2000: 12.8 million STEM Jobs, constituting 10.6% of the U.S. economy In 2013: 16.8 million STEM jobs, constituting 12.7% of U.S. economy

7
STEM Degrees Granted Source: National Center for Education Statistics (NCES) STEM definition: Department of Homeland Security List Measures: # of STEM degrees/ # of all degrees, by degree type. % of Weight Associates Degrees: 20% Bachelors Degrees: 40% Graduate Degrees: 40% * 2013 value is an estimate

8
Degrees Granted (data) * 2013 values are estimates
 * 2013 values are estimates")
9
Advanced Placement (AP) Data: Weight: % of STEM Tests 25% Taken / All AP tests % of STEM Tests 75% Taken (Scored 3 or Higher) / All AP tests Source: College Board
 Data: Weight: % of STEM Tests 25% Taken / All AP tests % of STEM Tests 75% Taken (Scored 3 or Higher) / All AP tests Source: College Board")
10
AP (data)
")
11
High School Interest in STEM Source: MyCollegeOptions Breakdown: Measures: % of HS students interest in STEM Data: Discipline Gender Ethnicity Gender Ethnicity

12
High School Interest…cont

13
PISA – Program for International Student Assessments Breakdown: Measures: Scores of 15-year-olds in Math & Science by US/ OECD Average Years: Every 3 U.S. Averages Math Science Source: Organization for Economic Cooperation and Development (OECD)
.")
14
PISA Continued… U.S. 2012 OECD Ranks Math: 26 th out of 34 Science: 21 st out of 34

15
NAEP – National Assessment of Educational Progress Source: National Center for Education Statistics (NCES) Breakdown: Measures: 4 th and 8 th Grade Math Scores Years: Biannual since ‘01 Data: Average Math Scores Gender Breakdown Ethnic Breakdown
 Breakdown: Measures: 4 th and 8 th Grade Math Scores Years: Biannual since ‘01 Data: Average Math Scores Gender Breakdown Ethnic Breakdown")
16
SAT Source: College Board Data breakdown: Average Math Scores Gender Breakdown Ethnic Breakdown

17
SAT Continued…

18
ACT Data Breakdown: Average Math Scores Gender Ethnicity Average Science Scores Gender Ethnicity

19
Goals for STEM Index 2.0 Dive deeper in the data - Which specific STEM careers are growing? - Who are getting STEM degrees? Add New data - What are the earnings of STEM workers like compared to other careers? - Are there other educational factors we can add?

20
Questions? Contact Information Matthew Mason mmason@usnews.com

Similar presentations